Tilapia is a commercially important species widely distributed in over 100 countries. It has become the second most commonly cultured freshwater fish after carp in the world(Reference Boonanuntanasarn, Nakharuthai and Schrama1). Nile tilapia (Oreochromis niloticus) has dominated tilapia aquaculture due to its high nutritional value, high growth rate and yield. Because of its increasing market demands, O. niloticus have also become the most extensively cultured freshwater fish in China since it is introduced in 1978.
The combination of high nutritional value and increasing market demands has stimulated the development of the industry of tilapia-formulated feed. Dietary proteins are primary factors influencing fish growth and feed costs. Fishmeal has been one of the main animal protein sources in the formulated aquafeeds. However, the market price of fishmeal has sharply increased by nearly 300 % in the past decade because of the increasing demand and the restrictions on fishing wild fish(Reference Beal, Gerber and Thongrod2). Undoubtedly, the growth of aquaculture production is fundamentally unsustainable if fishmeal is still used as the main source of protein for aquafeeds. Consequently, plant protein sources derived from crops such as soyabeans, peanuts, maize or wheat have become frequently used alternative sources of fishmeal in aquafeeds(3). Large-scale application of plant protein in aquafeeds can reduce feed costs, but the application effect of plant protein is unsatisfactory due to nutritional constraints such as imbalance of amino acid composition, presence of anti-nutritional compounds, poor palatability and poor digestibility(Reference Hardy4).
Essential amino acids (EAA) deficiency in formulated fish feed may cause poor growth, immunosuppression and poor diet efficiency(Reference Niu, Lemme and He5). Methionine (Met) is considered to be the first limiting EAA in most plant protein sources(Reference Belghit, Skiba-Cassy and Geurden6). Supplementation of Met in diets containing higher levels of plant protein is becoming popular. Supplementation with Met in plant protein-based diets can improve growth performance, immune capacity, feed conversion efficiency and body composition, which have been reported in Scophthalmus maximus (Reference Gao, Wang and Tan7), Pelodiscus sinensis (Reference Zhou, Wang and Bei8), Sparus aurata (Reference Kokou, Sarropoulou and Cotou9), Oncorhynchus mykiss (Reference Belghit, Skiba-Cassy and Geurden6), Litopenaeus vannamei (Reference Gu, Zhang and Bai10), Myxocyprinus asiaticus (Reference Yuan, Gong and Yang11) and Pseudosciaena crocea (Reference Mai, Wan and Ai12). However, the effects of Met, especially Met-Met products, on O. niloticus have not been reported. Currently, Met products used in aquafeeds mainly include dl-methionine (dl-Met), l-methionine (l-Met) or methionine hydroxy analogue (MHA) Ca salt, which have also been proven to be utilised by aquatic animals(Reference Gao, Wang and Tan7,Reference Niu, Du and Lin13,Reference Li, Burr and Wen14) . The bioavailability of different forms of Met is also considered by nutritionists. Studies in fish have shown that the bioavailability of MHA is significantly lower than that of dl-Met(Reference Goff and Gatlin15,Reference Kelly, Grisdale-Helland and Helland16) . The difference in the bioavailability of different Met products in aquatic animals may be related to differences in the product leaching in water, absorption rate in the intestine, and bioconversion into l-Met. Undoubtedly, it is necessary to study the bioavailability of different Met products to different aquatic animals.
The dissolution or leaching rate of Met additives in water is one of the important indexes for comparing different Met products. Meanwhile, the efficiency of Met additives to be absorbed and utilised by animals is also very important. The dipeptide dl-methionyl-dl-methionine (Met-Met), developed by Evonik’s aqua R&D group, has excellent physical and chemical properties, such as extremely low water solubility and better absorption than other Met products (such as dl-Met and l-Met)(Reference Niu, Lemme and He5). Met-Met additives can improve growth, feed conversion efficiency and intestinal immune function, which have been reported in L. vannamei (Reference Niu, Lemme and He5,Reference Xie, Lemme and He17) and Ctenopharyngodon idella (Reference Su, Wu and Feng18). Because of low water solubility and a lower leaching rate, Met-Met does not represent a risk to the environment(19). Met-Met has the potential to replace supplemental-free amino acid Met in aquafeeds and is an effective source of the EAA l-Met.
Until now, the effect of Met-Met products on O. niloticus has not been reported. The effect of Met-Met on intestinal microflora of fish has not been reported yet. Diversity of intestinal microflora plays a critical role in modulating the fish physiology(Reference Tarnecki, Burgos and Ray20). Intestinal microflora can influence fish feeding, digestion, growth and energy homeostasis(Reference Butt and Volkoff21). Therefore, the main purpose of the present study was to evaluate the effects of Met-Met supplementation on growth performance, antioxidant capacity, body composition and intestinal microbiota of grower-phase O. niloticus. In the present study, optimal Met-Met supplementation for O. niloticus was first reported. Our data contribute to improve the current understanding of the response relationship between Met and fish intestinal microflora. These results might provide a reference for formulated feed of O. niloticus.
Materials and methods
Diet preparation
Met-Met was obtained from Evonik Degussa (China) Co., Ltd. Guangzhou Branch.
Six isonitrogenous and isolipidic diets (D1, D2, D3, D4, D5 and D6) containing 0 % (control group), 0·1, 0·2, 0·3, 0·4 and 0·5 % Met-Met were formulated, and their proximate composition is shown in Table 1. The actual concentrations of Met and Met-Met in the six experimental diets are shown in Table 2. The main protein and energy sources used are soyabean meal, rapeseed meal, wheat flour, rice, soyabean oil and soyabean lecithin. Six experimental diets were supplemented with amino acids, such as glycine, lysine, threonine, tryptophan, isoleucine, leucine, valine and histidine, to ensure that the diets were nutritionally adequate for the fish.
Table 1. Composition and nutrient levels of the experimental diets (%)
* Vitamin premix provides the following per kg of diet: cholecalciferol 0·6 MIU, thiamin 3·6 g, riboflavin 7·2 g, pyridoxine HCl 6·6 g, cyanocobalamin 0·02 g, tocopherol 16·5 g, menadione 2·4 g, nicotinic acid 14·4 g, calcium pantothenate 4 g, biotin 0·02 g, folic acid 1·2 g, inositol 30 g, ascorbic acid 100 g; cellulose was used as a carrier.
† Mineral premix provides the following per kg of diet: P 120 g, Ca 120 g, Mg 15 g, Fe 1·5 g, Zn 4·2 g, Cu 2·1 g, K 75 g, Co 0·11 g, Mn 1·6 g, Se 0·01 g, Mo 0·005 g, Al 0·025 g, iodine 0·4 g; cellulose was used as a carrier.
‡ Measured values.
Table 2. Amino acid composition of six experimental diets (% DM basis)
Diets were prepared according to the method of Niu et al. (Reference Niu, Chen and Lu22). Briefly, all dry ingredients were finely ground, accurately weighed and thoroughly mixed and homogenised. Then, the oil mix and distilled water were added to the mixture. The 2·5-mm-diameter puffed pellets were produced by using a puffing apparatus (Institute of Chemical Engineering, South China University of Technology). The pellets were then dried in a forced air oven at 40°C until the moisture was reduced to <10 % and stored at −20°C until used.
Fish and experimental setup
Juvenile O. niloticus was obtained from Guangdong Provincial Fishery Germplasm Conservation Center (Guangzhou, China). Fish were acclimated to the experimental conditions and fed the control group diet for 2 weeks prior to starting the experiments. A total of 540 fish with an initial body weight of about 17·15 g were randomly assigned into eighteen fibreglass tanks (800 litres, three tanks per diet, thirty fish per tank). Each tank was equipped with a water exchange system and uninterrupted oxygenation system. The conditions of water temperature (26 (sd 1)°C), dissolved oxygen (>6·0 mg/l), ammonia-nitrogen (<0·3 mg/l) and nitrite-nitrogen (<0·10 mg/l) were ensured during the experimental period.
During the experimental period, the fish were fed two times per d at 08.00 and 17.00 hours, for fifty-six consecutive days, at 5 % of their body weight. At 1 h after feeding, uneaten feed and faeces were siphoned from tanks. Uneaten feed particles were dried and weighed and used to calculate feed intake. Every morning before feeding, fish were counted in each tank and were recorded to calculate the survival rate.
Sample collection and growth performance analysis
At the end of the feeding trial, all fish were fasted for 24 h to enter a basic metabolic state and eliminate the dietary effect. Seventeen fish per tank were randomly collected and anaesthetised with MS-222 (Sigma) and individually weighed. Body weight and feed data were used to calculate the percentage weight gain (PWG), specific growth rate (SGR), feed conversion ratio and protein efficiency ratio. Four fish for the analysis of whole-body composition, four fish for the analysis of muscle composition, and another four fish for the analysis of whole-body amino acid composition were used. The whole body and muscle of fish were sampled and stored at −20°C for body composition analysis. Then, five fish were collected and aseptically killed in ice bath, and their liver and gut were rapidly frozen in liquid N2 and stored at −80°C for antioxidant enzymes activity and microbial flora analysis, respectively. All the experiments were conducted in accordance with the recommendations in the Guide for the Care and Use of Laboratory Animals of the National Institutes of Health. The study protocol and all experimental procedures were approved by Experimental Animal Ethics Committee of Sun Yat-sen University.
PWG, SGR, protein efficiency ratio, feed conversion ratio and survival were calculated according to the following equations:
 $${\rm{PWG}}\left \,( \% \right) = 100 \times \left( {{W_f} - {W_i}} \right)/{W_i}$$
 $${\rm{SGR\,(}}\% /{\rm{ d}}}{\rm{)}} = 100 \times (\ln {W_f} - \ln {W_i})/t$$
 $${\rm{Survival}}\,{\rm{(}}\% {\rm{)}} = 100 \times {N_t}/{N_0}$$
 $${\rm{FCR}} = {\rm{dry}}\,{\rm{feed}}\,{\rm{intake}}/({W_t} - {W_0})$$
 $${\rm{PER}} = 100 \times ({W_t} - {W_0})/(I \times {C_{Nf}})$$
where W f and W i are mean final and initial fish body weights, respectively; t is the duration of the experiment (56 d); N t is the number of fish at the end of the experiment and N 0 at the start; W t (g) is the total final body weight and W 0 (g) total initial body weight; C Nf (%) is the protein content in the feed and I (g) is the total amount of the feed fed on a dry weight basis.
Chemical analysis of feed and body composition
The experimental diets and fish samples were analysed in triplicate for proximate composition. Crude protein, crude lipid and ash were determined using the standard method of the Association of Official Analytical Chemists. Moisture was determined by drying in an oven at 105°C for 24 h; crude protein content (N × 6·25) was determined by the Kjeldahl method after acid digestion (1030-Auto-analyzer, Tecator); crude lipid was measured by diethyl ether extraction method by a Soxtec System HT (Soxtec System HT6, Tecator); crude ash was examined after combustion in a muffle furnace at 550°C for 24 h.
The amino acid composition of all samples was analysed according to the method of Niu et al. (Reference Niu, Lemme and He5). Briefly, all samples were submitted to an acid hydrolysis, and then amino acid composition of all samples was analysed using an automatic amino acid analyser (Hitachi 835-50) with a column (Hitachi custom ion exchange resin no. 2619) by Evonik Degussa (China) Co. Ltd.
Activity quantification of antioxidant enzymes
Fish liver samples were homogenised 1:9, w/v in ice-cold 50 mm Tris-HCl buffer solution (pH 7·4) and centrifuged at 12 000 g for 15 min at 4°C, and the cold supernatant was used for the determination of enzymatic activity. Superoxide dismutase (SOD) activity was determined by its ability to inhibit superoxide anion produced by xanthine and xanthine oxidase reaction system(Reference Lin, Jiang and Chen23). Malondialdehyde (MDA) contents were measured by the thiobarbituric acid method according to Miller & Aust(Reference Miller and Aust24). Catalase (CAT) activity was determined by determining the initial amount of hydrogen peroxide decomposition at 240 nm(Reference Chen, Zeng and Cao25). Antioxidants could reduce Fe3+ to Fe2+, the later could form solid clathrate with phenanthroline, and then the total antioxidant capacity (T-AOC) was measured according to the absorption value at 520 nm(Reference Song, Wang and Li26). The activities of SOD and CAT, T-AOC and the content of MDA were determined by using commercial kits (Nanjing Jiancheng Bioengineering Institute) following the manufacturer’s protocol.
DNA extraction and high-throughput sequence analysis
Total bacterial DNA of gut was extracted directly with the E.Z.N.A. stool DNA Kit (Omega Biotek) according to manufacturer’s instructions. The total DNA concentration and quality were measured by a NanoDrop spectrophotometer (ND-2000, Thermo Fisher Scientific) and 1 % agarose gel electrophoresis, respectively. The V4 domain of bacterial 16S rDNA was amplified using the primer pair 515 F (5′ GTGCCAGCMGCCGCGGTAA 3′) and 806 R (5′ GGACTACHVGGGTWTCTAAT 3′). The reverse primer contained a 6-bp error-correcting barcode unique to each sample. The PCR reactions contained 100 ng DNA template, 1·5 μl of each forward and reverse primer (5 μm), 5 μl of 2·5 mm dNTPs, 1 μl of Thermococcus kodakaraensis (KOD) polymerase and 5 μl of 10 × KOD buffer. Reaction conditions consisted of an initial 94°C for 3 min, followed by thirty-five cycles of 94°C for 45 s, 50°C for 60 s and 72°C for 90 s, with a final extension of 72°C for 10 min. Sequencing was performed using the Illumina HiSeq platform by Biomarker.
Raw reads were de-multiplexed, quality-filtered and analysed using QIIME (version 1.8.0, http://qiime.org/)(Reference Caporaso, Kuczynski and Stombaugh27). The low-quality reads were filtered through following rules: Sequences that were shorter than 150 bp, average Phred scores below 20, contained primer mismatches, ambiguous bases or mononucleotide repeats longer than 8 bp(Reference Li, Zhang and Gu28–Reference Gill, Pop and DeBoy30). FLASH(Reference Magoc and Salzberg31) (version 1.2.7, http://ccb.jhu.edu/software/FLASH/) was used to merge the pairs of reads from the original DNA fragments. Analyse the reads and pick operational taxonomic units (OTU) were done using QLIME software package (http://qiime.org/) and UPARSE pipeline (http://drive5.com/uparse/). The remaining high-quality sequences were assigned to OTU at 97 % sequence similarity by UCLUST(Reference Edgar32) and then classified taxonomically using the Ribosomal Database Project classifier(Reference Wang, Garrity and Tiedje33). The raw reads were deposited into the NCBI Sequence Read Archive database (Accession Number: SRP190011).
Alpha diversity indices including the Chao1 index (Chao1) and Shannon diversity index were calculated by QIIME (http://qiime.org/scripts/alpha_diversity.html). The Shannon index and Chao1 were used to assess microbiota diversity and evenness. Beta diversity analysis was used to assess the composition variation of microbial communities among samples using UniFrac distance metrics and visualised via principal coordinate analysis(Reference Lozupone and Knight34).
Statistical analysis
All data are presented as means with their standard errors. Statistical analyses were conducted using SPSS 19.0 (SPSS) and checked for normality and homogeneity of variance before analysis. The growth performance, activity of antioxidant enzymes, proximate composition (diets, whole body and muscle), amino acid composition and alpha diversity were subjected to one-way ANOVA. The differences among treatment means were resolved using Duncan’s new multiple range test(Reference Duncan35). P values < 0·05 were considered statistically significant.
Results
Growth performance
Significant differences were detected in the growth performance of O. niloticus fed with different diets (Table 3). Results showed that survival rate was in the range of 71–100 % with no significant difference detected among treatments (P > 0·05). PWG and SGR of O. niloticus fed with D3 diet were significantly higher than those fed with D1, D4–D6 diets (P < 0·05) but without significant differences with O. niloticus fed the D2 diet (P > 0·05). O. niloticus fed with D3 diet showed the highest value of FBW and significantly higher than that of fish fed D6 diet (P < 0·05), but without significant differences with O. niloticus fed the D1, D2, D4 and D5 diets (P > 0·05). No significant differences were found in feed conversion ratio and protein efficiency ratio of O. niloticus among all diet treatments (P > 0·05).
Table 3. Growth performance of Oreochromis niloticus fed experimental diets for 56 d
(Mean values with their standard errors of three replicates)
IBW, initial body weight; FBW, final body weight; PWG, percentage weight gain; SGR, specific growth rate; FCR, feed conversion ratio; PER, protein efficiency ratio.
a,b Mean values in a column with unlike superscript letters were significantly different (P < 0·05).
Whole body and muscle composition
The proximate composition of whole body of O. niloticus among all diet treatments is shown in Table 4. No significant differences were found in protein, ash and lipid contents of whole body among all diet treatments (P > 0·05). Moisture contents of whole body of O. niloticus fed with D2 and D5 diets were significantly lower than those fed with D1 diet (P < 0·05) but without significant differences with O. niloticus fed the D3, D4 and D6 diets (P > 0·05).
Table 4. Whole body composition (% DM) of Oreochromis niloticus fed experimental diets for 56 d
(Mean values with their standard errors of three replicates)
a,b Mean values in a row with unlike superscript letters were significantly different (P < 0·05).
The proximate composition of muscle of O. niloticus among all diet treatments is shown in Table 5. No significant differences were found in protein, ash and lipid contents of muscle among all diet treatments (P > 0·05). Moisture contents of muscle of O. niloticus fed with D4 diets were significantly lower than those fed with D1 and D3 diets (P < 0·05) but without significant differences with O. niloticus fed the D2, D5 and D6 diets (P > 0·05).
Table 5. Muscle composition (% DM) of Oreochromis niloticus fed experimental diets for 56 d
(Mean values with their standard errors of three replicates)
a,b Mean values in a row with unlike superscript letters were significantly different (P < 0·05).
Whole body essential amino acid profile
The EAA composition of whole body of O. niloticus among all diet treatments is shown in Table 6. No significant differences were found in tryptophan, isoleucine and valine levels in whole body of O. niloticus among the dietary treatments (P > 0·05). There were significant differences in the composition of other EAA in O. niloticus between the experimental groups. Met level in whole body of O. niloticus fed with D3 and D4 diets was significantly higher than those fed with D1 and D2 diets (P < 0·05) but without significant difference with O. niloticus fed the D5 and D6 diets (P > 0·05). Arginine level in whole body of O. niloticus fed with D3, D4 and D6 diets was significantly higher than those fed with D1 and D2 diets (P < 0·05) but without significant difference with O. niloticus fed the D5 diet (P > 0·05). Lysine, histidine, leucine and phenylalanine levels of O. niloticus fed with D3 and D4 diets were significantly higher than those fed with D1 diet (P < 0·05) but without significant difference with O. niloticus fed the D2, D5 and D6 diets (P > 0·05). Threonine level of O. niloticus fed with D3 diet was significantly higher than those fed with D1 and D2 diets (P < 0·05) but without significant difference with O. niloticus fed the D4–D6 diets (P > 0·05). Total EAA content in whole body of O. niloticus fed with D3 and D4 diets was significantly higher than those fed with D1 and D2 diets (P < 0·05) but without significant difference with O. niloticus fed the D5 and D6 diets (P > 0·05).
Table 6. Essential amino acid (EAA) profile (% DM basis) in the whole body of Oreochromis niloticus fed experimental diets for 56 d
(Mean values with their standard errors of three replicates)
a,b,c Mean values in a row with unlike superscript letters were significantly different (P < 0·05).
Antioxidant capacity
Antioxidant capacity of O. niloticus is shown in Table 7. T-AOC was significantly higher in O. niloticus fed with D3 diet, than in O. niloticus fed with D1, D2 and D4–D6 diets (P < 0·05). The SOD activity and MDA content of O. niloticus fed with D2–D6 diets had no significant difference compared with O. niloticus fed the D1 diet (P > 0·05). No significant differences were found in CAT activity among all diet treatments (P > 0·05).
Table 7. Effect of experimental diets on antioxidant parameters (catalase (CAT), U/mg protein; superoxide dismutase (SOD), U/mg protein; malondialdehyde (MDA), nmol/mg protein; total antioxidant capacity (T-AOC), mg protein/ml) of Oreochromis niloticus at the end of the trial (56 d)
(Mean values with their standard errors of three replicates)
a,b,c,d Mean values in a row with unlike superscript letters were significantly different (P < 0·05).
Composition of intestinal microbiota
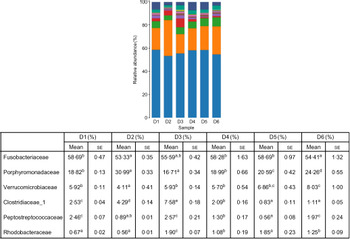
A total of 5 628 254 high-quality sequencing reads were obtained, and they were clustered into OTU of ≥97 % identity. The number of OTU detected in each sample ranged from 431 to 456 (Table 8). Samples from the six diet groups were well separated. At the phylum level, Fusobacteria (53·44–58·82 %) was the dominant phylum in all the six dietary treatments and then followed by Bacteroidetes (16·75–30·99 %) (Fig. 1). Bacteroidetes in the D3 diet treatment was significantly lower than those from other diets treatments; however, Firmicutes in the D3 diet treatment was significantly higher than those from other diets treatments (P < 0·05). At the family level, Fusobacteriaceae (53·33–58·69 %) was the dominant family in all six diets treatments, and then followed by Porphyromonadaceae (16·71–30·99 %) (Fig. 2). Porphyromonadaceae in the D3 diet treatment was significantly lower than those from other diets treatments; however, Clostridiaceae_1 in the D3 diet treatment was significantly higher than those from other diets treatments; moreover, Rhodobacteraceae from D3–D6 diets treatments was significantly higher than those from D1 and D2 diets treatments (P < 0·05). At the genus level, Cetobacterium (55·50–58·22 %) was the dominant genus in all the six diets treatments and then followed by uncultured_bacterium_f_Porphyromonadaceae (17·75–20·74 %) (Fig. 3). No significant difference at genus level was found in all the six dietary treatments (P > 0·05).
Table 8. Diversity index of gut bacteria of juvenile Oreochromis niloticus fed the six experimental diets for 8 weeks based on V4 sequences*
(Mean values with their standard errors)
OTU, operational taxonomic units; Chao1, Chao 1 index; Shannon, Shannon diversity index.
a,b,c Mean values in a row with unlike superscript letters were significantly different (P < 0·05).
* n 4 for OTU and n 10 for Chao1 and Shannon.
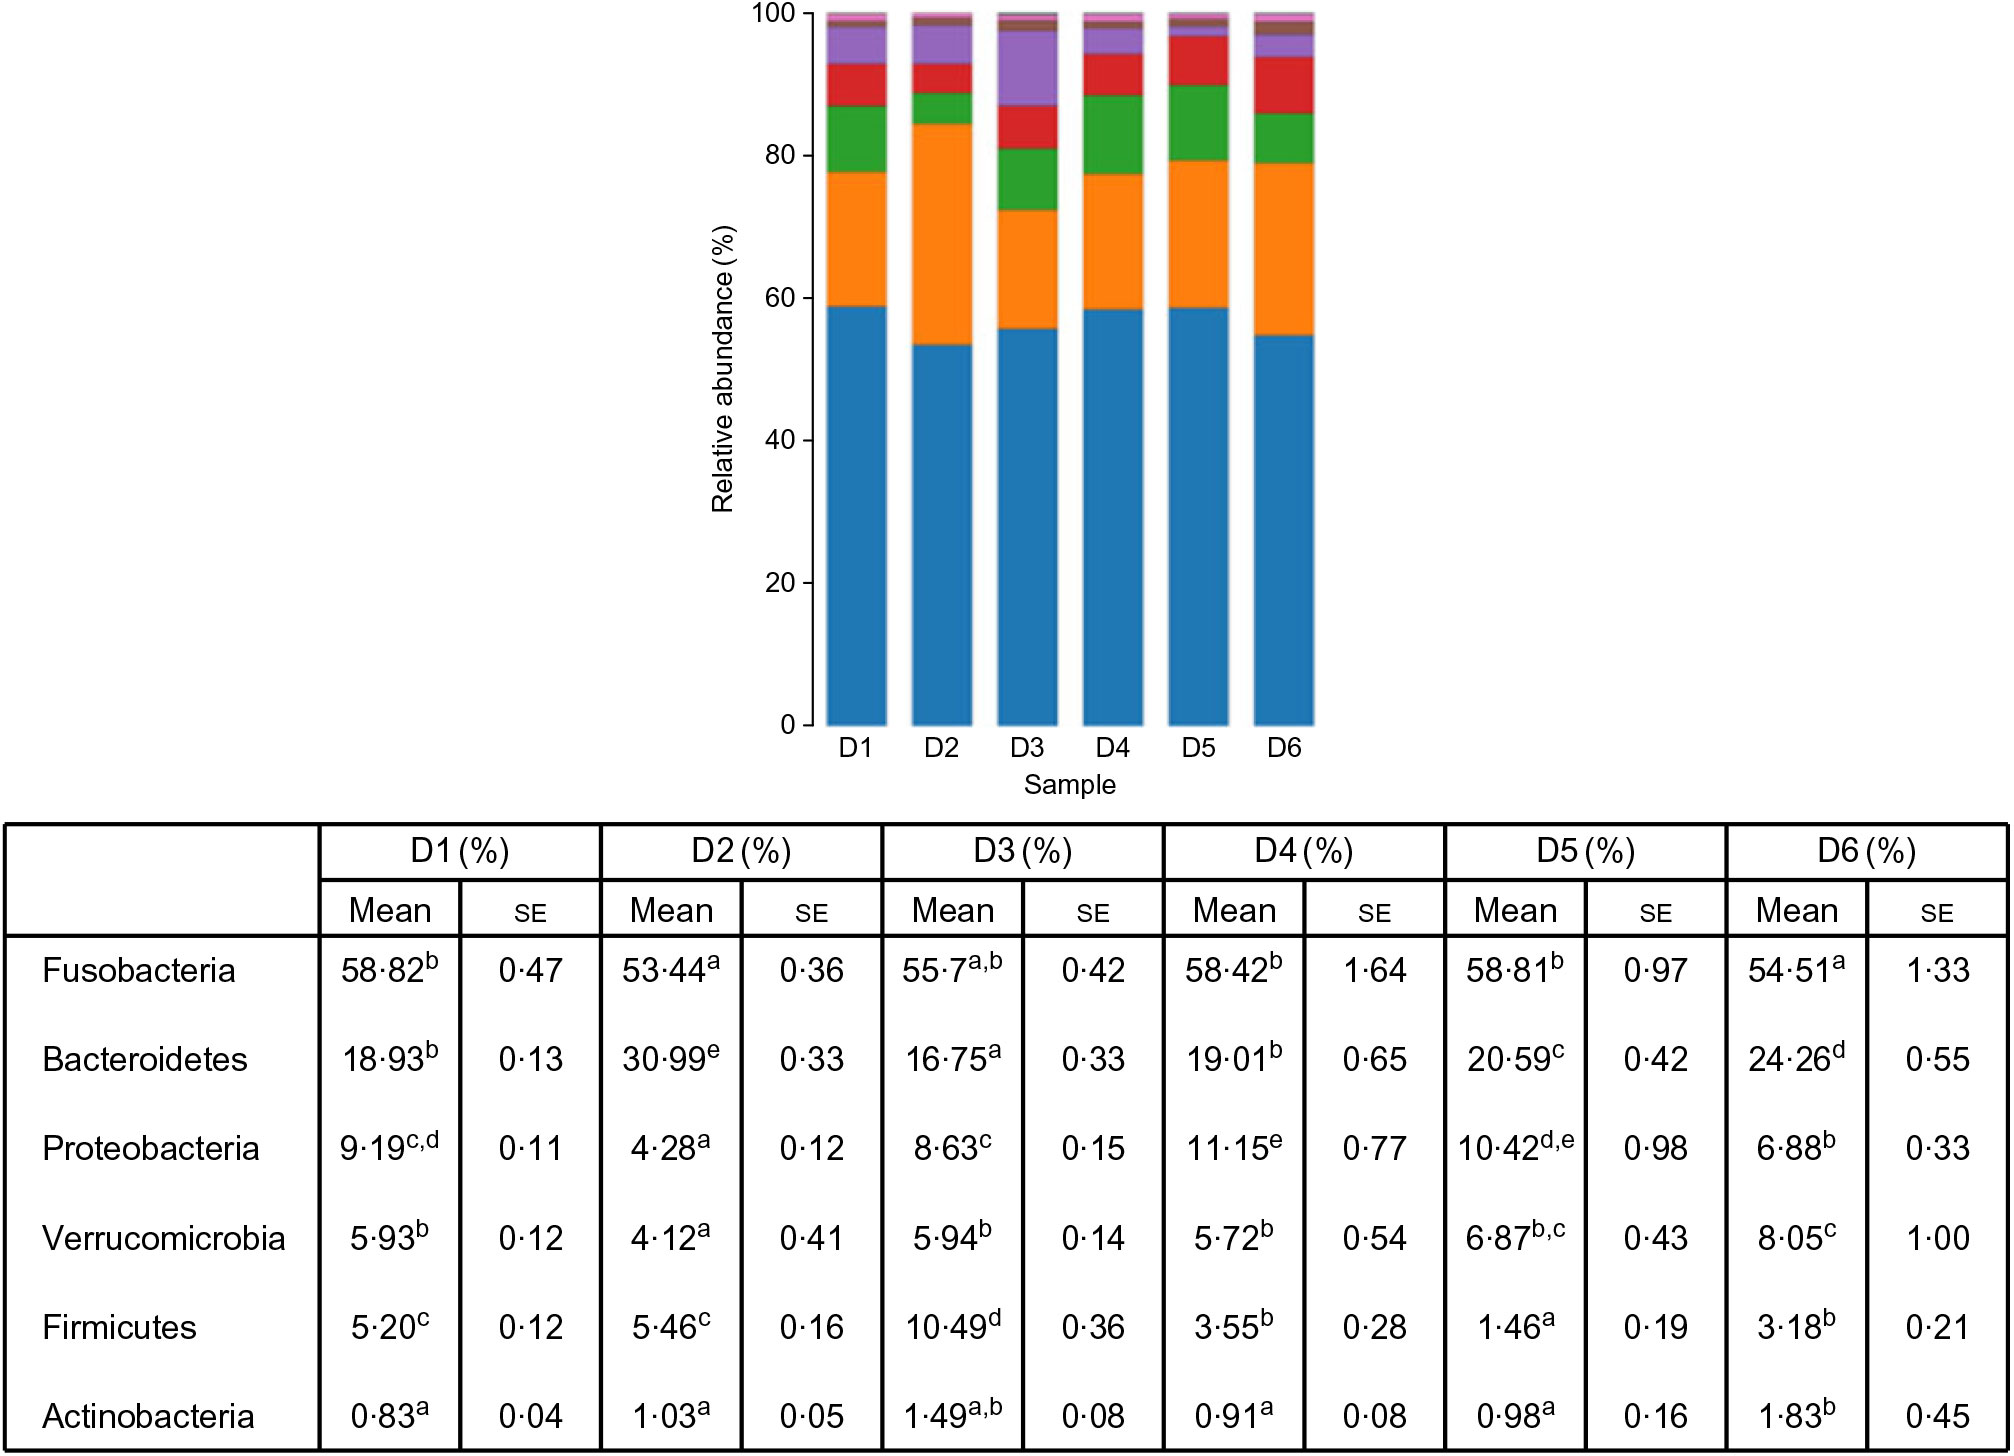
Fig. 1. Relative abundance of bacterial phyla in the six dietary groups. (![]() ), Others; (
), Others; (![]() ), unassigned; (
), unassigned; (![]() ), Chloroflexi; (
), Chloroflexi; (![]() ), Planctomycetes; (
), Planctomycetes; (![]() ), Cyanobacteria; (
), Cyanobacteria; (![]() ), Actinobacteria; (
), Actinobacteria; (![]() ), Firmicutes; (
), Firmicutes; (![]() ), Verrucomicrobia; (
), Verrucomicrobia; (![]() ), Proteobacteria; (
), Proteobacteria; (![]() ), Bacteroidetes; (
), Bacteroidetes; (![]() ), Fusobacteria. Values are means with their standard errors (n 4). a,b,c,d,e Mean values in a row with unlike superscript letters were significantly different (P < 0·05).
), Fusobacteria. Values are means with their standard errors (n 4). a,b,c,d,e Mean values in a row with unlike superscript letters were significantly different (P < 0·05).

Fig. 2. Relative abundance of bacterial families in the six dietary groups. (![]() ), Unclassified; (
), Unclassified; (![]() ), others; (
), others; (![]() ), MNG7; (
), MNG7; (![]() ), Enterobacteriaceae; (
), Enterobacteriaceae; (![]() ), Mycobacteriaceae; (
), Mycobacteriaceae; (![]() ), Neisseriaceae; (
), Neisseriaceae; (![]() ), Rhodobacteraceae; (
), Rhodobacteraceae; (![]() ), Peptostreptococcaceae; (
), Peptostreptococcaceae; (![]() ), Clostridiaceae_1; (
), Clostridiaceae_1; (![]() ), Verrucomicrobiaceae; (
), Verrucomicrobiaceae; (![]() ), Porphyromonadaceae; (
), Porphyromonadaceae; (![]() ), Fusobacteriaceae. Values are means with their standard errors (n 4). a,b,c,d,e Mean values in a row with unlike superscript letters were significantly different (P < 0·05).
), Fusobacteriaceae. Values are means with their standard errors (n 4). a,b,c,d,e Mean values in a row with unlike superscript letters were significantly different (P < 0·05).
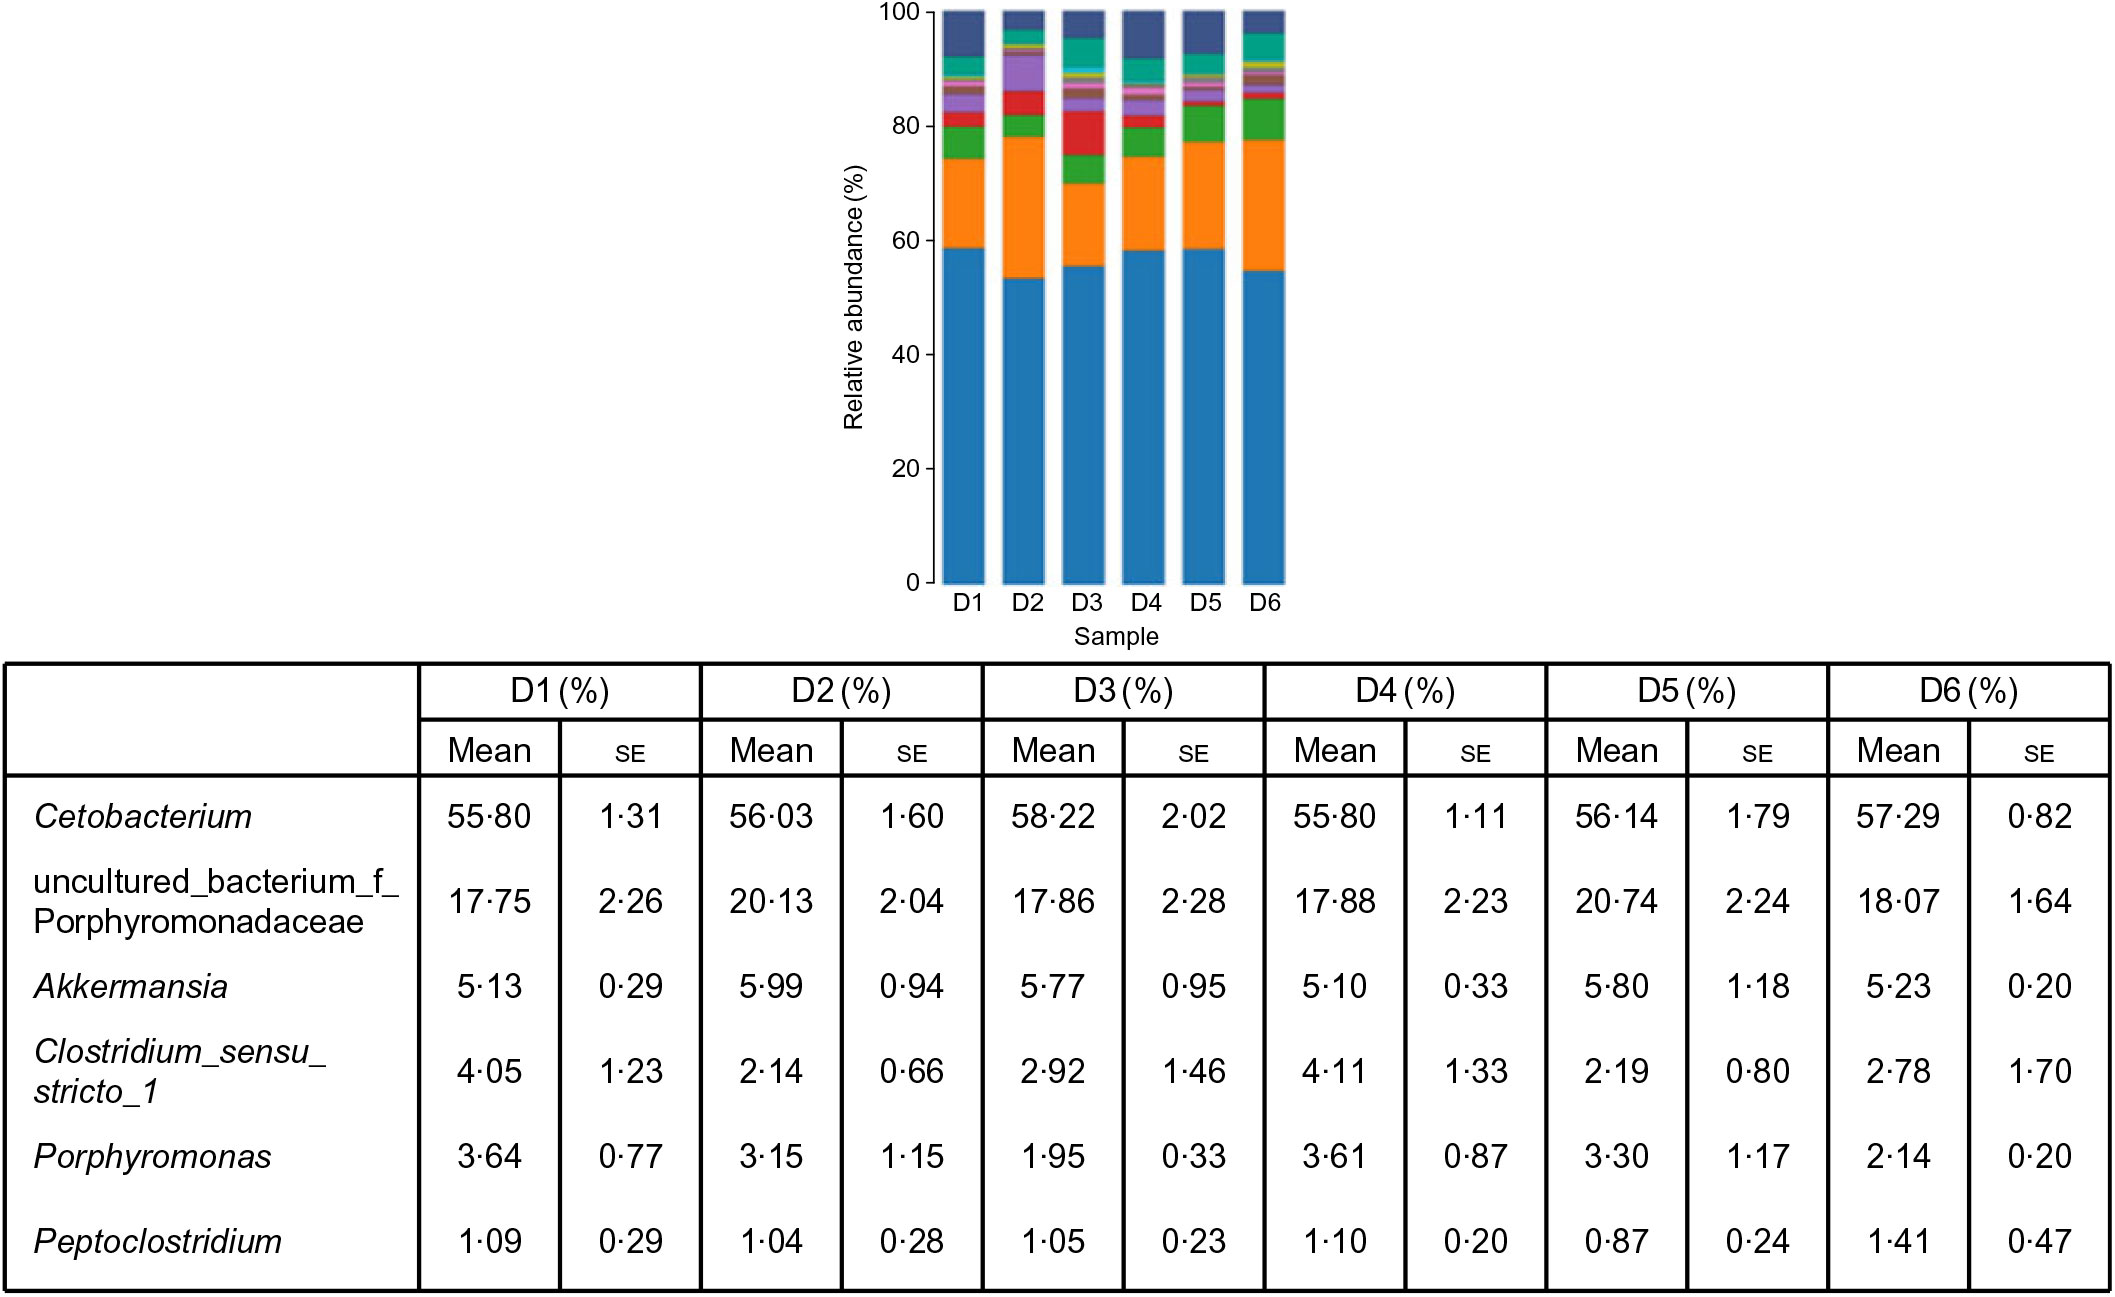
Fig. 3. Relative abundance of bacterial genera in the six dietary groups. (![]() ), Unclassified; (
), Unclassified; (![]() ), others; (
), others; (![]() ), Plesiomonas; (
), Plesiomonas; (![]() ), Mycobacterium; (
), Mycobacterium; (![]() ), Rhodobacter; (
), Rhodobacter; (![]() ), Vogesella; (
), Vogesella; (![]() ), Peptoclostridium; (
), Peptoclostridium; (![]() ), Porphyromonas; (
), Porphyromonas; (![]() ), Clostridium_sensu_stricto_1; (
), Clostridium_sensu_stricto_1; (![]() ), Akkermansia; (
), Akkermansia; (![]() ), uncultured_bacterium_f_Porphyromonadaceae; (
), uncultured_bacterium_f_Porphyromonadaceae; (![]() ), Cetobacterium. Values are means with their standard errors (n 4).
), Cetobacterium. Values are means with their standard errors (n 4).
Diversity analysis of intestinal microbiota
The alpha diversity metrics were calculated from the rarefaction curves at OTU level for each experimental feed. Chao1, Shannon index and relative abundance of microbial community are shown in Table 8 and Fig. 4. There were significant differences in Chao1 and Shannon index among the experimental groups (Table 8, P < 0·05). Chao1 in the D1 diet treatment was significantly higher than those from D2, D5 and D6 diets (P < 0·05) but without significant difference from D3 and D4 diets (P > 0·05). Shannon index in the D3 diet treatment was significantly higher than those from other diets treatments (P < 0·05). The results indicated that diversity of the microbial community in the D3 diet treatment was highest. Beta diversity was demonstrated by principal coordinate analysis. All samples showed in principal coordinate analysis using unweighted UniFrac distances were regularly distributed according to different treatment groups (Fig. 5). Principal coordinate analysis showed separated clustering of the control group and the Met-Met supplementation groups, indicating that supplementation of Met-Met in feed could significantly alter the structure of intestinal microbiota.
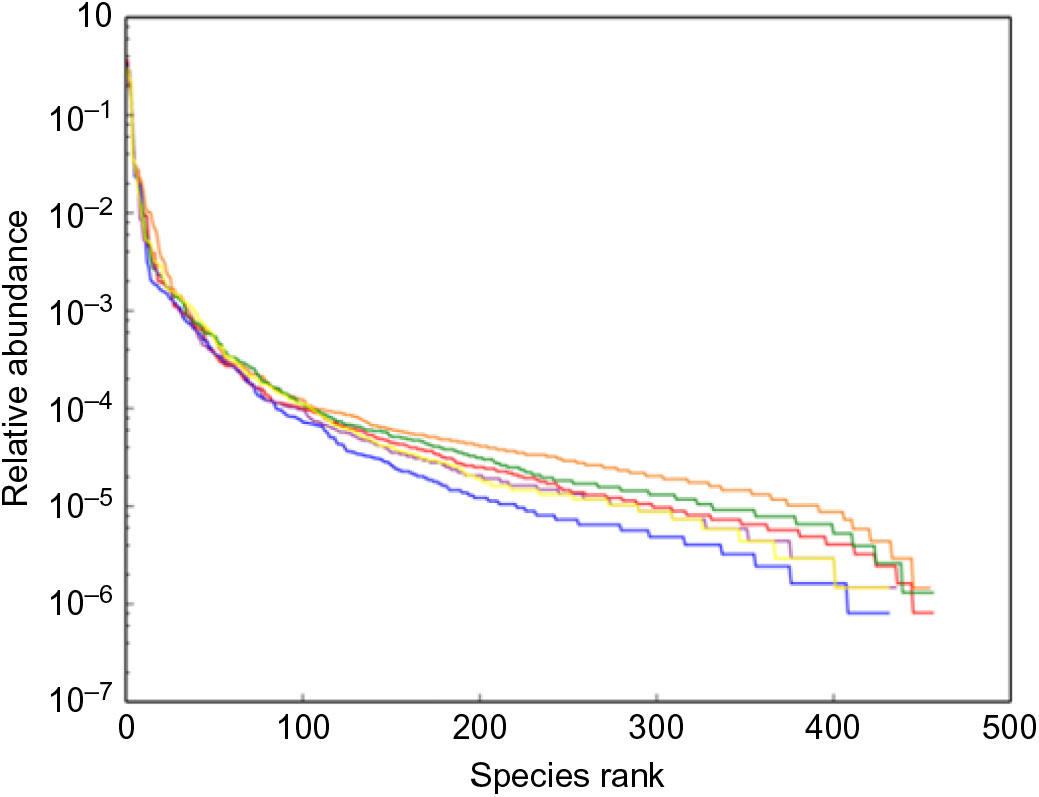
Fig. 4. Relative abundance of microbial community. (![]() ), D1; (
), D1; (![]() ), D3; (
), D3; (![]() ), D4; (
), D4; (![]() ), D5; (
), D5; (![]() ), D6; (
), D6; (![]() ), D2.
), D2.
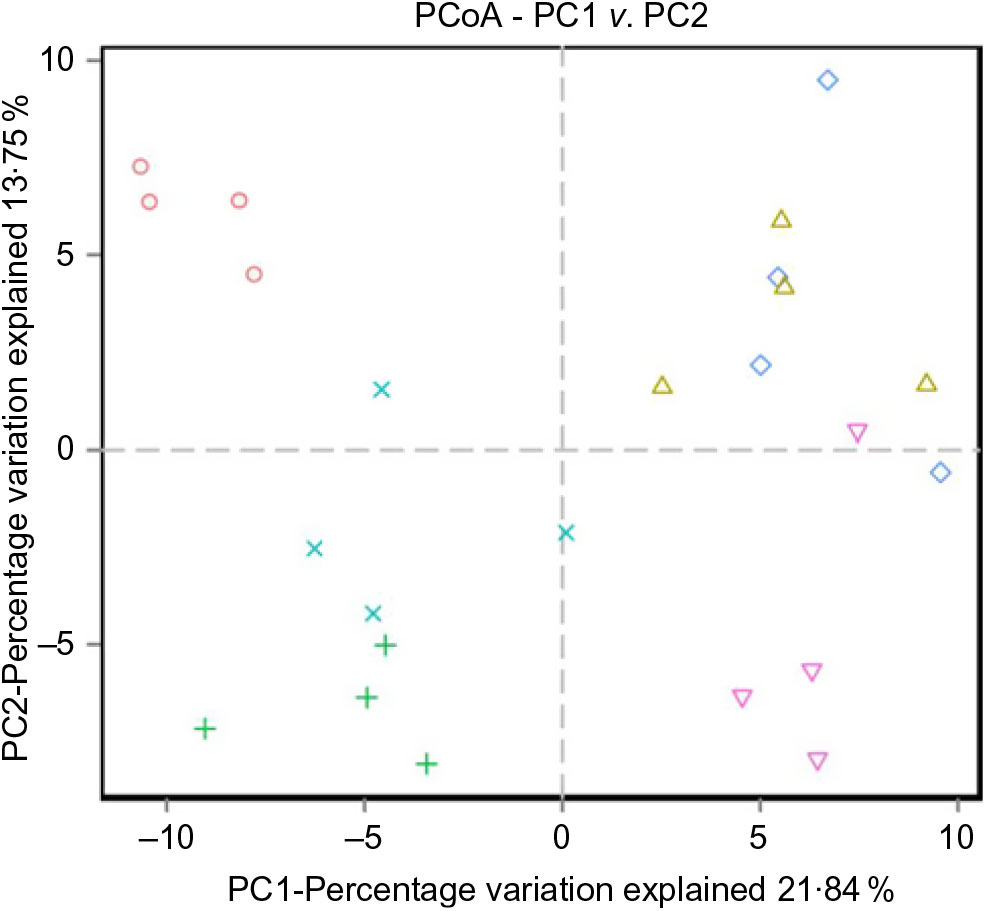
Fig. 5. Unweighted principal coordinate analysis (PCoA) of UniFrac distances. (![]() ), D1; (
), D1; (![]() ), D2; (
), D2; (![]() ), D3; (
), D3; (![]() ), D4; (
), D4; (![]() ), D5; (
), D5; (![]() ), D6.
), D6.
Discussion
To maintain the sustainable development of O. niloticus aquaculture, it is necessary to optimise the feed products used. A proper diet is essential to improve the growth performance and survival of the fish and to ensure that a high-quality and sustainable product is available to consumer. Met-Met, as novel nutritional supplements for aquatic and terrestrial animals, has attracted much attention in recent years. Reports concerning aquatic and terrestrial animals have indicated that the dietary supplementation with Met-Met can improve the growth performance of organisms(Reference Niu, Lemme and He5,Reference Xie, Lemme and He17,Reference Su, Wu and Feng18,Reference Santos, Htoo and Fracaroli36) . Su et al. indicated that dietary Met-Met supplementation increased PWG, SGR and feed efficiency in C. idella (Reference Su, Wu and Feng18). Dietary Met-Met supplementation increased PWG and SGR was also reported in Pagrus major by Mamauag et al. (Reference Mamauag, Gao and Thanh Nguyen37). Niu et al. demonstrated that supplementation of Met-Met in L. vannamei feed can improve growth performance (PWG and SGR) and efficiency of feed utilisation (protein efficiency ratio and feed efficiency)(Reference Niu, Lemme and He5). Similar results were also reported in L. vannamei by Xie et al. (Reference Xie, Lemme and He17). The results from the present study are similar to those described above. The present study indicated that the optimal Met-Met supplementation remarkably increased the PWG and SGR of O. niloticus. The results demonstrated that Met in dipeptide form can be efficiently absorbed and utilised by O. niloticus. Generally, the lower the dietary Met content, the worse the growth performance of fish. However, our results showed that the growth performance of O. niloticus was not only improved when the dietary Met level was higher than 0·61 % but no adverse effect could be detected in fish fed higher levels of Met. Espe et al. obtained different results in their research(Reference Espe, Andersen and Holen38). Their research indicated that dietary Met levels exceeding the requirements of Atlantic salmon have a negative impact on feed intake, growth performance and survival. Above results do not contradict the idea that supplementation of Met-Met in O. niloticus feed can improve growth performance. The difference in the effect of Met on the growth performance of aquatic animals may be related to the form and processing technology of Met and experimental conditions (supplementary level, species and experimental period). Since due to the growth results, the authors conclude the optimal proportion of Met was 0·61 % and the addition of Met-Met was 0·15 % in O. niloticus.
The EAA composition of whole body of O. niloticus was affected by the different dietary treatments. The present study indicated that dietary supplementation of Met-Met significantly increased the levels of Met, lysine, threonine, arginine, leucine, histidine, phenylalanine and total EAA in the whole body of O. niloticus. Similar results were also reported in L. vannamei by Niu et al. (Reference Niu, Lemme and He5) and Xie et al. (Reference Xie, Lemme and He17). Niu et al. indicated that the optimal Met-Met supplementation significantly increased the content of total EAA in L. vannamei (Reference Niu, Lemme and He5). Nevertheless, Boonyoung et al. indicated that there was no significant difference in the EAA composition of whole body of Oncorhynchus mykiss fed the diets with or without MHA supplementation(Reference Boonyoung, Haga and Satoh39). Supplementation of coated Met did not show remarkable difference in the amino acid composition of whole body of Marsupenaeus japonicus which was also reported by Alam et al. (Reference Alam, Teshima and Koshio40). The present studies have shown that the effects of Met on amino acid composition of aquatic animals are not entirely consistent. This difference may be related to the form and processing technology of Met, proportion of amino acid and experimental conditions (supplementary level, feeding regimen, species and experimental period). There is no doubt that Met-Met, a new Met product, can be well absorbed and utilised by O. niloticus. Dietary Met-Met supplementation can promote the absorption and utilisation of amino acids (Met, lysine, threonine, arginine, leucine, histidine and phenylalanine), which may contribute to faster growth in O. niloticus.
Fish is the main source of animal protein and micronutrients in developing countries(Reference Pauly and Zeller41). It is essential to provide adequate dietary amino acids for human health, growth, development and survival(Reference Wu, Wu and Dai42). Amino acids play an important role in maintaining normal physiological function and nutritional status of the body(Reference Rezaei, Wang and Wu43). For example, arginine plays a regulatory role in immune function, wound healing, hormone secretion, insulin sensitivity, protein synthesis and endothelial function(Reference Wu, Wu and Dai42,Reference Tong and Barbul44) ; Met can regulate the metabolic process, innate immune system and digestive function(Reference Martínez, Li and Liu45). Therefore, human consumption of O. niloticus rich in EAA is conducive to growth and health. Adding Met-Met to aquatic animal feed can improve the quality of aquatic products.
Oxidative burst is an important defence mechanism, but it can produce harmful substances, such as superoxide anion, hydrogen peroxide and hydroxyl radicals(Reference Zhao, Wang and Liu46). To reduce oxidative stress or damage caused by reactive oxygen species, cells have developed a set of antioxidant defence systems involving antioxidant enzymes. SOD and CAT are the main antioxidant enzymes, and T-AOC can evaluate the antioxidant ability of organisms by non-enzymatic or enzymatic components(Reference Chen, Guo and Espe47). MDA is a product of lipid peroxidation, which mainly evaluates the damage degree of cell structure and function by its content in serum or tissue(Reference Dawood, Koshio and El-Sabagh48). In the present study, the T-AOC was increased in fed the diet with Met-Met supplementation; however, the SOD and CAT activity and MDA content were no significant difference in fed the diet with or without Met-Met supplementation. The present results indicated that dietary Met-Met supplementation did not cause damage to hepatocytes and improved antioxidant capacity of O. niloticus. Feng et al. indicated that dietary MHA supplementation increased the SOD and CAT activity and reduced the MDA content in the liver of Cyprinus carpio (Reference Feng, Xiao and Liu49). Elmada et al. demonstrated that dietary supplementation of Met increased the SOD activity and the MDA content in serum of Pelteobagrus fulvidraco; however, the CAT activity was not significantly affected by the dietary Met levels(Reference Elmada, Huang and Jin50). The above results showed that the effects of different Met forms on antioxidant enzymes activities in different species and tissues were not entirely consistent. This may be due to the different tolerance of different species to Met. These results do not contradict the idea that dietary supplementation of Met-Met or Met can improve antioxidant ability. The results also indicated that Met plays an important role in regulating immune function in aquatic animals.
The effect of Met-Met supplementation on intestinal microbiota of O. niloticus was first reported in the present study. The present results indicated that Fusobacteria was the dominant phylum in O. niloticus, followed by Bacteroidetes, Proteobacteria, Verrucomicrobia, Firmicutes and Actinobacteria. However, Adeoye et al. showed that Fusobacteria was the dominant phylum in O. niloticus, followed by Proteobacteria and Firmicutes(Reference Adeoye, Yomla and Jaramillo-Torres51). In our study, the second dominant phylum was Bacteroidetes. Our results are different from those of Adeoye et al. (Reference Adeoye, Yomla and Jaramillo-Torres51). The main reason for the difference in results may be attributed to the difference in feed formula. It is well known that the most important contribution of Bacteroidetes is the degradation of dietary fibre in human(Reference Zhang, Chekan and Dodd52). In our feed formula, the feed protein was all derived from plant protein and no fishmeal was used as a feed protein source. Therefore, the dominance of Bacteroidetes may be related to the high fibre content in our feed.
The structure of intestinal microbiota is an extremely complex collective, which has proved to have a great positive impact on host immunity, such as improving innate immune response, preventing overgrowth of pathogenic micro-organisms and metabolising exogenous substances(Reference Belkaid and Hand53–Reference Snedeker and Hay55). In the present study, alpha diversity (Chao1 and Shannon index) which reflects the microbiota richness and diversity evidence was significantly affected in the six experimental diets. The results indicated that dietary supplementation of Met-Met leads to alterations in the gut microbiota in O. niloticus, especially in D3 diet treatment. O. niloticus fed with D3 diet showed the lowest abundance of Bacteroidetes and the highest abundance of Firmicutes. Bacteroidetes and Firmicutes occupy different functional niches in the intestinal ecosystem, and their differences in relative proportions can lead to huge functional differences(Reference Johnson, Heaver and Walters56). Mulder et al. indicated that there was a strong negative correlation between the abundance of Firmicutes and pathogenic bacterial populations in the intestine(Reference Mulder, Schmidt and Stokes57). Mariat et al. also demonstrated that lower Firmicutes:Bacteroidetes ratios in the intestine could increase the sensitivity of infants and the elderly to pathogens(Reference Mariat, Firmesse and Levenez58). In the present study, dietary supplementation of 0·15 % Met-Met could significantly increase Firmicutes:Bacteroidetes ratios, so we infer that Met-Met supplementation could contribute to improving the resistance of O. niloticus to pathogens. The predominance of Firmicutes in intestinal microflora was also considered a characteristic of obese people(Reference Manco, Putignani and Bottazzo59). Li et al. indicated that Firmicutes domination in high growth performance group was likely beneficial to the growth of tilapia(Reference Li, Liu and Li60). We also got similar results. High growth performance was obtained in O. niloticus fed D3 diet; meanwhile Firmicutes was dominant in intestinal microflora.
Conclusion
In the present study, we evaluated the effects of Met-Met, a new source of Met product, on growth performance, antioxidant capacity and intestinal microbiota of O. niloticus for the first time. Dietary Met-Met supplementation increased growth performance, antioxidant ability and the content of EAA in O. niloticus. Meanwhile, Met-Met supplementation alters intestinal microbiota composition in O. niloticus. Adding 0·15 % Met-Met to feed can improve the diversity of intestinal microbiota of O. niloticus. The optimal content of dietary Met was found to be 0·61 % with the supplementation of 0·15 % Met-Met based on the optimal growth performance and antioxidant ability of grower-phase O. niloticus.
Ethical Statement
All the experiments were conducted in accordance with the recommendations in the Guide for the Care and Use of Laboratory Animals of the National Institutes of Health. The study protocol and all experimental procedures were approved by Experimental Animal Ethics Committee of Sun Yat-sen University.
Acknowledgements
The authors thank for the funding of the Project from Evonik Degussa (China) Co., Ltd (03 87 16004_1), Project of National Natural Science Foundation of China (31872580), Project of Marine Fishery Science and Technology of Guangdong Province (A201601C11, GDME-2018C012), Natural Science Foundation of Guangdong Province (2017A030313195), Project of Science and Technology of Guangzhou City (201803020006) and Modern Agriculture and Marine Biological Industry of ShenZhen (20170428140437749).
The authors thank the participants who gave their time to the trial.
J. N., Y.-J. L., L.-X. T., J.-Y. H. and K. M. designed the study. T.-Y. G., W.-Z., J.-J. X. and S.-Y. L. carried out the rearing work. T.-Y. G. and W.-Z. analysed the results and wrote the paper with contributions from the other authors.
J.-Y. H. was employed by company Evonik Degussa (China) Co., Ltd. Guangzhou Branch. K. M. was employed by company Evonik Nutrition and Care GmbH. The authors declare that the present study received funding from Evonik Nutrition and Care GmbH. The sponsor partcipated in the design of the experiment and editing the manuscript. All other authors declare no conflicts of interests.