


Coeliac disease (CD) is an immune-mediated enteropathy that becomes apparent in genetically predisposed patients. It is characterised by a permanent sensitivity to gluten, an amino acid sequence contained in foods derived from wheat, barley, rye and kamut(Reference Alaedini and Green1). Ingestion of gluten causes inflammation, villous atrophy and crypt hyperplasia in the intestine leading to malabsorption of nutrients(Reference Alaedini and Green1). Several extra-intestinal complications including anaemia, osteoporosis, neurological symptoms, infertility and fatigue have also been associated with CD(Reference Pantaleoni, Luchino and Adriani2). To date, the only treatment of CD is a diet therapy, involving a life-long adherence to a gluten-free diet (GFD). The elimination of gluten from the diet usually leads to fast alleviation of clinical symptoms, although recovery of the intestinal mucosa may take months or even years(Reference Green and Cellier3). However, a GFD fails to alleviate symptoms in 7–30 % of CD patients(Reference Pantaleoni, Luchino and Adriani2,Reference Green and Cellier3) . Previous research has identified many possible causes of persistent symptoms in patients with CD despite dietary intervention. These may be non-food-related such as small intestinal bacterial overgrowth(Reference Tursi, Brandimarte and Giorgetti4), co-morbidities such as neurological, psychiatric or thyroid diseases or another gastrointestinal disorder such as irritable bowel syndrome(Reference Paarlahti, Kurppa and Ukkola5). Food-related causes of persistent symptoms are dietary non-adherence. The percentage of partially non-adherent patients varies greatly and can go up to 60 % of CD patients(Reference Hall, Rubin and Charnock6). Unintended gluten consumption by CD patients who (intend to) strictly adhere to GFD is due to ‘hidden gluten’ in processed foods(Reference Hollon, Cureton and Martin7), consumption of foods contaminated with gluten during growing, packaging and transportation processes(Reference Culliford and Green8), and presence of lactose intolerance(Reference Murray, Watson and Clearman9). Considering that ingestion of gluten may have severe consequences for a CD patient’s long-term health and well-being, it is relevant to thoroughly examine the daily diet that is supposed to be gluten-free (GF) by identifying daily foods and meals consumed by the CD patient and determining the gluten content in duplicate portions (DP) of the foods.
This study aimed to determine the gluten content of foods consumed by CD patients on a GFD and to estimate the total daily intake of gluten of these patients. It was hypothesised that gluten intake by CD patients who do adhere to a GFD still could exceed the patients’ daily gluten tolerance level, especially for sensitive CD patients. To this end, we performed an explorative study in which both food records and DP of single foods and mixed dishes were collected and analysed for their gluten contents so as to calculate the daily gluten intake of CD patients.
Materials and methods
Study population
The study aimed to include CD patients (females and males) from three different hospitals, hospital Gelderse Vallei (Ede), Rijnstate hospital (Arnhem) and Canisius Wilhelmina hospital (Nijmegen). CD patients were pre-selected by the principal gastroenterologist from the three participating hospitals before approaching them to participate in the study. The pre-selection was based on inclusion and exclusion criteria, which were defined by the researchers and the principal gastroenterologist from one of the hospitals involved.
The primary aim of the study was to explore possible exceedance of the gluten tolerance level for sensitive patients of 0·75 mg/d(Reference Bruins Slot, Bremer and Hamer10), and we wanted to be able to detect low proportions (P) of days that this level was exceeded. A feasible number of patients in this exploratory study was thirty who were studied for two individual days, resulting in DP data of sixty study days. Based on an one-sample binomial test using the program G*Power(Reference Faul, Erdfelder and Lang11), and using a 5 % significance level for the test and asking for 95 % power, the minimally detectable effect size for the proportion (P) with sixty study days was found to be 0·049, which means that higher proportions can be expected to be found with 95 % power. Therefore, a study with thirty CD patients was considered reasonable.
CD patients who met the following inclusion criteria were selected by the principal gastroenterologist of each of the three hospitals: age between 20 and 65 years; confirmed diagnosis of CD through an intestinal biopsy; adherence to a GFD for at least 1 year at the start of the study and high specific anti-tissue transglutaminase antibody level at first entry at the hospital. Patients who met one of the following exclusion criteria were not included in the study: having one or more of the co-morbidities, that is, diabetes mellitus type 1, microscopic colitis and/or thyroid disease; unable or unwilling to comply with the study procedures; wittingly consuming foods with gluten, and/or having exacerbation of gastrointestinal complaints.
The involved gastroenterologist from each of the three involved hospitals selected CD patients who complied with the inclusion and exclusion criteria. The selected CD patients were approached by the gastroenterologist via postal mail to participate in our study. If interested, the CD patients were asked to contact the researchers for participation via email. Subsequently, these CD patients were phoned by the researchers to provide them additional information and to invite them for the study intake. During this intake, the CD patients filled out an informed consent and a baseline questionnaire. The baseline questionnaire included four questions about their age, height, body weight and years on a GFD, eighteen questions related to their general health and gastrointestinal complaints, and three questions about their adherence to a GFD, self-perceived degree of gluten sensitivity and self-efficacy towards following a GFD.
The study was approved by the Medical Ethical Research Committee of Wageningen University, the Netherlands.
Study procedure
Participants collected DP for two individual days, covering one weekday and one weekend day, for all relevant foods (all foods excluding coffee, tea and unprocessed vegetables and fruits) that were consumed during that day. The week and weekend days were randomly chosen by the researchers. Participants were given oral and written instructions about the collection of the duplicate foods and mixed dishes. For each food or mixed dish consumed, the participants were instructed to collect the same amount of the food or mixed dish as a DP. Patients cooled down there duplicate food portions to 4°C and subsequently stored all DP in separate containers with appropriate labels (name, date and name of food/mixed dish). To this end, containers and bags were supplied to the participants for collection of single food items and mixed dishes throughout the day. Pre-structured diaries for recording food intake were devised by a research dietitian and provided to the participants. In the food diary, participants noted each individual food item and meal consumed during each of the 2 d, with the time of consumption, type of food including brand name and the estimated quantity in ml, grams or in household measures(Reference De Vries, Zock and Mensink12,Reference Yang, Kim and Hwang13) .
The duplicate food items were collected from the participant by one of the researchers, the day after the study day, and the food records were directly checked for clarity and completeness by trained dietitians. Additional information was obtained from the participant about the type of food consumed, preparation of dishes, portion sizes, recipes etc., if needed. All duplicate food items and meals collected on one day by the participant were stored at 4°C and transported to Wageningen Food Safety Research (WFSR) in a coolbox with frozen elements to maintain the storage temperature of 4°C of the samples(Reference Lelieveld, Holah and Napper14).
Gluten chemical analyses
Upon arrival at WFSR, the DP were stored at 4°C. Each DP was weighted and then homogenised by grinding or pureeing five times 10 s (Moulinex DP700) or shaking (depending on the type of food) before gluten analysis. The gluten analysis was performed by using the RidaScreen gliadin (R-Biopharm, Art no. R7001) method which is an ELISA sandwich method, based on the R5 antibody, currently recommended by Codex Alimentarius(15). The test was performed following the instructions in the user manual, except for the sample volume that was increased to 1 g, keeping the sample:extraction buffer ratio constant, and applying UPEX extraction buffer as described by Mena et al. (Reference Mena, Lombardía and Hernando16) to increase the accuracy of the method, with similar detected gluten levels (in house comparison, data not shown). Per DP, one sample was extracted and divided over two wells to be tested. During the test, a colour signal was produced which was measured at the absorbance wavelength of 450 nm in a spectrophotometer (Biotek ELx808). The signals of the two wells were averaged and compared with a standard curve of known gluten concentrations (standard curve is shown in online Supplementary Fig. S1). In this way, the gluten concentration was determined in each sample.
Calculation of dietary intake
Dietary intake data from the food records were coded (time of intake, type of food and total weight). Energy and macronutrient intakes per person per d were calculated using Compl-eat (version 1.0, Wageningen University)(Reference Meijboom, van Houts-Streppel and Perenboom17) and the Dutch food composition database of 2011(18). The contribution of food groups was assessed as a percentage of the total energy intake.
Based on the analysed gluten concentrations and the consumed amounts of the food items and meals, the average daily gluten intake was calculated per patient. Intake was calculated considering samples with gluten levels below the limit of detection (LOD) of 3 parts per million (ppm), to contain either zero gluten, a gluten concentration of one-third of the LOD (1 ppm) and a gluten concentration of two-thirds of the LOD (2 ppm).
Statistical analyses
To evaluate possible underreporting of food intake based on the food records, we divided the estimated energy intake per d by the estimated BMR calculated with formulas reported by Schofield(Reference Schofield19). If for a participant, the energy intake/BMR <0·87 or >2·87 per d for both study days(Reference Black20), food intake data of the participant were removed from the statistical analyses.
The proportion of days (P) on which the gluten tolerance level of 0·75 mg/d was exceeded was directly calculated, and an one-sided upper confidence limit on this proportion was calculated by normal approximation as P + 1·645 × sqrt (P(1 – P)/n), where n is the number of study days.
Results
Study population
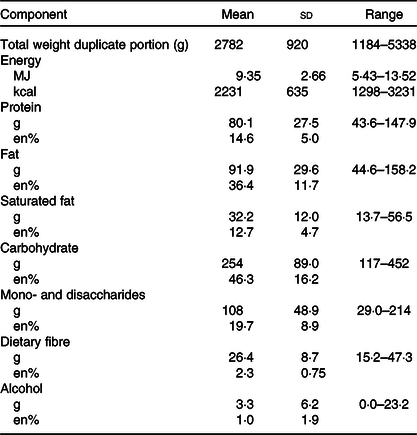
Characteristics of the study population, that is, CD patients who participated in this study, are presented in Table 1. Full record was obtained for twenty-seven CD patients, of whom seven males and twenty females. Participation of more females than males in this study is in correspondence with the higher CD prevalence amongst females(Reference Choung, Khaleghi and Cartee21). The remaining three patients did not collect full duplicate diet portions in one or the two study days. BMI was below 20 kg/m2 for two persons, in the range of 20–25 kg/m2 for eighteen participants, between 25 and 30 kg/m2 for two persons and over 30 kg/m2 for four persons. The number of years that participants were on a GFD varied, with thirteen persons being on a GFD for <5 years (but more than 1 year), six persons being on a GFD between 5 and 10 years and eight persons being on a GFD for 10 years or more.
Table 1. Characteristics of the twenty-seven study participants
(Mean values, medians and minimum and maximum values)

* Based on twenty-six participants; for one person, the weight was missing.
† Score 1–5, with 1 very low and 5 very high.
‡ Score 1–10, with 1 very low and 10 very high.
Twelve of the twenty-seven participants indicated to have no or little complaints/pain related to CD (score 1 or 2, scale 1–5) in the last month before the study days. Five participants indicated to have quite some complaints/pain (score 4). The severity of gastrointestinal symptoms after (incidental) gluten intake was indicated to be in general quite high. On scale 1–10, seven participants gave a score of 8 or higher and another five gave a score of 7.
Table 2 presents the mean amount of energy and macronutrient intake of the study participants. The weights of the total food intake per d varied widely over the twenty-five participants, from 1184 to 4083 g for females (n 18), and from 2396 to 5338 g for male participants (n 7). In comparison with the mean intakes of the adult Dutch population (aged between 19 and 79 years)(Reference van Rossum, Buurma-Rethans and Bennenmann22), the participants consumed more potatoes (183 v. 76 g), fruit and nuts (247 v. 132 g), vegetables (220 v. 144 g), and meat and meat products (105 v. 66 g). The mean intake of bread and cereals (217 v. 200 g), cake and pastry (45 v. 42 g), and dairy (359 v. 347 g) was comparable. The participants consumed less alcoholic and non-alcoholic beverages (1408 v. 2035 g) compared with the adult Dutch population.
Table 2. Intake of energy and macronutrients of coeliac disease (CD) patients (seven males and twenty females) per d according to their 2-d food records*
(Mean values and standard deviations)
* Contribution of macronutrients are expressed in mass (g) and contribution to total energy intake (%en) (n 25). Data of two participants were excluded because of unreliable data as both reported days showed an energy intake/BMI of <0·87.
Gluten contents
From the twenty-seven CD patients, in total 499 DP were analysed. Gluten was detected in thirty-two (6 %) of the analysed DP, but the concentrations generally were low (<10 mg/kg). In four food samples, that is, minced meat spices, pancake, vanilla meringuette and a dark brown pistolet, 20 mg/kg or more gluten was found, with the highest concentration (108 mg/kg) observed in the vanilla meringuette. From these four food samples, three samples were from foods with a GF label and thus did not comply with the European legislation (EC/828/2014)(23). In the other twenty-eight samples, the gluten concentration was between 3 and 20 mg/kg gluten. Most of these twenty-eight gluten-containing foods were bakery products (bread, biscuits, breakfast cereals, etc.).
Gluten intake of coeliac disease patients
The total daily gluten intake of the study participants varied between ‘zero’ (all foods below the LOD of 3 mg/kg) and 3·3 mg/d (Fig. 1). If the samples with a negative test result, that is, gluten content below 3 mg/kg, were assumed to contain zero gluten, six out of fifty-four study days, the daily gluten intake of a patient exceeded 0·75 mg of gluten per d, the limit set for very sensitive patients(Reference Chartrand, Russo and Duhaime24). Given the number of exceedances (of 0·75 mg/d) of six out of the fifty-four study days, the point estimate is 0·11. This results in a true proportion of exceedances of maximal 0·18 (the one-sided upper confidence limit).
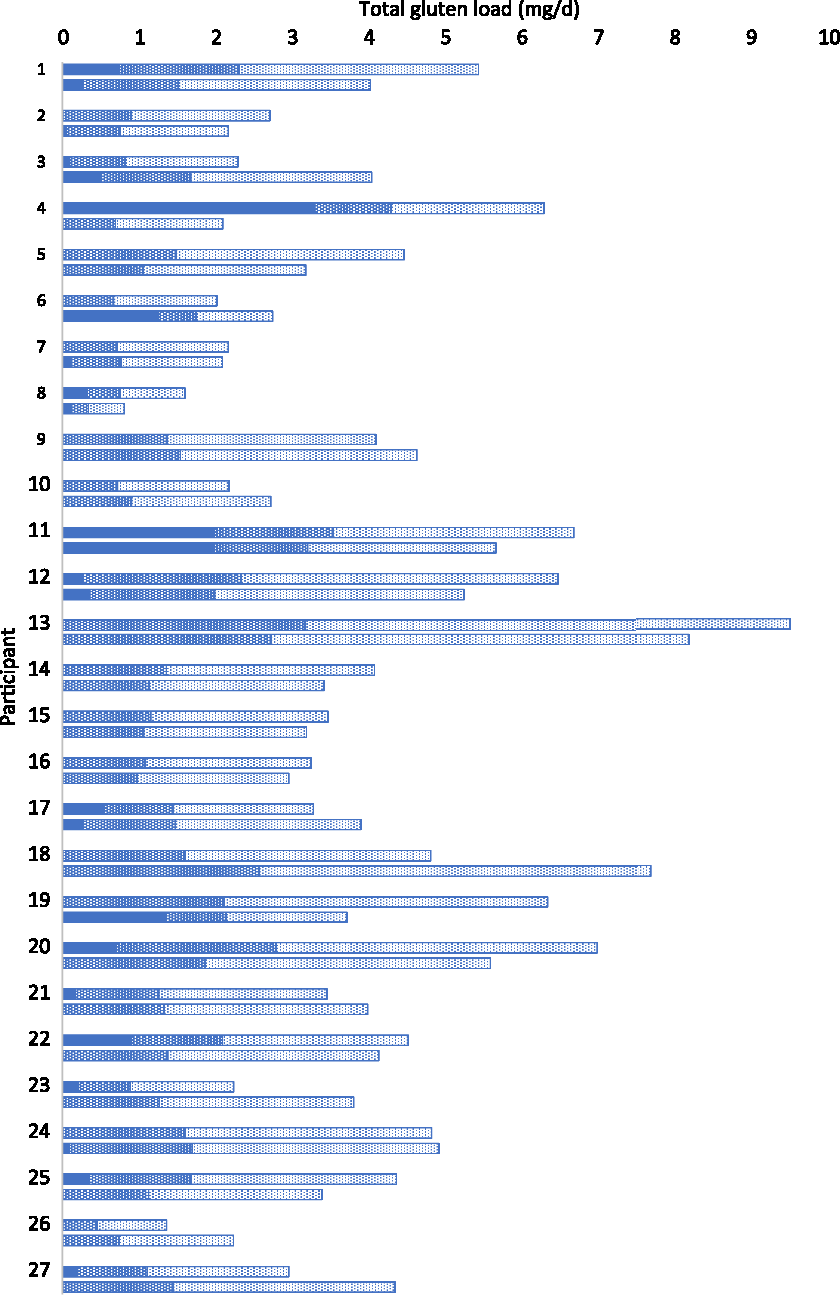
Fig. 1. Total gluten load (mg/d) of 2 d for twenty-seven participants; measured gluten load (![]() ), scenario of 1 mg/kg gluten for food below limit of detection (
), scenario of 1 mg/kg gluten for food below limit of detection (![]() ), scenario of 2 mg/kg gluten for food below limit of detection (
), scenario of 2 mg/kg gluten for food below limit of detection (![]() ).
).
A daily intake over 10 mg gluten per d, which is unsafe for recovering and average CD patients(Reference Bruins Slot, Bremer and Hamer10), was not observed. If the gluten concentrations in all samples with a test result below LOD were assumed to contain 1 mg/kg gluten, the total undetected ‘hidden’ gluten load was estimated to be between 0·2 and 3·2 mg gluten per d (Fig. 1). The total gluten intake, that is, the patient’s gluten load from the analysed positive products plus the undetected ‘hidden’ gluten load, varied between 0·3 and 4·3 mg gluten per d. In a worst-case scenario, when gluten concentrations in all samples with a test result below LOD were set at 2 mg/kg (2/3 of the LOD), the total undetected ‘hidden’ gluten intake ranged between 0·5 and 6·3 mg gluten per d (Fig. 1). In this case, the total gluten intake of a person varied between 0·6 and 6·3 mg gluten per d when the gluten intake of 6·3 mg only existed of ‘hidden’ gluten and was not accompanied by measured gluten. This implies that the gluten tolerance levels of recovering CD patients and average CD patients, estimated at 10 and 10–50 mg gluten per d, respectively(Reference Bruins Slot, Bremer and Hamer10), are not exceeded. However, the gluten tolerance of sensitive CD patients, estimated at 0·75 mg/d(Reference Bruins Slot, Bremer and Hamer10), would in most of the cases be exceeded. For total loads based on 1 mg/kg undetected gluten levels, only for seven out of fifty-four study days, the total intake was below 0·75 mg/d. For total intakes based on 2 mg/kg undetected gluten levels only on one study day, the tolerance level for sensitive patients (0·75 mg/d) was not exceeded.
Discussion
In Europe, foods can be labelled GF if the gluten content does not exceed 20 mg/kg(23). In total, 499 DP of foods and mixed dishes were analysed for gluten. In three GF-labelled foods, >20 mg/kg gluten were detected and thirty samples had gluten concentrations between 3 and 20 mg/kg. This figure is in accordance with Gibert et al.(Reference Gibert, Kruizinga and Neuhold25) who detected >20 mg/kg gluten in 0·5 % of commercially available GF products in Italy, Spain, Norway and Germany. However, the study of Gibert et al. only included GF products, whereas our study also included non-labelled food items normally consumed by CD patients. Gluten content in these products ranged between <5 and 27·8 mg/kg(Reference Gibert, Kruizinga and Neuhold25), while in our study the highest gluten content in an individual product was 108 mg/kg. Although the majority of analysed foods in the present study were compliant with legislation, sensitive CD patients are not protected by the gluten threshold of 20 mg/kg because they may develop signs of inflammation after consuming only a total of 0·75 mg gluten per d(Reference Bruins Slot, Bremer and Hamer10). This threshold is easily exceeded even with a strict adherence to a GFD, as was shown in the current study. Our study was aimed to determine the gluten content of all foods and mixed dishes consumed by CD patients who adhere to a GFD to assess the contribution of the ‘hidden’ gluten load to the total daily intake of CD patients.
The procedure followed in the current study to approach CD patients for participation, via their medical specialist, may have resulted in a slight selection bias. Since this study required commitment and time investment from the patients, the most concerned CD patients may have agreed to participate. On the other hand, this was needed for completion of the request task from the participants. It is estimated that at least 2·3 % of the CD patients is highly sensitive(Reference Hollon, Cureton and Martin7), and in our study group, two patients (7·4 %) were identified to be highly sensitive CD patients. Although based on subjective judgements (scoring) provided by the CD patients themselves, the somewhat higher sensitive rate of CD patients may reflect the more concerned CD patients participating to the study. The gender balance, with more females participating than males, reflects the general observation that CD is diagnosed more often in female than male(Reference Choung, Khaleghi and Cartee21).
Study results showed that the daily gluten intake of the participants varied between 0 and 3·3 mg gluten per person per d, thereby possibly exceeding the tolerance level of sensitive CD patients of 0·75 mg/d. The contribution of the amount of ‘hidden’ gluten to the total gluten intake per d ranged from ‘0’ to 6·3 mg gluten per person per d, depending on the scenario chosen for the products with gluten concentrations below the LOD of the test. Gluten was detected in foods consumed by CD patients on 24 out of 54 d (44 %). This is comparable with previous studies in which gluten peptides were detected in faecal and urine samples of CD patients on a GFD and which showed gluten intake in 39–50 % of adult patients (≥13 years)(Reference Comino, Fernández-Bañares and Esteve26,Reference Moreno, Cebolla and Muñoz-Suano27) . To protect highly sensitive CD patients against a too high gluten intake, legislation for gluten-free product labelling needs to be adapted; in particular, thresholds for GF product labelling should be lowered. This should be possible without reducing the number and variety of GF products on the market a lot, as most GF products tested contained gluten levels below 3 ppm. Consequently, this also requires the LOD for gluten to be reduced with ideally a factor of 10 to about 0·3 mg/kg. Increasing the sensitivity is feasible and is a key issue of the kit manufacturers as they are constantly improving their products.
The total weight of analysed foods depended on the participant and varied from 250 to 1800 g/d. When a relatively high component of the diet consists of the by nature GF vegetables, fruits and unprocessed foods, less foods needed to be analysed and the total weight was relatively low. The food choice of the twenty-seven CD patients in the present study thus varied, with some patients consuming a relatively high amount of naturally GF foods, such as milk, fruit and vegetables, whereas others choose for the GF variants of the foods that normally contain gluten, such as GF bakery products.
The calculated mean energy intake in the CD population of our study was somewhat higher (5 %) than that in the adult Dutch population (9·35 v. 8·90 MJ), while relatively more females were included. The latter is in consensus with a higher prevalence of females with CD(Reference van Gils, Rootsaert and Bouma28). Also, our CD population had a higher contribution of total energy intake (%en) of total fat (36·4 v. 35 en%) but the intake of saturated fat was similar (12·7 v. 12·6 en%). Finally, dietary fibre intake was higher than that of the general adult Dutch population (26·4 v. 20·0 g/d), which can be explained by a higher fruit and vegetables intake. A higher energy and total fat intakes, as well as a higher average BMI, are known to be related to the consumption of a GFD(Reference Theethira and Dennis29). However, as the dietary assessment methods used differed between the present study and the Dutch National Food Consumption Survey, comparisons must be interpreted with caution.
Conclusion
This study investigated the unintentional intake of CD patients who strictly adhered to a GFD. From the 499 food items, gluten was detected in thirty-two samples. In four of the thirty-two foods, the gluten concentration exceeded the European legal limit of 20 mg/kg and three of these four foods had a GF label. CD patients were exposed to gluten on 24 out of 54 d (44 %). In six out of fifty-four study days, the daily gluten intake of a patient exceeded 0·75 mg gluten per d, the gluten tolerance limit for sensitive patients. Furthermore, the gluten intake was up to 6·3 mg/d in this study when including gluten concentrations below the LOD at a concentration of 2/3 LOD. In conclusion, although CD patients carefully adhere to GFD, they are unintentionally exposed to gluten. To also protect the sensitive CD patients, both legal thresholds and the LOD of the analytical methods should be lowered.
Acknowledgements
The authors greatly thank all CD patients for their contribution to this study. The input and cooperation with the medical specialists J. Uil, A. Tan and P. Wahab are highly acknowledged.
This study was financed by the Ministry of LNV, as part of the project (WOT-02-002) on Food Safety Issues. The authors thank Dick Hooijerink for his contribution in the lab executing the measurements as well as Hilko van der Voet for performing the sample size calculation.
The authors declare that there are no conflicts of interest.
Supplementary material
For supplementary material referred to in this article, please visit https://doi.org/10.1017/S0007114520002974


