It is well known that weight loss (WL) requires an energy deficit through a negative energy balance regardless of the diet type(Reference Jensen, Ryan and Apovian1,2) . However, this concept is often overshadowed with the ever-expanding resources and avenues that provide nutrition information on the internet(Reference Goldberg and Sliwa3,Reference Ramachandran, Kite and Vassallo4) . Australian researchers indicated a significant increase in the use of the internet for nutrition-related information from < 1 % (1995–2001) to 38 % in 2012(Reference Pollard, Pulker and Meng5), and up to 78 % of Australian’s reported using the internet for health information in 2015(6). Similarly, international data indicated that up to 85 % of French adults used the internet for nutrition and health-related information in 2013(Reference Fassier, Chhim and Andreeva7). Popular nutrition resources and information from social media, celebrity chefs and influencers often do not promote a sustainable long-term approach, promise quick and large amounts of WL, may not be nutritionally sound and may promote bad habits and relationships with food(Reference Goldberg and Sliwa3,Reference Ramachandran, Kite and Vassallo4) .
In 2017–2018, two-thirds of the Australian population was overweight or obese(8,9) . In addition, almost half of Australians aged 15 years and over reported trying a WL diet or low-energy diet in 2011(9), demonstrating the demand within the population for various WL strategies, diets and programmes. The excessive amount of contradictory and inconsistent information from non-qualified individuals can be confusing for the public and may result in members of the public trying various fad diets, yoyo dieting and result in negative health consequences(Reference Goldberg and Sliwa3,Reference Ramachandran, Kite and Vassallo4) .
Yoyo dieting, or weight cycling which refers to the cycle of WL and weight gain, may be associated with new and emerging fad diet trends(10,Reference Ignacio11) . Fad diets are diets that often peak in popularity, for example, the Dukan Diet, Atkins Diet, Zone Diet and Skinny Teas and are then replaced by the newer trends such as Keto, Paleo and Intermittent Fasting(10,12) . Though diet names change, the general nutrition messages appear similar, recommending the restriction of a particular food group or macronutrient and unrealistic WL expectations(10,12,Reference Sarfan, Clerkin and Teachman13) . The nutrition messages promote an eating pattern that is inconsistent with the Australian Government guidelines, the Australian Guide to Healthy Eating (AGHE) and Australian Dietary Guidelines(2). Together the AGHE and Australian Dietary Guidelines demonstrate the proportion and serving sizes of each of the five food groups Australians should consume daily for good health depending on age, sex and life stage(2).
Considering only 51 % and 7·5 % of Australians consume the recommendations for fruit and vegetables, respectively, in 2018, it is problematic that WL diets encourage their elimination(14–Reference Ting, Dugré and Allan17). American’s similarly have low intakes of fruit, vegetables, whole grains and milk and have increased intake of nutrient poor foods such as those high in solid fat, added sugars and alcoholic beverages(Reference Krebs-Smith, Guenther and Subar18–20).
There is a lack of understanding of the diet quality and therefore nutritional adequacy of several popular WL diets as few meal plans have been analysed and reported(Reference Anton, Hida and Heekin21). Further, a focus on cardio metabolic factors and WL is prevalent within the literature with minimal information specifically related to nutrition profile of diets(Reference Anton, Hida and Heekin21–Reference Karlsen, Rogers and Miki24). Furthermore, previous research is predominantly from an American context and has principally focused on meeting male requirements only(Reference Engel, Kern and Brenna25–Reference Rankins, Williams and Montgomery27). Therefore, the aim of the present research is to (1) identify popular diets in an Australian context and (2) determine the nutrition profile of such diets through meal plan analysis. In addition (3), the nutrition profile of meal plans will be compared with the current Australian government recommendations and with international recommendations which reflect a Mediterranean-style diet. Diets will be assessed in terms of food groups, micronutrient intake, acceptable macronutrient distribution and other indicators of health.
Materials and methods
Identification of current popular weight loss diets
Popular diets were identified using Australian Google Trend data during March to April of 2019 and throughout the grey literature. The Google Trend specifications were search terms as opposed to topic, date (2015–2020), web searches and geographically restricted to Australia. The free tool was used to determine the popularity and relevance within Australia by estimating the relative search volume(28). If diets were similar, for example, Optifast and Optislim, the diet with the highest popularity in Australia over the last 5 years was selected for further investigation. Grey literature was obtained from government websites and sources including the Dietitian’s Association of Australia, Sports Dietitians Australia and Health Direct. Further, during 2019, the Booktopia ‘best sellers’ list was used to guide the most popular WL diets.
Trending searches and relative search volume indicate the number of searches entered into Google. The Google search engine recognises popular search terms such as intermittent fasting and dieting and can collate search terms into topics which are a aggregation of search terms(28). Various researchers across disciplines have utilised Google trend data to identify popularity rankings of diets, to assess trends in health care research, to predict disease prevalence and to determine economic indicators such as unemployment claims(Reference Kamiński, Skonieczna-Żydecka and Nowak29–Reference Choi and Varian34). Further, this tool has been identified as becoming increasingly popular, primarily in the use of surveillance studies due to strong correlations with external data sets(Reference Nuti, Wayda and Ranasinghe30).
Introduction of popular diets
Keto diet
The Ketogenic, or Keto diet, can be classified as a high-fat, moderate protein and low-carbohydrate diet with varying and macronutrient specifications (Table 1)(35). Fat provides the majority of energy (kJ) (∼75 %), while protein generally supplies 15–20 % of energy intake. Carbohydrates supply the remaining 5–10 % of daily energies or < 50 g/d to remain in ketosis(Reference Walczyk and Wick36).
Table 1. Examples of the variations of the Keto diet with different macronutrient ratios and protocols

Adapted from Diabetes.co.UK(Reference Walczyk and Wick36), PRO, protein; CHO, carbohydrate; %en = percentage of energy.
Processed foods and high-carbohydrate fruits, vegetables and legumes are excluded or consumed in minimal amounts to limit glucose intake and ensure fat is the primary energy source. The diet is therefore likely to be deficient in multiple food groups and consequently micronutrients(Reference Ting, Dugré and Allan17,Reference Walczyk and Wick36–Reference Bravata, Sanders and Huang38) . The diet typically high in animal protein such as beef, chicken, turkey, high-fat foods and oils such as avocado, coconut oil, butter and ghee, with small amounts of non-starchy and low-energy fruits and vegetables(Reference Ting, Dugré and Allan17,Reference Freire39) .
Paleo diet
The Paleo, or Paleolithic diet, is generally classified as a moderate protein, carbohydrate and moderate to high-fat diet which is intended to reflect a hunter gatherer diet similar to that of our ancestors(Reference Manheimer, van Zuuren and Fedorowicz40–Reference Obert, Pearlman and Obert42). Consequently, the diet is based on primarily fresh produce, i.e. meat, fish, vegetables, seeds, nuts and fruits with minimal cereal products and processed foods(Reference Pitt41,Reference Metzgar, Rideout and Fontes-Villalba43) . Various categories of Paleo diet exist including Ketogenic Paleo diets which further restricts carbohydrates from fruit and vegetables and 80/20 Paleo diets which reflect a flexible approach of eating Paleo 80 % of the time. Lacto-Paleo and Primal Paleo diets include animal-based dairy products that are organic, grass-fed and full-fat, while Pegan diets (Paleo-vegan) eliminates all animal-based foods, focusing on plant-based foods (Table 2).
Table 2. Examples of variations of the Paleo diet

Intermittent fasting
Previously, reasons for fasting included times of famine, religious reasons, blood tests or surgery preparation and more recently and popularly for WL purposes (Table 3)(Reference Freire39,Reference Obert, Pearlman and Obert42) . The basis of intermittent fasting is to minimise food intake for a sustained period of time, such that the body will burn excess stored fat for energy(Reference Seimon, Wild-Taylor and Keating44). There are typically no restrictions on food groups or foods while following an intermittent fasting diet, the emphasis lies on consuming energies within a specified ‘eating window’.
Table 3. Examples of varying types of intermittent fasting diets

Adapted from Freire 2019.(Reference Freire39)
Table 4. Overview of the four Optifast protocols depending on energetic intake and number of meal replacements(50,141)

MR = Meal replacements; kcal = kilocalories.
Previous research has indicated that intermittent fasting can result in improved lipid profiles, metabolic markers and physiology that are often attributed to the decrease in body weight due to an energy deficit, not the fasting itself(Reference Freire39,Reference Santos and Macedo45) . Further, studies suggest that intermittent fasting diets are not necessarily more effective than continuous energy restriction but does provide an alternative WL strategy to suit some(Reference Headland, Clifton and Keogh46,Reference Headland, Pedersen and Carter47) .
8 Weeks to Wow
Eight Weeks to Wow (8WW) is an eight-week challenge that eliminates and re-introduces certain foods (online Supplementary Table S4) over a fortnightly basis(Reference Brabon-Hames and Brabon48). The ‘core foods’, consisting of compulsory greens, vegetables, meats and seafood, dairy and eggs, high-protein breads and low carbohydrate replacements, remain consistent across the eight weeks. Across weeks 3–8, small quantities of nuts, fruit and grains are introduced on certain days.
This dietary pattern claims to be developed in collaboration with chefs, dietitians, nutritionists, general practitioners and physiologists(Reference Brabon-Hames and Brabon49). 8WW generally falls under the low carbohydrate, relatively low fat, and high-protein diet category, with a large proportion of meat and animal products consumed daily (online Supplementary Table S4).
Optifast
Optifast is a very-low-energy-diet meal replacement available on the market designed for WL interventions, or as a precursor for bariatric surgery(50). Further, Optifast products are formulated to offer a complete nutritional profile, ensure adequate protein intake and preserve lean body mass (0·8–1·0 g/kg adjusted ideal body weight).
The macronutrient distribution can be described as a moderate to high-protein diet with moderate carbohydrate and low to moderate fat. Low-energy diets and meal replacements can induce ketosis and result in rapid WL at a rate of 1·0–2·5 kg/week(50).
Introduction of healthy eating principles – comparator diets
Globally, recommendations for healthy eating principles are moving towards more sustainable and primarily plant-based dietary patterns(51,52) . This is evident considering Canada’s recently updated Food Guide(52) and the American Dietary Guidelines (2015–2020)(51) which highlight and recommend vegetarian and Mediterranean-style healthy eating patterns. Evidence-based healthy eating principles, such as the AGHE and a predominantly plant-based diet such as the Mediterranean diet (MedDiet), are often overlooked for WL purposes. Therefore, the two healthy eating principles were used to highlight their applicability and to act as a comparator to the other WL diets and demonstrate an energetic deficit without restrictive behaviour that is typically seen with popular diets that remove food groups or eliminate certain foods.
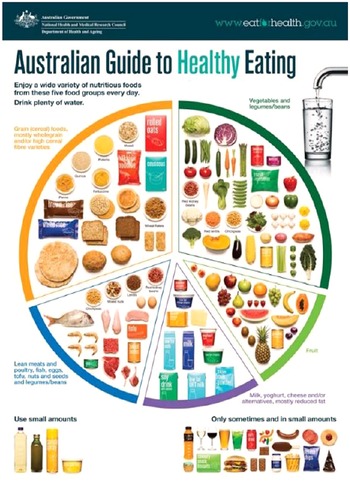
The Australian Guide to Healthy Eating
The AGHE and Australian Dietary Guidelines have a sound scientific evidence basis and promote a balanced varied diet to reduce disease risk(2). Together, the guidelines provide information about required serving sizes per day from the five food (Fig. 1) groups for different life stages, i.e. infant, toddler, adolescent and adult, the quantity of a serving size from each of the food groups and their energy contribution, information about discretionary foods and their serving size for good health and prevention of disease(2). The guidelines also include advice about fat quality, sugar, salt and alcohol intake and how to choose healthier food alternatives.

Fig. 1. The Australian Guide to Healthy Eating(2).
The Mediterranean diet
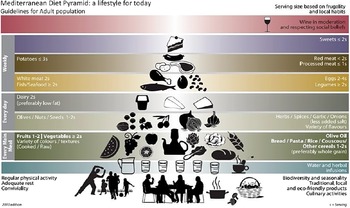
The implementation of a Mediterranean style of eating continues to emerge due to its vast evidence basis, health benefits, association with a low disease risk and increased life expectancy(Reference Murphy and Parletta53–Reference Bach-Faig, Berry and Lairon55). Previous research in an Australian population demonstrates that the MedDiet can be adhered, resulting in significant improvements to cardiovascular health(Reference Murphy and Parletta53,Reference Knight, Bryan and Murphy56) . Unlike the AGHE, the MedDiet lacks specific and quantifiable serving sizes, but rather uses a diet pyramid to display the approximate quantities and frequency of consumption (Fig. 2)(Reference Davis, Bryan and Hodgson54,Reference Bach-Faig, Berry and Lairon55) . The MedDiet eating principles have a strong focus on plant-based eating with ample cereals, wholegrains, fruits, beans, legumes, nuts and vegetables appearing in the daily dietary intake, alongside olive oil, cheese and yogurt(Reference Murphy and Parletta53–Reference Bach-Faig, Berry and Lairon55). Further, the dietary pattern is high in heart-healthy MUFA and PUFA, primarily consumed through extra virgin olive oil(Reference Murphy and Parletta53–Reference Bach-Faig, Berry and Lairon55).

Fig. 2. The Mediterranean diet pyramid(Reference Bach-Faig, Berry and Lairon55).
Dietary input
Meal plans from each of the popular diets were obtained and the energy, macronutrient and micronutrient compositions were determined using Foodworks Professional Dietary Software V9 (Xyris). Sample meal plans from diet books and online resources have previously been used in research to determine nutrition profile of diets(Reference Karlsen, Rogers and Miki24,Reference Turner-McGrievy, Wirth and Hill57) . To evaluate diets against the Australian government guidelines, diets were assessed in comparison with the recommended servings per day of the five food groups and the Nutrient Reference Values (NRVs) for an adult (19–50 years old).
The reference figure, 8700 kJ (2071 kcal) is an energy intake guide for Australians to maintain weight(58,59) . Though an approximation of energy intake, this reference figure is often present on food and beverage product labels in Australia to provide consumers with nutrition information(58–60). Further, moderate daily energy restriction of 500–1000 kcal is often recommended for the safe WL of 0·5–1 kg per week(Reference Seimon, Wild-Taylor and Keating44,Reference Das, Saltzman and Gilhooly61–65) . This extent of energetic restriction equates to an approximate reduction of 20–40 % of energy intake with 30 % as the midpoint(Reference Seimon, Wild-Taylor and Keating44,Reference Das, Saltzman and Gilhooly61,Reference Collins, Neve and Palmer66) . Severe energy restriction (65–75 %) may be necessary for certain populations, however, is cautioned due to negative effects on body composition including bone mineral density and lean mass(Reference Seimon, Wild-Taylor and Keating44). Where diets had multiple meal plans available for different energy targets (kcal/kJ), a systematic approach was taken to determine the most suitable meal plan based on the approximate energy levels required for WL, i.e. approximately 6090 kJ/1500 kcal (30 % energy restriction from 8700 kJ/2071 kcal).
The primary aim, when possible for comparison, was to achieve similar energy levels across diets and close to the 6090 kJ/1500 kcal energy target. Certain diets did not provide meal plans based on energy content, i.e. a 6090 kJ/1500 kcal meal plan, nor did they have an approximate or predicted energy intake. Therefore, the meal plan was entered as per the information provided in the resource and the energy intake was derived solely from Foodworks Software.
Justification of energy (kJ) content and sub-types/protocol of diets chosen
Keto: A 7140 kJ–7560 kJ (1700 kcal–1800 kcal) meal plan (online Supplementary Table S1) was used as no alternatives were provided in the WL book(Reference Walker67). The Keto diet can be considered high energy due to the increased consumption of fat and considerably energy dense foods. Despite the energy intake that is slightly higher compared with the other WL diets included, the Keto meal plan still 1134 kJ–1554 kJ (270 kcal–370 kcal) below the generic recommended value of 8700 kJ/2071 kcal to maintain a healthy weight(68) and should therefore result in WL for some individuals.
Paleo: The meal plan from the book ‘Paleo for Beginners’(Reference Press69) was used and provided a 30-d meal plan. The first 7 d were used which were representative of the total 30-d. The option for different kJ ranges was not present, nor was there a predicted energetic intake; therefore, the standard meal plan was entered into Foodworks (online Supplementary Table S2). The provided meal plan best reflects a ‘standard Paleo diet’ as opposed to a variation (Table 2).
Intermittent Fasting: the 5:2 meal plan was utilised(Reference Chambers70) (online Supplementary Table S3) as it is believed to be the most accurate representation of the intermittent fasting diet and the most implemented from a research basis (14, 16, 63–65). The 16:8 approach was also investigated as an example of intermittent fasting, however, was decided against after Google trend data were acquired which indicated a lower popularity. The 2:5 or 5:2 protocol was far more popular compared with 16:8 and when compared with solely searching intermittent fasting.
8WW: The food list provided by 8WW (online Supplementary Table S4)(Reference Brabon-Hames and Brabon49) was entered into food works as the full 8 weeks as the introduction of new foods alters the nutrition profile and would misrepresent the diet. No estimations of energetic intake were provided by the resource. When quantities of foods were provided, the midpoint, i.e. the recommended number of grams of quantity for men and women was used. For example, the food list recommends males consume 200 g of compulsory greens per day, 150 g for females, therefore, the midpoint was 175 g.
Optifast: A 5040 kJ/1200 kcal meal plan (approximately 40 % energetic deficit) (online Supplementary Table S5) was chosen as the most appropriate as the 6300 kJ/1500 kcal meal plan is considered the ‘maintenance’ level with no Optifast products. Further, the 4200 kJ/1000 kcal plan and 3360 kJ/800 kcal meal plan were considered too large of an energy deficit (> 50 %) to that of the reference and therefore were inappropriate to use for an individual with a healthy BMI (18·5–24·9 kg/m2)(71). The meal plan was based on sample meal plan (My Meal Planner) and recipes provided on the Optifast website which requires a member account.
AGHE WL: An energy intake target of approximately 8700 kJ/2071 kcal was used as a reference. The meal plan was based on the AGHE and Australian Dietary Guidelines. Two of 7 d were provided and found on the Australian government websites Eat for Health and the NHMRC as examples of daily meal plans. Remaining meals and recipes were gathered from these two websites (online Supplementary Table S6). Differences in serving sizes for males and females were considered and an average was taken to accommodate for this. The ‘WL’ or energy restricted version was also entered into Foodworks with smaller portions and lower energy options to meet 30 % energy restriction (6090 kJ/1450 kcal).
MedDiet WL: The book ‘The Mediterranean Diet’(Reference Itsiopoulos72) provided three different meal plans including a traditional meal plan (8000 kJ/1905 kcal), a WL meal plan (7100 kJ/1690 kcal) and a meal plan for chronic disease prevention (8000 kJ/1905 kcal). The ‘WL’ meal plan (7100 kJ/1690 kcal) as it closely met the reference value (online Supplementary Table S7) was selected.
Entering dietary information into Foodworks and Excel
Meal plans were entered into Foodworks software V9 (Xyris). Ingredients that were not accessible on Foodworks required swaps and substitutions of the closest possible ingredient. For example, a snack in the Intermittent Fasting meal plan noted ‘good quality maize chips’ and therefore this was assumed to be a popular brand or premium product as opposed to home brand. Further, assumptions around measurements were also addressed systematically, i.e. a sprinkle equated to approximately half a flat teaspoon (2–3 g) for consistency.
8WW provided a food list as opposed to a meal plan equipped with recipes. Therefore, the complete food list for 8WW was entered across the eight weeks to gauge an understanding of the overall nutrition profile of the dietary pattern. The original core food list was entered into Foodworks for weeks 1 and 2 for Monday to Sunday and then copied for the remaining weeks with the addition of the foods that are re-introduced starting from week 3.
Results
Energy intake
Total energy content of the diets ranged from 5042 kJ (1200 kcal) (Optifast) to 8879 kJ (2114 kcal) (Keto) per day (Table 5). Intermittent fasting and the AGHE WL were similar in energy content, ranging from 6091 kJ to 6483 kJ (1450–1543 kcal). The MedDiet WL and Paleo were also close in energy, differing by 205 kJ (48 kcal) (Table 5). 8WW had an average daily energy intake of 7269 k (1731 kcal), however, energy content differed weekly with a linear increase over the eight weeks with the reintroduction of food groups (Fig. 3).
Table 5. Macronutrient distribution (%en/g/d) and energy content (kJ/kcal/d) for each dietary pattern and healthy eating principle
(Mean values and standard deviations)

PRO, protein; CHO, carbohydrate; Sat Fat, saturated fat; kJ; kilojoule; kcal, kilocalorie; 8WW, Eight Weeks to Wow; MedDiet, Mediterranean diet; WL, weight loss.
* Energy intake (EI) is the mean of a 7-d meal plan except for 8 **Weeks to Wow which is the average of eight weeks (individual weeks have variation in macronutrient composition and energy intake).

Fig. 3. Weekly average energy intake (kJ) across the eight weeks of the 8WW meal plan (Mean ± sd).
Macronutrient distribution and contributions to energy
All diets were within the acceptable macronutrient distribution(73) recommended protein range (15–25 % energy) except for 8WW and Optifast (56 and 26 % energy from protein, respectively) (Table 5). The MedDiet WL and AGHE WL had the lowest protein intake (20 %) and provided 83 g and 71 g of protein, respectively. 8WW supplied more than twice the upper recommendation of 25 %en providing 240 g per day (56 %en), up to 169 g more than the other diets.
Carbohydrate targets of 45–65 %en were only met by Optifast and the AGHE WL with 48 % and 47 %, respectively. Remaining diets were below the requirements, providing up to 36 %en from carbohydrates with Keto providing the lowest amount (6 %en), followed by 8WW (11 %en). Absolute amount of carbohydrates ranged from 6 g to 174 g, with three (Keto, Paleo and 8WW) of seven diets containing below 100 g/d.
The recommended total fat intake of 20–35 %en was exceeded by six of seven diets. Paleo (51 %en) and Keto (70 %en) approximately 1·5 to 2·0 times over the recommended target intake, providing 93–168 g of fat per day, respectively. Three diets exceeded the 10 %en from saturated fat target (Keto, Paleo, 8WW), with the lowest saturated fat intake coming from Optifast with 4 %en. For monounsaturated fat, three of seven diets were above 20 %en from MUFA and the remaining diets 16 %en and below. Polyunsaturated fat %en ranged from 3 % (Optifast and 8WW) to 10 % (Keto).
Optifast and Intermittent Fasting had the highest percentage of daily energy intake coming from fibre with 6 %en (40 g) and 5 %en (36 g), respectively. Further, alcohol intake was low in most diets, apart from the MedDiet WL, where alcohol contributed to 4 %en (9 g alcohol). Remaining diets were equal to, or below 0·6 %en, and less than 1 g of absolute amount of alcohol (Table 5).
Australian Guide to Healthy Eating food groups
Fruit consumption varied considerably between meal plans (Fig. 4). Optifast and the AGHE WL both met or exceed the daily fruit requirements, while 8WW just below the two servings per day (1·9 serves). Further, all meal plans (7/7) did not meet the recommendation for breads and cereals, ranging from < 1·0 serving to 4·8 servings per day. In addition, most meal plans (6/7) did not provide the recommended intake for dairy and alternatives, except for Intermittent Fasting. The Paleo diet meal plan excluded this food group entirely. Oppositely, most meal plans (5/7) met the vegetables recommendation, providing up to twelve servings per day. Comparably, most meal plans met the recommended intake for lean meats, poultry and alternatives (4/7), but the AGHE WL and Optifast provided ≤ 2 servings, and others such as 8WW, Keto and Paleo grossly exceeded the recommended servings by up to three times (9·1 servings per day). Further, the Keto diet was the only diet to exceed discretionary food group recommendations while the remaining diets fell within the recommended 0–3 servings.

Fig. 4. Summary figure of the average number of servings per day of the AGHE food groups for each diet based on their respective meal plans. ![]() , Keto;
, Keto; ![]() , Paleo;
, Paleo; ![]() , Intermittent Fasting;
, Intermittent Fasting; ![]() , 8 Weeks to Wow;
, 8 Weeks to Wow; ![]() , Optifast;
, Optifast; ![]() , MedDiet WL;
, MedDiet WL; ![]() , AGHE WL
, AGHE WL
Micronutrient intake
Most diets were low in multiple micronutrients. However, all diets met Vitamin C intake, ranging from 90 mg (Keto) to 630 mg (Optifast) exceeding the recommended daily allowance (RDI) and EAR by > 1400 %. Similarly, Vitamin E intake was adequate for all diets, ranging from 11 mg (AGHE WL) to 29 mg (Keto) and meeting the RDI for males and females. In addition, all diets met riboflavin requirements (1·5 mg/do 2·5 mg/d), niacin requirements (30·2 mg/d to 111 mg/d), Vitamin B12 requirements (2·95 µg/d–14·5 µg/d) and Phosphorous requirements (1249 mg/d–2647 mg/d). Further, all diets supplied adequate selenium ranging from 70 µg/d to 103 µg/d.
All diets had an adequate fibre intake for females (online Supplementary Table S8) (25 g) except for the Keto diet (19·9 g/d) and 8WW (21·3 g/d), while only two diets (Intermittent Fasting and Optifast) provided ≥ 30 g/d, meeting the male requirement. Folate requirements were met by all diets except for Paleo (283 µg/d), which met 71 % of the RDI and 89 % of the EAR for males and females, and Keto (355 µg), which met the EAR but not the RDI. Vitamin A (retinol equivalents) content of the Keto and Optifast diets ranged from 831 mg (92 % of the RDI for males and 119 % for females, respectively) to 2095 mg (233–299 % of the RDI for males and females, respectively). Remaining diets ranged from 983 mg/d (Intermittent Fasting) to 1363 mg/d (Paleo). Optifast was the only diet that met the thiamin RDI for males and females with an average daily intake of 1·99 mg (166–181 % of the RDI). Intermittent fasting met the RDI for females but not males with an intake of 1·16 mg/d, 105 % of the RDI. Paleo and 8WW similarly provided < 0·9 mg/d and only met between 65 and 96 % of EAR and RDI requirements.
Ca requirements (RDI) were met by almost half of the diets (3/7) (online Supplementary Table S8). Paleo met only 37 % of the RDI and 44 % of the EAR for males and females. The MedDiet WL also did not meet the RDI or EAR, providing only 782 mg/1000 mg but was approximately twice that of Paleo (366 mg). The AGHE (953 mg/d) met the Ca EAR but fell short of the RDI. Intermittent fasting had the highest Ca intake, 1368 mg/d followed closely by Keto (1249 mg/d). In addition, intermittent fasting, as well as all other diets, met the Fe RDI for males. But, Optifast was the only diet to meet the RDI for females supplying 106 % of requirements and an average of 19 mg/d. In a similar manner, only one diet, 8WW met the RDI for male Zn requirements, supplying an average of 24 mg/d. Remaining diets ranged from 9·1 mg/d (AGHE WL) to 13·1 mg/d (Optifast), meeting the female RDI and EAR, but only 65–94 % of the male RDI and 76–91 % of the male EAR.
RDI iodine requirements (150 μg/d) were only met by the AGHE WL with an average intake of 152 μg/d. Remaining diets (5/7) met the EAR requirements (online Supplementary Table S8), except for the Paleo and Keto diets which both supplied 54 to 98 % of the EAR, 54·4 μg/d and 97·7 μg/d, respectively, or one to two-thirds of the RDI. Furthermore, all diets met the Mg RDI for females (≥ 320 mg/d); however, only three diets (3/7) met the RDI for males.
Optifast had the highest P intake (5776 mg/d), more than twice the AI for females (206 %) and one and a half times the AI for males (152 %). 8WW had the second highest intake and was also > 5000 mg/d, 1·3 to 1·8 times the AI for males and females, respectively. The five remaining diets did not meet the AI for males with Keto having the lowest intake, 2802 mg/d (73 %) and others ranging from ∼3000 mg/d to ∼3700 mg/d. In addition, Na intake varied between diets with multiple meal plans exceeding the SDT (Intermittent Fasting, the AGHE WL, Keto and Optifast). Optifast had the highest Na intake (3903 mg/d), almost twice the suggested dietary target, and the MedDiet WL meal plan had the lowest daily average intake (1214 mg/d).
Discussion
Australian Guide to Healthy Eating food groups and macronutrients (protein, fat and carbohydrate)
Low fruit and vegetable consumption is a risk factor for mortality(74). Most diets in the present study (5/7) met or exceeded the recommendation for vegetables, similar to previous research(Reference Karlsen, Rogers and Miki24), but did not for fruit with diets containing as little as 0·2 serves per day. Further, increased consumption of wholegrains and breads and cereals is associated with a reduced risk of disease and adequate fibre intake(Reference Probst and Tapsell75–Reference Slavin77). Interestingly, none of the diets explored met the breads and cereals recommendations. Breads, cereals and grains are often a restricted food group(Reference Engel, Kern and Brenna25,Reference Zinn, Rush and Johnson26,Reference Ma, Pagoto and Griffith78) . Paleo diet supporters argue that the high rates of obesity, heart disease and diabetes are a direct result of the Western diet and that consumption of food groups such as dairy and breads and cereals leads to inflammation and disease(Reference Pitt41). But these claims are inconsistent with the scientific evidence(Reference Metzgar, Rideout and Fontes-Villalba43,Reference Probst and Tapsell75–Reference Slavin77,Reference He, van Dam and Rimm79) . Some low carbohydrate meal plans, similar to diets in the present study, contain between 6 and 45 %en from this food group(Reference Ma, Pagoto and Griffith78). However, Probst and Tapsell(Reference Probst and Tapsell75) have demonstrated that breads and cereals can be incorporated into WL or weight maintenance plans and result in WL and weight maintenance.
Interestingly, there is currently no upper limit of protein intake for adults due to insufficient evidence and research(80). However, some research suggests that the ‘tolerable upper limit’ for well adapted individuals such as athletes could be as high as 3·5–5·0 g/kg/body weight per day(Reference Bilsborough and Mann81–Reference Wu83). Research suggests that higher protein diets which are approximately 25–35 %en or > 1·05 g/kg/body weight per day may have a beneficial role in WL by maintaining resting energy expenditure and lean mass(Reference Phillips84–Reference Krieger, Sitren and Daniels88). However, the efficacy of long-term (> 2 years) high-protein diets (25–40 %en) for WL are said to be relatively minimal(Reference Leidy, Clifton and Astrup85) or inconclusive(Reference Lepe, Bacardí Gascón and Jiménez Cruz89) based on biochemical data and body composition. A high-protein diet may be suitable for the short-term and useful for WL due to satiety effects(Reference Morales, Tinsley and Gordon90). But long-term excessively high-protein intake could displace other food groups, increase blood pressure, affect kidney function and increase Ca excretion(Reference Delimaris91–Reference Denke93). Most diets (4/7) exceeded the recommended number of servings per day for lean meats and poultry. Further, 8WW provided an average of 240 g of protein per day, ∼4 times the recommended protein amount and the equivalent of a 300 kg person consuming the average intake (0·8 g/kg body weight) or, alternatively, a 100 kg power lifter or resistance training athlete that requires ∼2·4 g/kg body weight(Reference Phillips84).
The fat content of WL diets also varies considerably(Reference Engel, Kern and Brenna25,Reference Zinn, Rush and Johnson26) . In the current research, Keto and Paleo can be classified as very high fat (1·5 to 2 times the recommended intake). High-fat diets can lead to modifications in the gut microbiome composition, inflammatory responses, decreased fatty acid oxidation and other physiological modifications related to obesity(Reference Seid and Rosenbaum94–Reference David, Maurice and Carmody98). The MedDiet can also be considered high fat; however, the fat is predominantly MUFA which is beneficial for fasting insulin, lowering glucose levels and lowering blood pressure(Reference Clifton and Keogh99). Research suggests that choosing lower fat varieties(Reference Zinn, Rush and Johnson26), or replacing SFA with MUFA or PUFA is beneficial and reduce the risk of metabolic syndrome and cardiovascular events(Reference Clifton and Keogh99,Reference Julibert, del Mar Bibiloni and Tur100) .
Low-carbohydrate diets are reported to have unfavourable effects on lipid profiles due to the limiting of fibre rich fruits, vegetables and wholegrains(Reference Dinu, Pagliai and Angelino23), as do higher protein diets due to increased saturated fat intake and lower fibre(Reference Dinu, Pagliai and Angelino23).
A recent systematic review and meta-analysis (121 trials, n 2200) compared fourteen macronutrient focused popular dietary programmes for cardiovascular disease risk and WL(Reference Ge, Sadeghirad and Ball22). Low fat (Ornish, Rosemary Conley) and low-carbohydrate diets (Atkins, South Beach, Zone) were found to yield similar results at 6 months in regard to WL (4·4 kg v. 4·6 kg), systolic blood pressure (5·05 mmHg v. 5·14 mmHg) and diastolic blood pressure (2·85 mmHg v. 3·21 mmHg) when compared with a usual, non-control diet(Reference Ge, Sadeghirad and Ball22). Similarly, a meta-analysis of forty-eight RCTs comparing WL programmes in overweight and obese adults at 6 and 12 months found low carbohydrates to incur a greater amount of WL at both the 6- (8·73 kg 95 % CI), and 12-month follow ups (7·25 kg 95 % CI)(Reference Johnston, Kanters and Bandayrel101), similar to that of low-fat diets at 6 (7·99 kg 95 % CI) and 12 months (7·27 kg 95 % CI)(Reference Johnston, Kanters and Bandayrel101,Reference Truby and Haines102) . In addition, an umbrella review of meta-analyses (n 80) of dietary interventions reported WL with low-carbohydrate (–0·98 kg to –7·05 kg) and low fat diets (–1·12 kg to –1·97 kg) and Mediterranean (–1·75 kg to 2·24 kg) and DASH diets (–0·082 kg to –2·03 kg)(Reference Dinu, Pagliai and Angelino23). In contrast, a systematic review and meta-analysis of fifty-three RCTs and 68 000 participants found differing results(Reference Tobias, Chen and Manson103). When comparing low-fat interventions to low-carbohydrate interventions for WL trials, low-carbohydrate diets resulted in significantly greater amounts of WL (1·15 kg 95 % CI, I 2 = 10 %)(Reference Tobias, Chen and Manson103).
Low fat and low-carbohydrate diets appear to yield similar results for WL(Reference Ge, Sadeghirad and Ball22,Reference Ge, Sadeghirad and Ball22,Reference Dinu, Pagliai and Angelino23,Reference Johnston, Kanters and Bandayrel101) while ‘moderate macronutrient diets such as the MedDiet and Jenny Craig have less of an impact on WL, but greater effects on LDL cholesterol at 6 months(Reference Ge, Sadeghirad and Ball22). However, differences in WL and improved biomarkers including blood pressure across diets at the 12-month time point are often considered trivial and clinically insignificant(Reference Ge, Sadeghirad and Ball22).
Further, with regard to intermittent fasting, abstaining from food within the fasting window indeed limits energy intake. However, it is a common misconception that the fasting period outweighs or counterbalances an unbalanced diet during the eating window. That is, individuals can eat ad libitum during the eating window and not be conscious of their energy intake if WL is the desired goal. Consequently, intermittent fasting diets are often used in conjunction with an additional diet such as Keto or Paleo and physical activity further adding to a negative energy balance(Reference Freire39,Reference Headland, Clifton and Keogh46,Reference Headland, Pedersen and Carter47) .
Micronutrient profile
The suitability of long-term adherence to multiple diets in the present study is a concern given that they do not meet several of the Australian micronutrient NRVs. However, this may be less of a concern if the diets are followed for a short period of time as opposed to a longer period which may jeopardise an individual’s micronutrient status.
The micronutrient profile of diets used in the current research indicated a low intake of multiple essential vitamins and minerals, consistent with the literature(Reference Engel, Kern and Brenna25,Reference Zinn, Rush and Johnson26,Reference Calton104) . Meeting the NRVs therefore would require additional intervention from the consumer, or preferably a qualified nutrition professional. Research even suggests that in order to meet the recommendations for all essential micronutrients, an average energy intake of 3475 ± 544 kcal (14 595 kJ ± 2 285 kJ) could be required(Reference Calton104). An energy intake within this range is more than 1·5 times the standard AGHE maintenance reference intake (8700 kJ/2071 kcal), 2·5 times the AGHE WL energy intake (6090 kJ/1540 kcal) and approximately twice the MedDiet WL intake (6930 kJ/1650 kcal).
Optifast was one of the only diets that met the majority of NRVs, except for iodine and Zn (males only). The Optifast meal replacement shakes supply one-quarter (110 μg) of daily folate requirements and half (0·6 mg) of daily thiamin requirements which assists in meeting micronutrient requirements. Thiamin is a water-soluble vitamin required for cell growth and development(Reference Whitfield, Bourassa and Adamolekun105–Reference Wiley and Gupta107). Prolonged inadequate intake can affect the body’s cardiovascular system, nervous system and immune system(Reference Whitfield, Bourassa and Adamolekun105–Reference Prinzo110). Low folate diets can result in weakness, fatigue, irritability, heart palpitations and shortness of breath(Reference Khan and Jialal111–Reference Ho, Ashline and Dhitavat113). Adolescent and adult females are a high-risk group for folate deficiency due to concern with inadequate folate and the risk of neural tube defects progressing during pregnancy(Reference Abraham and Webb112–Reference Valerie114).
In 2009, mandatory iodine fortification of bread was employed to address low iodine intakes in Australians(Reference Charlton, Probst and Kiene115). According to the National Health Measures Survey from 2011 to 2012, Australian’s were within the WHO parameters for adequate iodine intake (> 100 μg/l) and < 20 % of the population < 50 μg/l(116). However, according to the current research, most of the dietary patterns explored did not meet the iodine NRVs for males or females. The literature has similarly reported low iodine levels in WL meal plans, providing as low as 16 % of the RDI(Reference Karlsen, Rogers and Miki24,Reference Engel, Kern and Brenna25,Reference Calton104) . Inadequate iodine intake can lead to goitre, hypothyroidism and altered growth and development(Reference Charlton, Probst and Kiene115). Consuming iodine-fortified bread can significantly increase the likelihood of meeting iodine NRVs (EAR) by up to five times in females and twelve times in children(Reference Charlton, Probst and Kiene115). Alternatively, for diets which restrict breads and cereals, iodine may be supplied from fish, seafood and egg products(Reference Charlton, Probst and Kiene115).
One-third of adults aged 19–50 years may have inadequate Mg intakes(117). Similarly, American data indicate up to 68 % of the American population also do not meet their guidelines, the recommended daily allowance (RDA)(Reference Schwalfenberg and Genuis118). Previous research has also identified low intake of Mg with WL diets, providing between 55 and 86 % of requirements(Reference Engel, Kern and Brenna25) and are typically low carbohydrate(Reference Engel, Kern and Brenna25,Reference Calton104) . Mg is a mineral and common intracellular cation involved in energy production, protein synthesis, muscle and nerve function and bone health(Reference Schwalfenberg and Genuis118–Reference Gushcha, Plakida and Nasibullin120). Prolonged inadequate intake of Mg has been associated with low Ca levels, a risk factor for osteoporosis in postmenopausal females and low-grade inflammation(Reference Schwalfenberg and Genuis118–Reference Gushcha, Plakida and Nasibullin120).
Ca is a well-studied mineral essential for bone health, neural and cardiac function and is often consumed in low amounts in WL diets(Reference Nouvenne, Ticinesi and Morelli16,Reference Engel, Kern and Brenna25,Reference Sanders, Nowson and Kotowicz121,Reference Daiane Cristina de Assis, Hillary Nascimento and Maria Tereza de122) . The 2011–2012 Australian Health Survey revealed that up to 44 % of males and 71 % of female Australian’s aged 19–50 years had inadequate Ca intakes(123). The current research also found that four of the seven dietary patterns did not provide adequate amounts of Ca. The Paleo diet provided just over a third (37 %) of the RDI, while other research has quantified Ca intakes to be within 46–78 % of recommendations(Reference Engel, Kern and Brenna25), or provide up to 81 %(Reference Calton104). In contrast, analysis of DASH and Best Life meal plans yielded between 133 and 148 % of Ca requirements, demonstrating the potential to obtain adequate Ca intake while on a WL plan(Reference Calton104).
8WW was the only diet to meet the male RDI for Zn (14 mg/d), likely due to the increased protein (meat) intake (56 %en; 240 g/d). The increased Zn requirements for males are difficult to achieve as confirmed by the Australian Health Survey(124) and previous literature(Reference Engel, Kern and Brenna25). Up to 40 % of adult males (19–50 years old) are considered to have inadequate Zn intakes, and up to 66 % of males aged 50 years and over, compared with females aged 19–50 years (∼14 %)(124). Previous literature has reported meal plans to provide between 57 and 96 % of Zn requirements(Reference Engel, Kern and Brenna25,Reference Calton104) , while others fail to report Zn intake(Reference Karlsen, Rogers and Miki24,Reference Ma, Pagoto and Griffith78) despite remaining a public health concern. Zn has previously been added to a range of cereal products, legume-based protein beverages, meat replacements and plant-based dairy foods(125). Such dietary strategies including supplementation are important to improve Zn intake especially for dietary patterns that are low in animal products(Reference Roohani, Hurrell and Kelishadi126).
In contrast to Zn NRVs, females require additional Fe (8 mg v. 18 mg)(127). Fortification can assist with meeting Fe NRVs by up to 180 %, compared with meal plans that do not specifically include Fe-fortified products(Reference Zinn, Rush and Johnson26,Reference Reid, Marsh and Zeuschner128) . According to the 2011–2012 Australian Health Survey, the average Fe intake for males and females was 13 mg (> 100 % male RDI; 72 % female RDI) and 9 mg/d (> 100 % male RDI; 50 % female RDI), respectively(129). Inadequate dietary intake may further lead to Fe deficiency, depletion of Fe stores and anaemia(Reference Pettit, Rowley and Brown130,Reference Parikh, Natarajan and Lipsitz131) . Further, decreased haemoglobin levels, increased inflammation, ischaemic stroke and heart failure are associated with Fe deficiency(Reference Parikh, Natarajan and Lipsitz131,Reference Choi, Sanchez-Rotunno and Gonzales132) .
Nutrition misinformation
Individuals are actively seeking information on healthy eating, WL and different diets from the internet and non-qualified individuals as opposed to qualified health professions such as nutritionists and dietitians(Reference Pollard, Pulker and Meng5,Reference Kamiński, Skonieczna-Żydecka and Nowak29) . Resultingly, popular platforms for nutrition-related information for the majority are non-institutionalised including Facebook, Twitter, YouTube, online blogs, news sites, Google and Pinterest(Reference Wang, McKee and Torbica133). Visiting non-institutionalised websites and sources of information provides the opportunity for mixed messaging that contradicts institutionalised nutrition messages, creating confusion within the population and potentially harmful health impacts(Reference Fassier, Chhim and Andreeva7,Reference Wansink134,Reference Chou, Oh and Klein135) .
Further, common issues that arise relate to mistaking correlation for causation, extrapolating results to different inapplicable populations, exaggerating effect size and predicting events based on pieces of evidence rather than the overall evidence(Reference Wansink134,Reference Cowan, Sood and Truby136) . These inaccuracies form the basis of many popular and fad diets, in conjunction with promising quick results, recommendations based on a single study, listing foods as good and bad and claims that are a generalised approach(Reference Wansink134).
Conclusion and limitations
Though this research provides valuable insight into current popular diets in Australia and the behaviour of the population using the Google search engine, there are limitations. First, though Google trend data provide access to ‘big data’, the reproducibility of findings may be low. Further, there is minimal evidence for its reliability as a research tool, hence the inclusion of grey literature to support the popular diets that were identified.
Further, using meal plans as opposed to actual dietary intake data may not truly represent or encompass a dietary pattern despite this method being used in other research. However, due to the popularity and large volume of diet and WL books available, this strategy was utilised attempting to reflect a true consumer experience of following a meal plan from bookshelf to plate.
There is an array of different WL diets and dietary strategies which may suit different individuals. Dietary advice should be highly individualised as energy restriction, and removing food groups will lead to WL regardless of the diet(Reference Metzgar, Rideout and Fontes-Villalba43).
Further, challenge-style diets such as 8WW and elimination diets such as Keto and Paleo promote mixed and sometimes poor nutrition messages to the general public and contradicts government and international guidelines for healthy eating. Long-term Adherence to these diets should be monitored by a health professional to avoid micronutrient deficiencies.
Acknowledgements
This research received no external funding but was completed as part of a Research Training Program (RTP) and postgraduate degree at the University of South Australia.
K. J. M. conceptualised the study; E. L. B., K. J. M., J. B. K. and R. M. planned and designed the methodology; E. L. B. performed the data analyses, data curation and reviewed the literature; K. J. M., J. B. K. and R. M. reviewed and edited the manuscript. All authors have read and agreed to the published version of the manuscript.
The authors declare no conflict of interest.
Supplementary material
For supplementary material/s referred to in this article, please visit https://doi.org/10.1017/S0007114521002282