


Besides a sedentary lifestyle, unhealthy eating patterns are major contributors to body weight gain and associated disease states including hypertension, impaired glucose control and CVD(Reference Schlesinger, Neuenschwander and Schwedhelm1–Reference Bechthold, Boeing and Schwedhelm4). To combat obesity and its sequelae, various dietary interventions have focused on macronutrient composition with low-carbohydrate diets being one popular approach(Reference Foster, Wyatt and Hill5,Reference Shai, Schwarzfuchs and Henkin6) . High-quality evidence suggests that the reduction of carbohydrates leads to significant short-term weight loss and metabolic improvements(Reference Foster, Wyatt and Hill5,Reference Shai, Schwarzfuchs and Henkin6) . However, a broad range of food items has to be excluded from the diet that limits the diversity of choices contributing to poor long-term adherence and weight regain(Reference Schwarzfuchs, Golan and Shai7). Furthermore, carbohydrates with beneficial effects might also be excluded from the diet, e.g. complex carbohydrates present in whole grains and legumes(Reference Schlesinger, Neuenschwander and Schwedhelm1).
Therefore, rather than reducing total carbohydrates, more recent interventions have focused on specific carbohydrate subtypes, particularly sugars(Reference Te Morenga, Mallard and Mann8,Reference Lee, Chowdhury and Welsh9) . Sugars are all mono- and disaccharides(10), and different sugar sources relevant to the present study are summarised in Supplementary Fig. 1. According to the WHO, sugars can be divided into free sugars (FS) and intrinsic sugars(11). FS are all monosaccharides and disaccharides added to foods by the manufacturer, cook or consumer, plus sugars naturally present in honey, syrups and fruit juices(11). Since a clear link between FS consumption and body weight gain exists, the WHO recommends to limit FS throughout the life course to < 10 % of total energy intake, i.e. 50 g FS/d for a 2000 kcal diet, and optimally to even below 5 %(11). The National Health Service (NHS) England also recommends a consumption of no more than 5 % of total energy intake from FS(12). However, these recommendations(11,12) do not differentiate between FS sources like FS from beverages or solids. Within beverages, FS are present in soda/fruit drinks, pure juice, milk-based drinks and tea/coffee. FS in solids can originate from treats, cereals, toppings and sauces. Intrinsic sugars represent all sugars that are not FS including sugars from fruit, vegetables and lactose in dairy products(11). In contrast to FS, intrinsic sugars are not associated with adverse metabolic and cardiovascular effects in several studies(11). However, no study so far has elucidated the link between intrinsic sugars and mortality.
Taking published evidence into consideration, it has been well established that FS promote metabolic and CVD(Reference Te Morenga, Mallard and Mann8,Reference Ramne, Alves Dias and González-Padilla13–Reference Fattore, Botta and Agostoni18) . However, no study so far has systematically assessed the association of FS from all relevant sources with all-cause mortality. To address this open point, all major FS sources were assessed within the current study including beverages, solids and their subtypes. All analyses were conducted in a large, well-characterised population of 186 811 UK Biobank participants using penalised cubic splines to allow, in particular, non-linear predictor effects. We hypothesised that the association between FS and mortality depends on FS source with adverse effects being especially related to beverages and differential associations seen for specific beverage subtypes. Furthermore, we hypothesised that high consumption of intrinsic sugars is not related to all-cause mortality.
Methods
Study and participants
All analyses are based on the UK Biobank study that recruited more than 500 000 participants between 2006 and 2010 at twenty-two assessment centres across the UK(19). All participants were assessed at baseline via a self-completed touchscreen questionnaire, a personal interview and physical measurements(19). Participants for the current study were selected from the UK Biobank cohort as presented in Supplementary Fig. 2. Similar to a previous study(Reference Behrendt, Eichner and Fasshauer20), the following exclusion criteria were applied: (1) malabsorption/coeliac disease; (2) missing lifestyle risk factors (physical activity and/or smoking status); (3) missing socio-economic factors (Townsend deprivation index, total household income, ethnic background, highest qualification and/or overall health rating); (4) missing data of the physical exam (BMI, systolic blood pressure); (5) history of diabetes mellitus and (6) implausible energy or carbohydrate intake, i.e. being in the upper 0·1 % of total energy and/or carbohydrate intake or total energy intake <1·1 × basal metabolic rate – 500 kcal (under-reporting) or >2·5 × basal metabolic rate + 500 kcal (over-reporting) resulting in a study population of 186 811 participants (online Supplementary Fig. 2 and 3). Basal metabolic rate was calculated according to the Oxford equation(Reference Henry21).The UK Biobank study was approved by the North West Multicentre Research Ethics Committee, and written informed consent was provided by all participants at baseline(19).
Exposure assessment
To provide detailed dietary information, a web-based 24-h dietary recall (Oxford WebQ) was completed that assesses consumption of 206 foods and thirty-two beverages(Reference Perez-Cornago, Pollard and Young22). The Oxford WebQ was specifically developed for use in large population studies, and completing a single questionnaire has been validated against an interviewer-administered 24-h dietary recall(Reference Liu, Young and Crowe23). A further validation study using objective biomarkers indicates that the results of the Oxford WebQ are broadly similar to those obtained by more researcher-intensive and expensive 24-h recall delivered and coded by trained researchers(Reference Greenwood, Hardie and Frost24). Using the mean of two to five, repeat administrations substantially improve measurement properties(Reference Greenwood, Hardie and Frost24).
UK Biobank participants could complete the Oxford WebQ on up to five occasions. For participants who filled out more than one questionnaire, the mean dietary intake was used for all primary and sensitivity analyses except when only the first completed Oxford WebQ was considered (online Supplementary Fig. 11). The five occasions for participants to fill out the Oxford WebQ were April 2009 to September 2010, February 2011 to April 2011, June 2011 to September 2011, October 2011 to December 2011 and April 2012 to June 2012(Reference Bradbury, Young and Guo25). Within these periods, participants could complete the questionnaire for weekdays or weekends. Intake of sugar and its subtypes was estimated with methodology similar to a recent study(Reference Behrendt, Fasshauer and Eichner26). In brief, for each item of the Oxford WebQ, energy and total sugar values were estimated based on McCance and Widdowson’s The Composition of Foods and its supplements as suggested by Liu and co-workers(Reference Liu, Young and Crowe23), the UK Data Archive Standard Recipes Database(27) and product labels. FS were defined similar to Wanselius and co-workers(Reference Wanselius, Axelsson and Moraeus28), and the decision procedure is presented in Supplementary Table 1. Standard portion sizes were taken from the UK Food Standards Agency(29) and product labels. In the Oxford WebQ, participants specify the number of standard portions consumed of specific food items with quarter and half portions available for some items, e.g. cereal bars and sweet biscuits. For each participant, average intake (g/d) of the sugar subtype under study was calculated by multiplying the frequency of each food item by the estimated content of this sugar subtype in that item in a standard portion. Intrinsic sugars were calculated as the difference between total sugars and FS.
Outcome assessment
Mortality data with date of death were provided by the NHS Information Centre for participants from England and Wales and by the NHS Central Register, Scotland for participants from Scotland(30). Follow-up time was defined as duration between baseline assessment and date of death or censoring (12 November 2021), whichever came first.
Statistical analyses
Data were imported, processed, analysed and graphically displayed with R version 4.0.5(31) as recently described by our group(Reference Schaefer, Kaiser and Behrendt32,Reference Schaefer, Kaiser and Behrendt33) . Cox proportional hazard regression models of overall survival time were fitted with sugar subtypes and energy intake included as penalised cubic splines with their degrees of freedom set to 4. Cubic splines instead of discretised ordinal predictors, e.g. cut-off values, were used for analyses of sugar subtypes to allow continuous non-linear predictor effects. Besides energy intake, models were adjusted for age (quintiles), sex (female, male), ethnic background (Caucasian, Group composed of Mixed, Asian, Black, Chinese and other), BMI (<18·5, 18·5 to <25, 25 to <30 and ≥30 kg/m2), systolic blood pressure (quintiles), Townsend deprivation index (quintiles), general health status (poor, fair, good and excellent), total household income (<18, 18 to <31, 31 to <52, 52 to <100 and ≥100 k£, unknown), highest qualification (none of the below, national exams at age 16 years, vocational qualifications or optional national exams at ages 17–18 years, professional, College or University), smoking status (never, previous, current occasional, current <10, 10 to 14, 15 to 19 and ≥20 cigarettes/d), alcohol intake (<1, 1 to <8 and 8 to <16, ≥16 g/d), physical activity (metabolic equivalent of task (MET)-min/week derived from the Oxford WebQ; quintiles) and history of psychiatric disease (yes, no). The proportional-hazard assumption was tested based on scaled Schoenfeld residuals, and all covariates violating this assumption after Holm adjustment for multiple testing were stratified in the final models.
In all analyses, the nadir was defined as the consumption of specific sugar subtypes with the lowest estimated hazard ratio (HR) over the range from zero to the 99 %-quantile of consumption and the HR at the nadir was set to 1 to simplify presentations and comparisons. Mean HR with pointwise 95 % CI are shown for all mortality analyses and are also described in the text for defined levels of sugar subtype intake.
The analysis of each penalised cubic spline is segregated into its linear and nonlinear effects whose significances are documented by the respective P values (P lin for the linear and P non-lin for the nonlinear effect) of Wald-type tests for joint significance of the multiple coefficients associated with the respective linear or nonlinear portion of the penalised spline fit(Reference Therneau34,Reference Therneau35) . If both P lin and P non-lin were non-significant, no further interpretation of the nadir or other individual HR was performed.
Various sensitivity analyses were performed similar as described by Anderson and co-workers(Reference Anderson, Gray and Welsh36). Three analyses were run to check for reverse causation. First, participants lost to follow-up or dying within 2 years after baseline were excluded (landmark analysis). Second, participants who indicated at baseline that they had lost weight unintentionally were excluded. Third, participants with a history of cardiovascular disease and cancer were removed to assess whether prevalence of these diseases at baseline affected the findings. To control for unrepresentative consumption data, participants who reported their previous day´s diet as non-typical and who completed the Oxford WebQ for a weekend day, respectively, on at least one occasion were excluded in two further sensitivity analyses. Participants with only one or up to two Oxford WebQ were removed from the analysis to address potential variation, i.e. low reproducibility, in sugar intake based on a single and up to two Oxford WebQ, respectively. To consider intake most adjacent to baseline assessment, analyses were re-run using only the first Oxford WebQ questionnaire. Waist:hip ratio (WHR) and height instead of BMI were used as alternative measures for body composition. A diet quality score was generated combining five dietary components, i.e. fat, fruit, vegetables, red meat and processed meat consumption as described(Reference Anderson, Gray and Welsh36) to further control for residual confounding by dietary factors. History of psychiatric disease was not included as a covariate in another sensitivity analysis to assess whether exclusion of this parameter would substantially affect the main Cox model results. A P value of < 0·05 was considered statistically significant in all analyses.
Results
Baseline characteristics and deaths in UK Biobank participants
Baseline data of the study population in total and depending on quintiles of FS intake are summarised in Table 1. Mean (standard deviation (sd)) age of the study population was 56 (8) years with 57·2 % of participants being female. Over a mean (sd) follow-up of 12·3 (1·4) years and 2·3 million person-years, 3811 deaths occurred in females and 4765 in males, i.e. a total of 8576 deaths. The mean (sd) number of dietary questionnaires per participant was 2·2 (1·2).
Table 1. Baseline characteristics of the UK Biobank cohort*
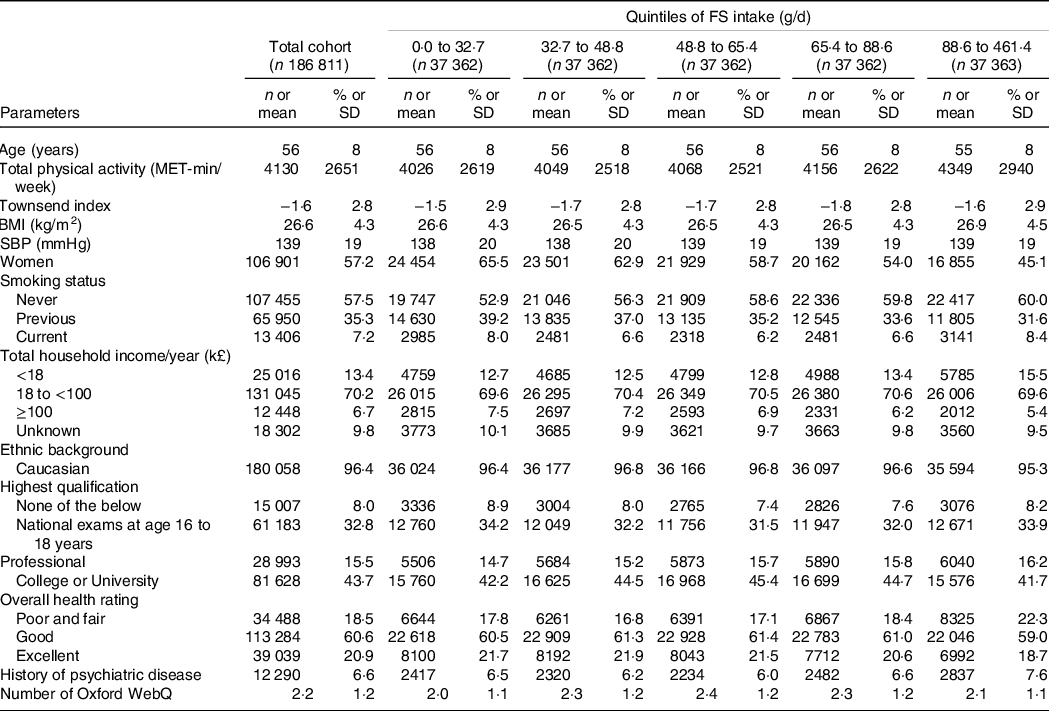
FS, free sugar; MET, metabolic equivalent of task; SBP, systolic blood pressure.
* Categorical variables are presented as number (percentage) and continuous variables as mean (sd).
Free sugars v. intrinsic sugars and all-cause mortality
Mean (sd) intake of FS and intrinsic sugars was 63·0 (37·4) and 66·9 (29·8) g/d, respectively (Table 2). FS intake was beyond the 5 % and 10 % thresholds of total energy recommended by the NHS England(12) and WHO(11) in 89 % and 57 % of participants, respectively (data not shown). FS were dose-dependently and significantly related to all-cause mortality (Fig. 1(a)). The nadir was observed at 25 g/d FS and mean (CI) HR increased to 1·01, 95 % CI (0·99, 1·03) and 1·12, 95 % CI (1·08, 1·17) at 50 g/d and 100 g/d FS, respectively, as compared with 25 g/d FS (Fig. 1(a)). In contrast, intrinsic sugars were not significantly associated with all-cause mortality (Fig. 1(b)). FS remained dose-dependently related to mortality in sensitivity analyses removing the following participants: death within the first 2 years of follow-up (landmark analysis; online Supplementary Fig. 4(a)), unintentional weight loss (online Supplementary Fig. 5(a)), history of CVD and cancer (online Supplementary Fig. 6(a)), non-typical diet (online Supplementary Fig. 7(a)), Oxford WebQ completed for a weekend day (online Supplementary Fig. 8(a)), only one (online Supplementary Fig. 9(a)) or up to two (online Supplementary Fig. 10(a)) completed Oxford WebQ. The association between FS and mortality was still significant if only the first Oxford WebQ was considered (online Supplementary Fig. 11(a)). FS remained significantly and dose-dependently associated with mortality if WHR and height were included as covariates instead of BMI (online Supplementary Fig. 12(a)), if models were further adjusted for the diet quality score (online Supplementary Fig. 13(a)), or if history of psychiatric disease was removed as a covariate (online Supplementary Fig. 14(a)). Similar to the primary analyses, intrinsic sugars were not significantly associated with all-cause mortality in all sensitivity analyses (online Supplementary Fig. 4(b)–14(b)) except after removal of participants with up to two completed Oxford WebQ (online Supplementary Fig. 10(b)).
Table 2. Dietary intake of the UK Biobank cohort*
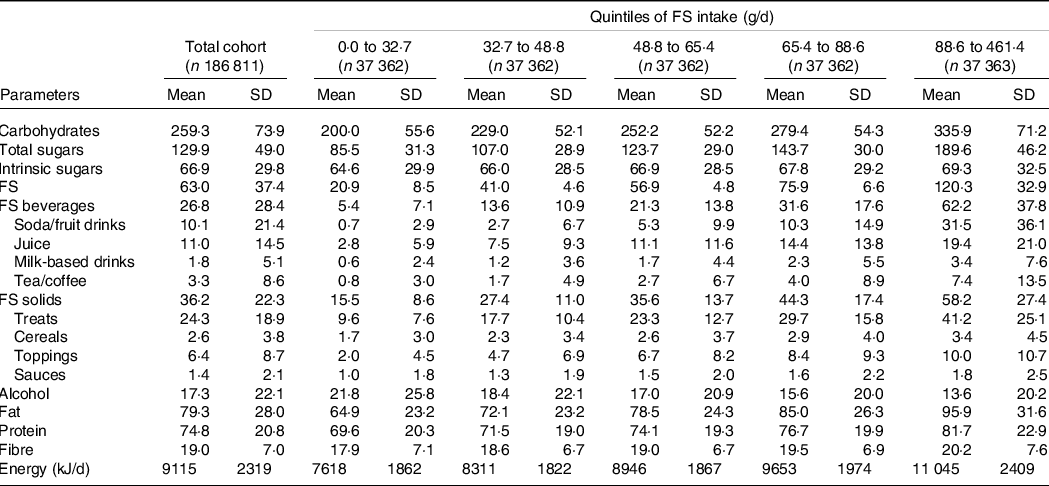
FS, free sugar.
* All nutrients are presented as mean (sd) and in g/d.
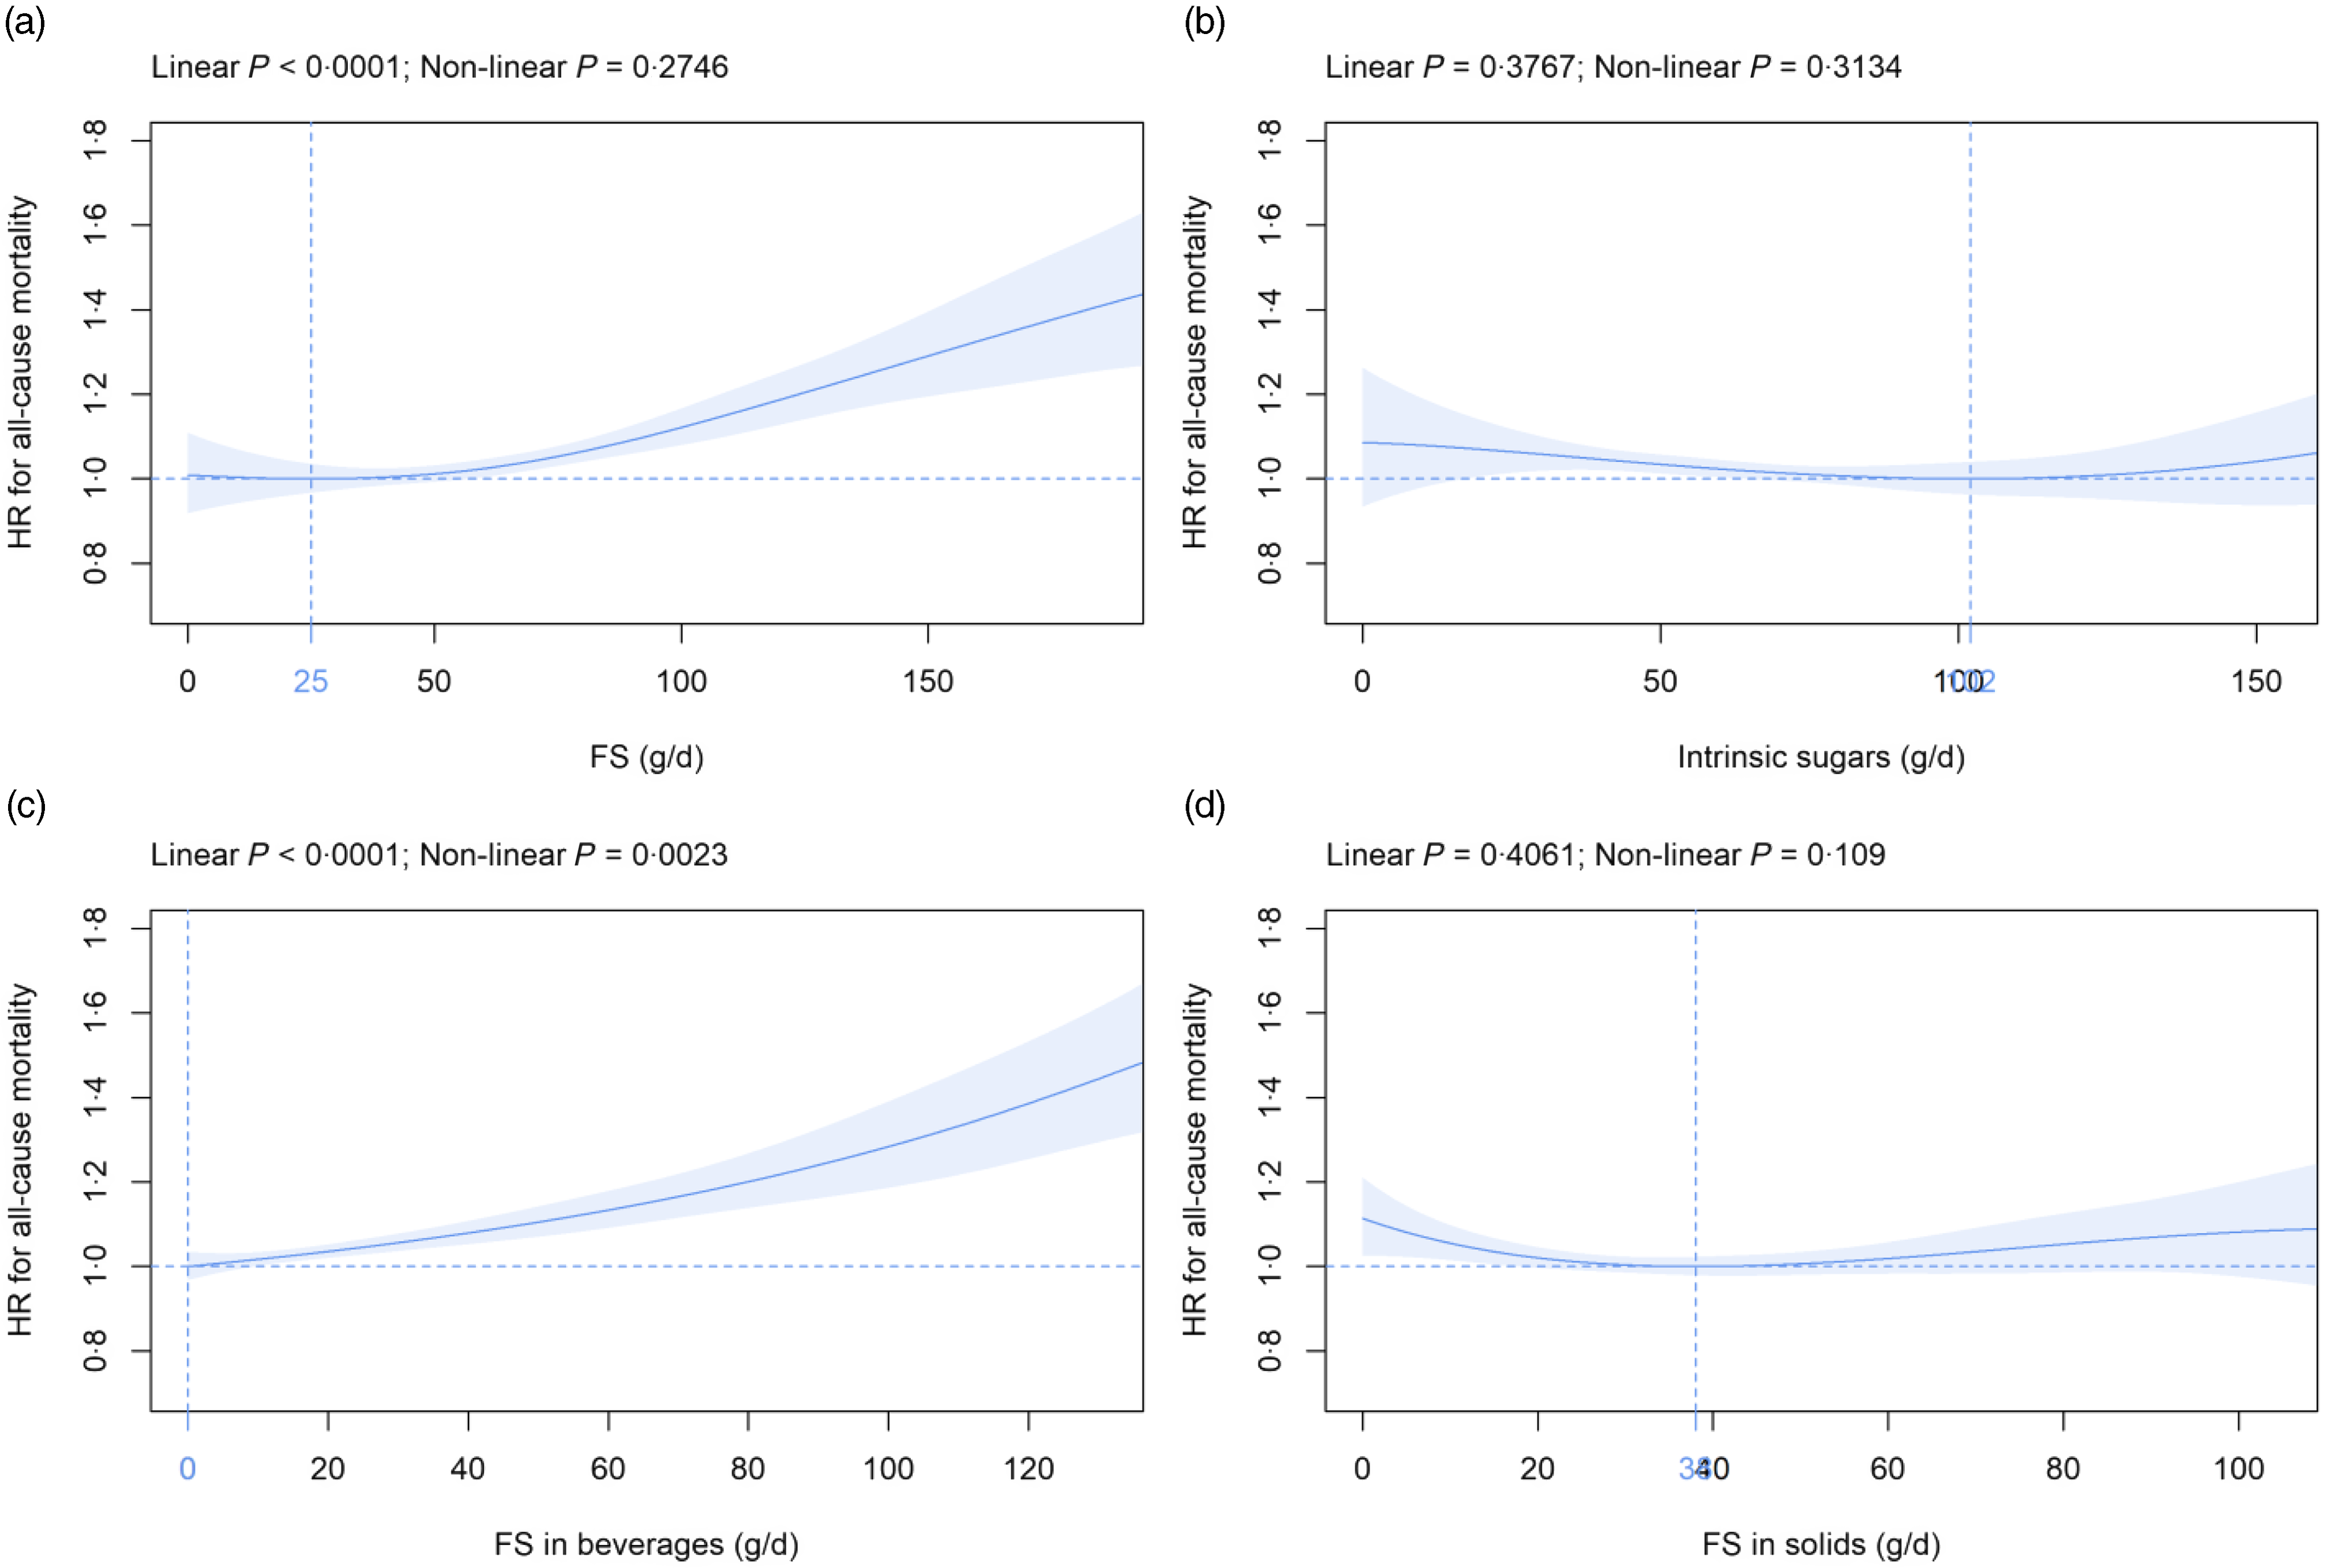
Fig. 1. Association of (a) FS, (b) intrinsic sugars, (c) FS in beverages and (d) FS in solids intake (all g/d) with all-cause mortality. Models are adjusted for energy intake, age, sex, ethnic background, BMI, systolic blood pressure, Townsend deprivation index, general health status, total household income, highest qualification, smoking status, alcohol intake, physical activity and history of psychiatric disease as summarised in the Methods section. Covariates not fulfilling the proportional hazard assumption are stratified. The nadir is indicated in blue. FS, free sugars; HR, hazard ratio.
Free sugars in beverages v. free sugars in solids and all-cause mortality
Mean (sd) consumption of FS in beverages and FS in solids was 26·8 (28·4) and 36·2 (22·3) g/d, respectively (Table 2). FS in beverages were dose-dependently and significantly associated with all-cause mortality (Fig. 1(c)). The nadir was observed at 0 g/d FS and mean (CI) HR increased to 1·10, 95 % CI (1·07, 1·14) and 1·28, 95 % CI (1·19, 1·39) at 50 g/d and 100 g/d FS, respectively (Fig. 1(c)). The association between FS in beverages and mortality remained similar in all sensitivity analyses (online Supplementary Fig. 4(c)–14(c)). FS in solids were not significantly associated with all-cause mortality in the primary (Fig. 1(d)) and in all sensitivity analyses (online Supplementary Fig. 4(d) to 14(d)) except after removal of participants with a history of CVD and cancer (online Supplementary Fig. 6(d)).
Free sugars in beverage subtypes and all-cause mortality
Mean (sd) consumption of FS in beverage subtypes was as follows: soda/fruit drinks 10·1 (21·4), juice 11·0 (14·5), milk-based drinks 1·8 (5·1) and tea/coffee 3·3 (8·6) g/d (Table 2). FS in soda/fruit drinks were dose-dependently and significantly associated with all-cause mortality with the nadir observed at 0 g/d and mean (CI) HR increased to 1·04, 95 % CI (1·00, 1·08) and 1·09, 95 % CI (1·04, 1·15) at 20 g/d and 40 g/d FS, respectively (Fig. 2(a)), with a standard serving containing 33 g FS. FS in milk-based drinks were dose-dependently and significantly related to all-cause mortality with the nadir detected at 4 g/d and mean (CI) HR increased to 1·19, 95 % CI (1·09, 1·30) at 20 g/d as compared with 4 g/d (Fig. 2(c)), with a standard serving containing 16 g FS. In contrast, FS in juice (Fig. 2(b)) and tea/coffee (Fig. 2(d)) were not significantly associated with all-cause mortality. These findings were robust in all sensitivity analyses with the following exceptions: The association with mortality was significant for juice if participants with unintentional weight loss were removed (online Supplementary Fig. 5(f)) and after adjustment for the diet quality score (online Supplementary Fig. 13(f)). The relation between FS in milk-based drinks and mortality did not remain statistically significant if only the first Oxford WebQ was considered (online Supplementary Fig. 11(g)). FS in tea/coffee were significantly associated with mortality if participants with unintentional weight loss (online Supplementary Fig. 5(h)) or with up to two completed Oxford WebQ (online Supplementary Fig. 10(h)) were removed.
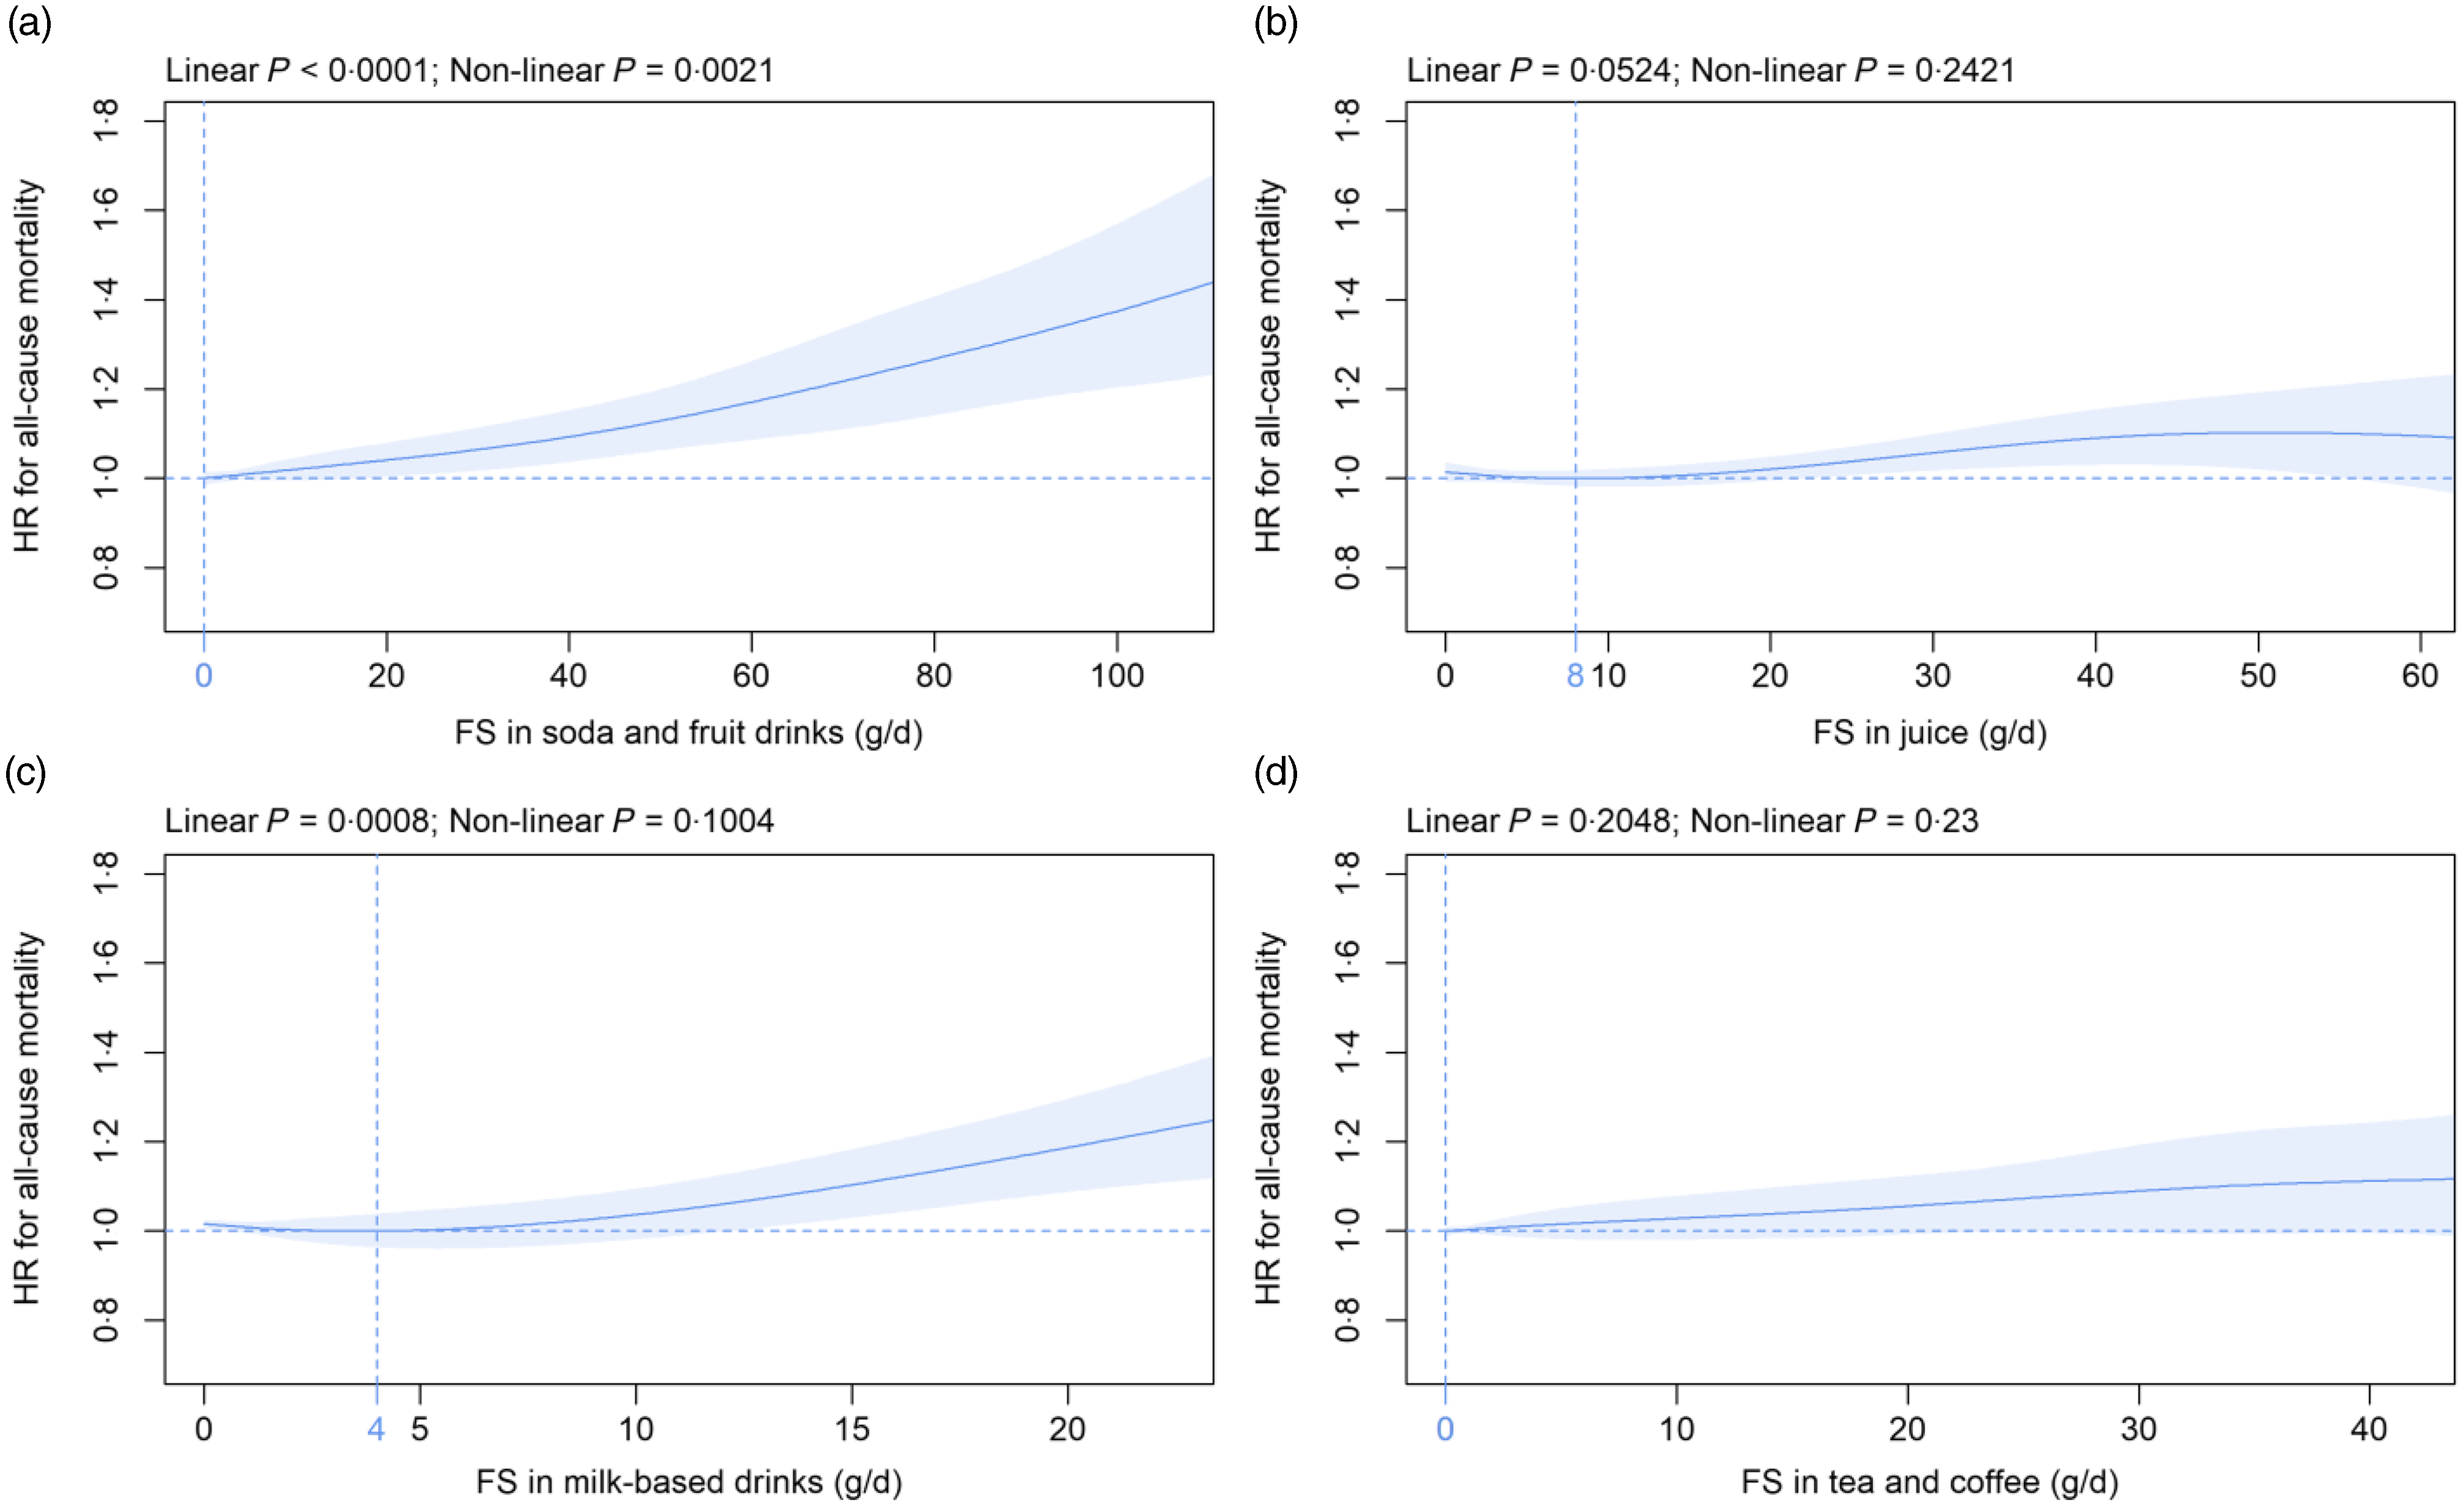
Fig. 2. Association of free sugars (FS) in (a) soda/fruit drinks, (b) juice, (c) milk-based drinks and (d) tea/coffee (all g/d) with all-cause mortality. Models are adjusted and presented as indicated in Fig. 1.
Free sugars in solids subtypes and all-cause mortality
Mean (sd) consumption of FS in solids subtypes was as follows: treats 24·3 (18·9), cereals 2·6 (3·8), toppings 6·4 (8·7) and sauces 1·4 (2·1) g/d (Table 2). Within solids subtypes, FS in treats were significantly associated with mortality in a non-linear fashion in the primary (Fig. 3(a)) and in five (online Supplementary Fig. 6i, 8i, 12i to 14i) of the eleven sensitivity analyses. In contrast, the FS in cereals, toppings and sauces were not significantly associated with all-cause mortality over the whole range of consumption in all analyses (Fig. 3(b), (c), (d) and online Supplementary Fig. 4(j), (k), (l) to 14(j), (k), (l)) except for FS in sauces if participants with at least one Oxford WebQ completed for a weekend day were removed (online Supplementary Fig. 8(l)).
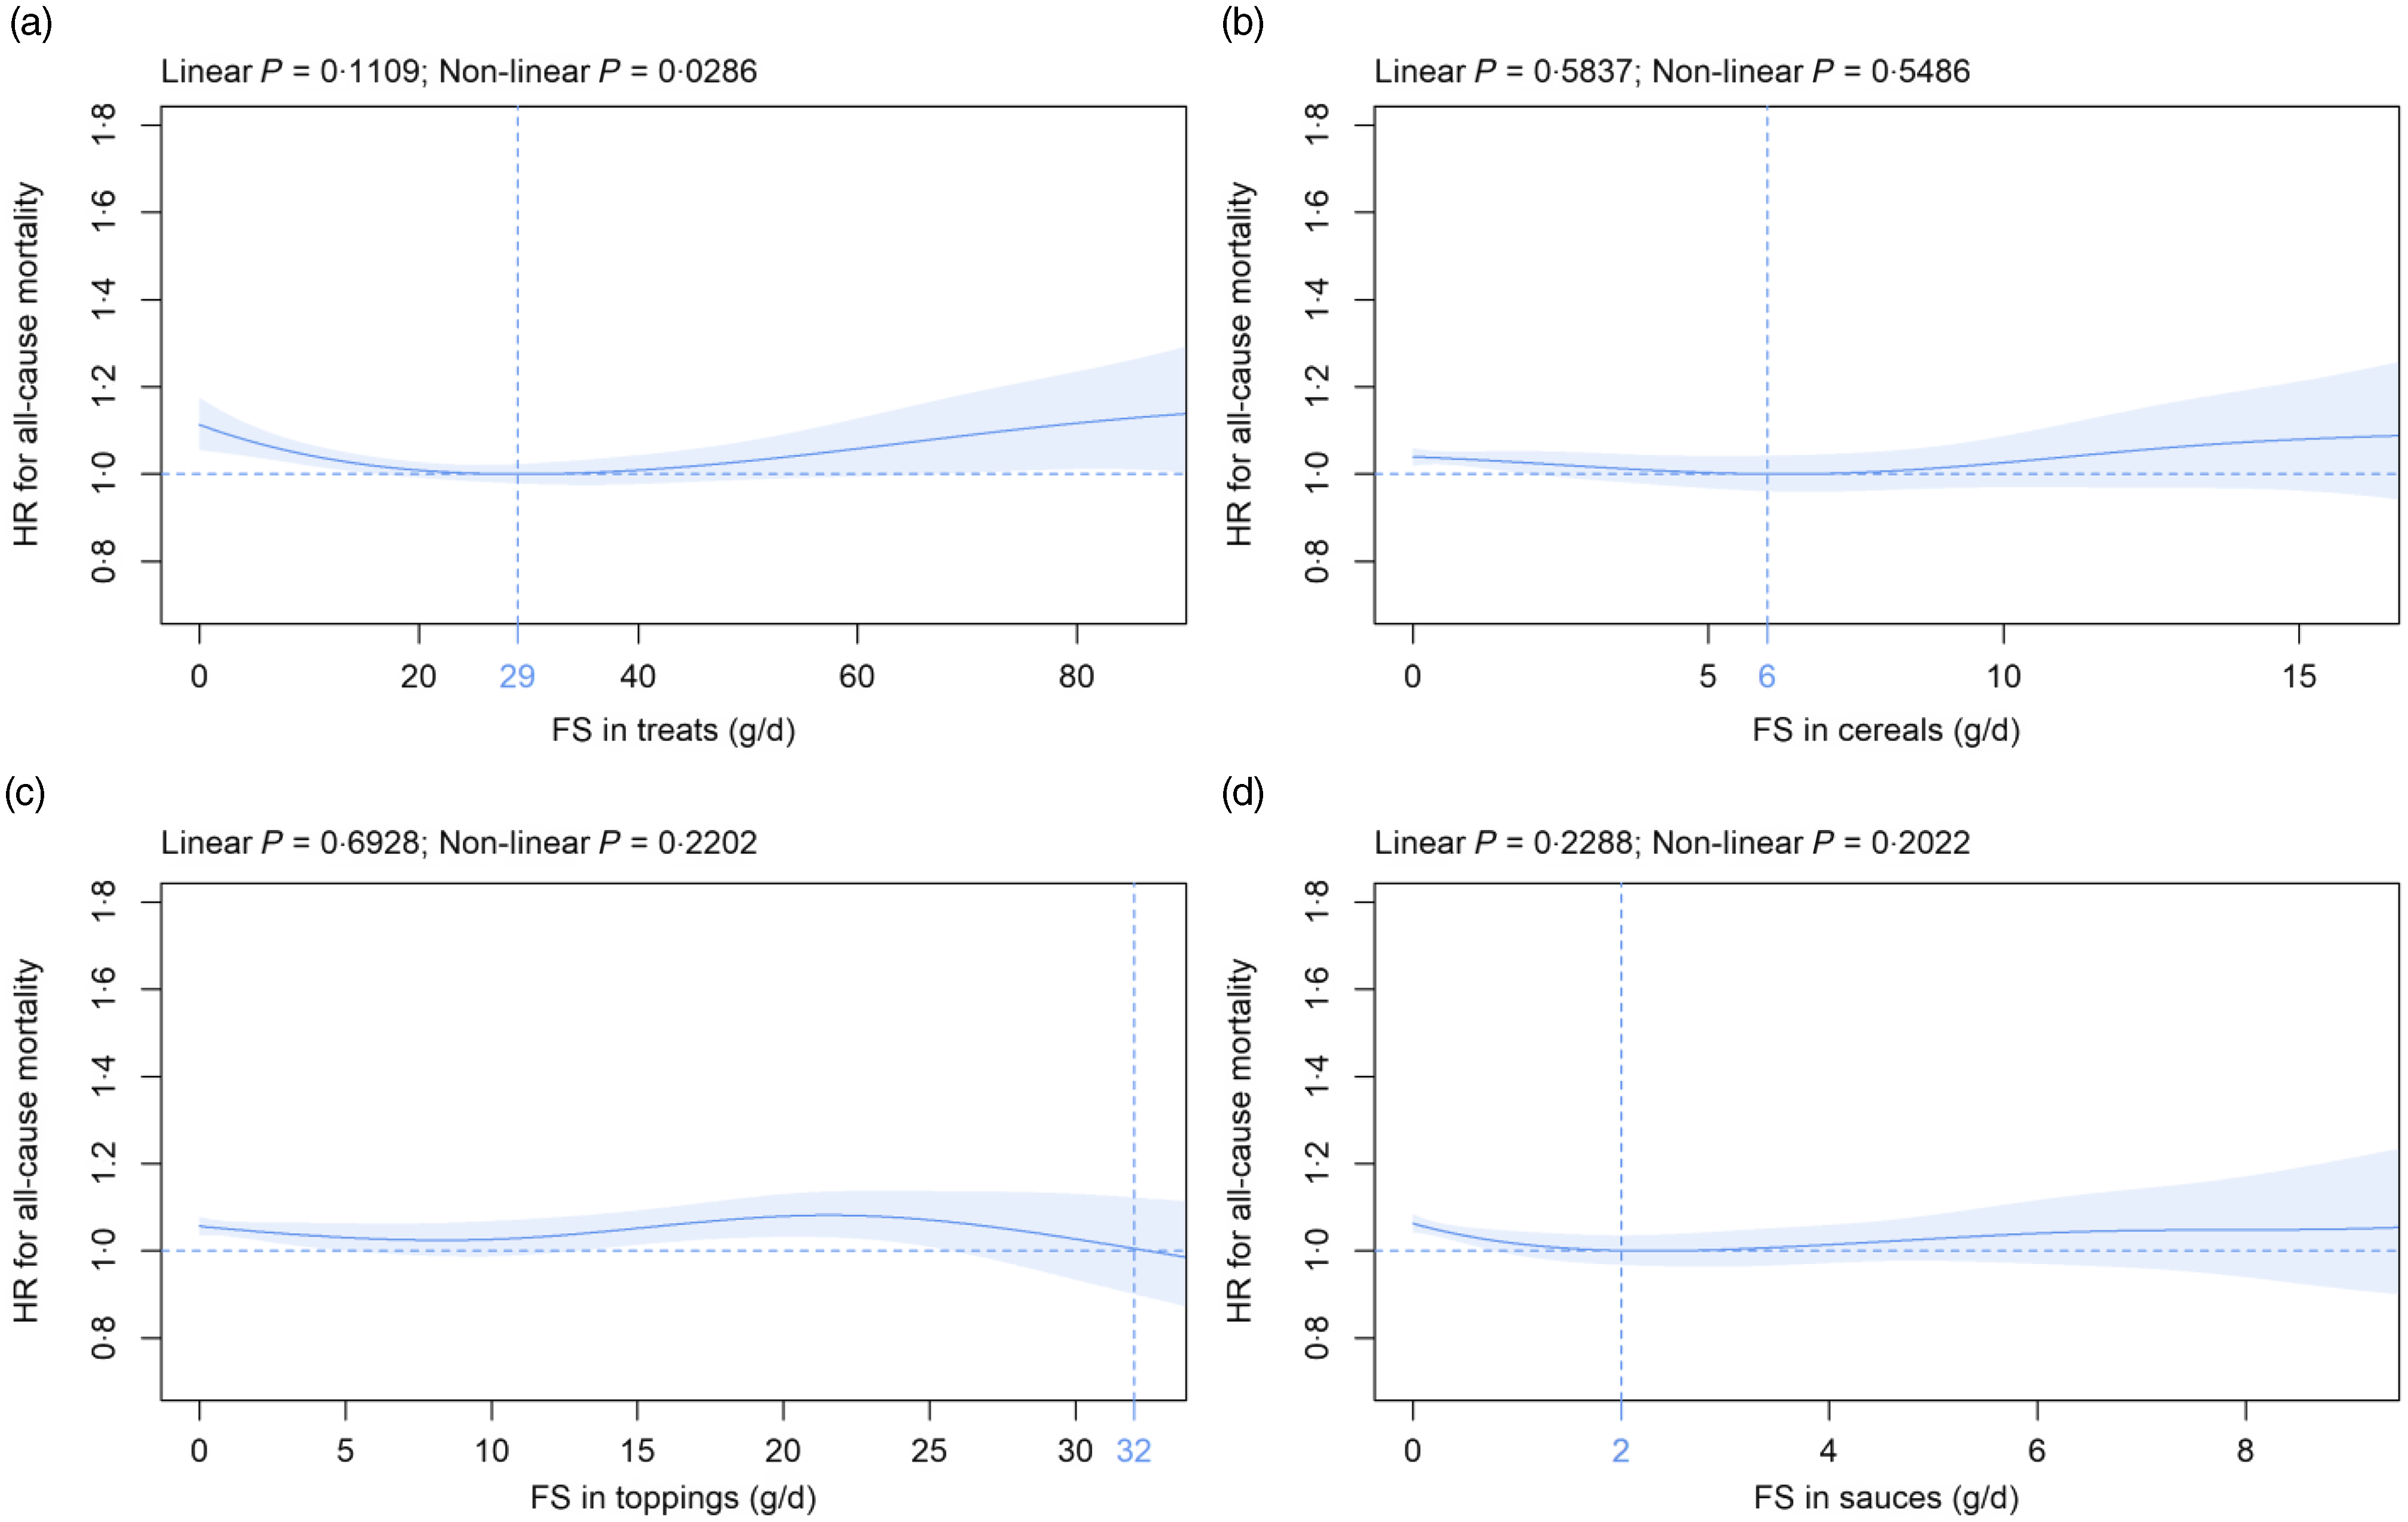
Fig. 3. Association of free sugars (FS) in (a) treats, (b) cereals, (c) toppings and (d) sauces (all g/d) with all-cause mortality. Models are adjusted and presented as indicated in Fig. 1.
Discussion
Principal findings
To the best of our knowledge, this is the first study that systematically assesses the association of FS from all relevant sources with all-cause mortality and some sugar sources are studied for the first time. Non-linear associations between FS subtypes and mortality are defined, whereas previous research has commonly focused on linear relations.
A significant dose-dependent association exists between FS consumption and all-cause mortality with mean FS intake of the UK Biobank population being beyond consumption levels recommended by the WHO(11) and the NHS England(12). In contrast, intrinsic sugars are not significantly related to all-cause mortality over the whole range of consumption although mean intake of FS and intrinsic sugars is comparable. FS in beverages are significantly associated with all-cause mortality. Within this category, FS in soda/fruit drinks and milk-based drinks are dose-dependently related to mortality, whereas no significant association is found for juice and tea/coffee. In contrast to beverages, FS in solids are not significantly linked to all-cause mortality and only for FS in treats a significant non-linear association is observed. All results are largely consistent in various sensitivity analyses except for FS in treats for which only five out of eleven sensitivity analyses show a significant relation with mortality. Our results highlight that associations between FS and all-cause mortality depend on FS source.
Comparison with other studies
FS intake of UK Biobank participants in the present analysis (median: 56·8 g/d) is higher as compared with representative data for the UK population from the National Diet and Nutrition Survey (median: 44·8 g/d)(Reference Amoutzopoulos, Steer and Roberts37). These findings support recent analyses that the UK Biobank cohort is not demographically representative of the general UK population(Reference Fry, Littlejohns and Sudlow38). However, differences in age distribution, i.e. 19 to 64 years in the study by Amoutzopoulos et al.(Reference Amoutzopoulos, Steer and Roberts37) as compared with 39 to 72 years in the present analysis might also contribute.
FS consumption and all-cause mortality are significantly and dose-dependently associated in our study with the nadir observed at 25 g/d. Few studies have assessed this association, and these have reported conflicting results(Reference Ramne, Alves Dias and González-Padilla13,Reference Nagata, Wada and Yamakawa14,Reference Tasevska, Park and Jiao39) . In accordance with the current findings, the fourth as compared with the first quartile of FS consumption is associated with a significantly increased risk for all-cause mortality in both women and men in a study from Japan(Reference Nagata, Wada and Yamakawa14). In contrast, a U-shaped association between FS intake and all-cause mortality is demonstrated in another study from Sweden with lowest risk of death observed in the 7·5 to <10 % energy from FS intake category(Reference Ramne, Alves Dias and González-Padilla13). Yet another study from the USA does not find any significant link between FS consumption and all-cause mortality in both sexes(Reference Tasevska, Park and Jiao39). Different proportions of FS subtypes in the respective studies might contribute to the conflicting findings.
To the best of our knowledge, the current study is the first to analyse the association of intrinsic sugars with all-cause mortality. In contrast to FS, intrinsic sugars are not significantly related to all-cause mortality. The majority of intrinsic sugars is incorporated within the structure of intact fruit and vegetables or is naturally present as lactose and galactose in milk(11). The present results support the recommendation by the WHO that intrinsic sugars and FS need to be distinguished since their physiological impact differs with FS but not intrinsic sugars showing adverse effects(11). Published studies have focused on food groups rich in intrinsic sugars, e.g. fruits, vegetables and dairy products, but not on the sugars they naturally contain. A dose-dependent negative association exists between fruit and vegetable consumption and all-cause mortality in a meta-analysis comprising ninety-five prospective studies(Reference Aune, Giovannucci and Boffetta40). A lower risk is seen for fruit and vegetable intake of up to 800 g/d with a 31 % reduction as compared with non-consumption(Reference Aune, Giovannucci and Boffetta40). For dairy products, no significant association with all-cause mortality is found in a meta-analysis of twenty-nine prospective studies(Reference Guo, Astrup and Lovegrove41). It remains to be elucidated whether intrinsic sugars per se are neutral concerning mortality or whether adverse effects of this sugar subtype are neutralised by other beneficial ingredients and/or the plant matrix found in intrinsic sugar-rich sources(Reference Qi and Tester42).
FS in beverages are dose-dependently associated with all-cause mortality in our report. Within this category, FS in soda/fruit drinks are related to mortality. Most published studies have assessed the association between sugar-sweetened beverage servings and mortality. Intake is significantly related to all-cause mortality in most(Reference Ramne, Alves Dias and González-Padilla13,Reference Anderson, Gray and Welsh36,Reference Malik, Li and Pan43–Reference Barrington and White46) but not all(Reference Odegaard, Koh and Yuan47,Reference Paganini-Hill, Kawas and Corrada48) studies. The definition of sugar-sweetened beverages is heterogeneous with juice being included(Reference Ramne, Alves Dias and González-Padilla13), excluded(Reference Malik, Li and Pan43,Reference Mullee, Romaguera and Pearson-Stuttard44,Reference Barrington and White46,Reference Paganini-Hill, Kawas and Corrada48) or analysed separately(Reference Anderson, Gray and Welsh36,Reference Collin, Judd and Safford45,Reference Odegaard, Koh and Yuan47) in different studies. This is of importance since FS in juice are not significantly associated with all-cause mortality in the present analysis, although mean FS intake from soda/fruit drinks and juice is comparable. The current results regarding FS in soda/fruit drinks v. juice are in accordance with recent data from Anderson and co-workers who also assessed UK Biobank data using a different approach(Reference Anderson, Gray and Welsh36). The authors demonstrate convincingly that HR for mortality is increased for sugar-sweetened beverages but not for juice if >2 servings/d are compared with non-consumption(Reference Anderson, Gray and Welsh36). To the best of our knowledge, the current study is the first to suggest a positive link between FS in milk-based drinks and all-cause mortality. These results indicate that sugary milk drinks might have adverse effects on mortality similar to the well-established impact of soda/fruit drinks. It is important to note in this context that milk-based drinks are not liable for the Soft Drinks Industry Levy in the UK, i.e. the ‘sugar tax’(49) despite showing a similar association with all-cause mortality in the present study as compared with FS from soda/fruit drinks. It remains to be elucidated why FS in tea/coffee are not significantly associated with mortality in contrast to FS in soda/fruit drinks and milk-based drinks. It is interesting to note in this context that our group has recently demonstrated that tea and to a lesser extent coffee consumption are negatively related to all-cause mortality in UK Biobank participants(Reference Schaefer, Kaiser and Behrendt32). Therefore, it is well possible that adverse effects of FS concerning mortality are somewhat blunted by positive health effects of tea/coffee intake. Alternatively or in addition, there might be some residual confounding despite adjustment for multiple covariates and various sensitivity analyses performed in the current study, i.e. tea/coffee drinkers might be different from consumers of soda/fruit drinks and milk-based drinks. Furthermore, it needs to be pointed out that mean intake of FS from tea/coffee is much lower in UK Biobank participants as compared with FS from soda/fruit drinks and juice. The effect of adding sugar to tea/coffee has been a somewhat neglected research subject so far despite its relevance in everyday life. Thus, no prospective study exists defining the association between sugars in tea/coffee and mortality, as well as morbidity. Three independent studies using a cross-sectional design have yielded conflicting results with sugar added to tea/coffee being positively(Reference O’Connor, Imamura and Brage50), negatively(Reference Gyntelberg, Hein and Suadicani51) or not(Reference Bouchard, Ross and Janssen52) linked to adverse metabolic parameters.
While FS in beverages are positively associated with HR for all-cause mortality, we observe no link for FS in solids. To the best of our knowledge, only one study to date has analysed the relation between FS in solids and mortality risk(Reference Tasevska, Park and Jiao39). Using a different approach, the highest as compared with the lowest quintile of added sugars in solids intake is associated with a significantly decreased mortality risk in both women and men(Reference Tasevska, Park and Jiao39). Combined, the current study and the results by Tasevska and co-workers(Reference Tasevska, Park and Jiao39) suggest that FS in solids are not linked to an increased all-cause mortality risk. Within solids subtypes, FS in treats are associated with all-cause mortality in a non-linear fashion, and the nadir is observed at 29 g/d in the current analysis. However, these results remain statistically significant in only about half of the sensitivity analyses. It is interesting to note in this context that servings of treats are significantly and inversely related to all-cause mortality in an independent report(Reference Ramne, Alves Dias and González-Padilla13). The authors speculate that consumption of treats is positively linked to social interactions, e.g. breaks at work with coffee and pastries(Reference Ramne, Alves Dias and González-Padilla13). Therefore, lower intake might be related to fewer social connections, which, in turn, is associated with higher mortality(Reference Ramne, Alves Dias and González-Padilla13). All other FS in solids subtypes are not significantly related to mortality in the present analysis. For toppings, a trend toward an inverse relation has been demonstrated recently(Reference Ramne, Alves Dias and González-Padilla13). To the best of our knowledge, no study so far has assessed the association between FS in cereals and sauces with all-cause mortality.
Together, these data suggest that FS from beverages and solids might show distinct physiological effects and that FS from solids are not linked with all-cause mortality. It is interesting to note in this context that significant differences concerning subjective feelings of hunger, fullness and satiety can be observed between liquid and solid carbohydrate foods despite similar effects on glycaemic and insulin responses(Reference Ranawana and Henry53).
Several potential mechanisms by which FS increase mortality exist. Thus, high FS intake might cause metabolic and CVD via induction of oxidative stress(Reference Prasad and Dhar54) and proinflammatory cytokines like tumor necrosis factor α (Reference Gonzalez, Herrera and Soldevila55), as well as by displacing nutritionally superior foods, stimulation of insulin resistance and damaging the intestine with concomitantly decreased nutrient absorption(Reference DiNicolantonio and Berger56).
Strengths and limitations of this study
Strengths of the current study include a large sample size, the prospective cohort design, thorough characterisation of participants, mean follow-up >12 years, a wide range of sugar subtype intake, as well as analyses with penalised cubic splines to allow non-linear predictor effects. Limitations include residual confounding, as well as measurement errors in the assessment of the exposure variables and potential confounders. All consumption data have not been independently assessed but self-reported. In addition, about 38 % and 61 % of participants have completed only one and up to two Oxford WebQ, respectively, which might limit representativity of data(Reference Greenwood, Hardie and Frost24). However, all major findings concerning the association of FS subtype consumption with mortality are similar in sensitivity analyses in participants with at least two and three Oxford WebQ questionnaires filled out, respectively. Furthermore, the intake of FS from other solid foods than treats, i.e. cereals, toppings and sauces, is rather low and might contribute to the non-significant results observed. In addition, participants could choose ‘varied’ for sugar added to tea/coffee, and ‘varied’ was set to one teaspoon in the present analysis since this was the portion size most commonly chosen by all participants. Furthermore, standard portion sizes are used in the current study, but the real portion sizes consumed might vary between individuals especially for solid foods. Moreover, a ‘healthy volunteer’ selection bias is possible since the cohort is not demographically representative of the general UK population(Reference Fry, Littlejohns and Sudlow38). However, a representative population is not required to define exposure–disease relationships(Reference Fry, Littlejohns and Sudlow38).
Conclusions
FS but not intrinsic sugars are associated with all-cause mortality. Furthermore, FS in beverages are significantly and dose dependently related to mortality, whereas no association is found for FS in solids. Within beverages, a significant dose-dependent association with mortality is detected for FS in soda/fruit drinks and milk-based drinks, while no significant association is found for FS in juice and tea/coffee. Interventions targeting FS subtypes might be most effective concerning mortality if focused on the reduction of soda/fruit drinks and milk-based sugary drinks; however, the present results need to be confirmed by independent studies. Further prospective studies on sugar subtype intake in relation to morbidity from metabolic and CVD, as well as cancer, are necessary to provide even more definitive conclusions.
Acknowledgements
This research has been conducted using the UK Biobank resource under application number 53438.
This work was supported by the Deutsche Forschungsgemeinschaft (DFG) (SFB 1052/2 C6) and the Deutsche Diabetes Stiftung to MF. The funders had no role in the design of the study; collection, management, analysis and interpretation of the data and preparation, review or approval of this manuscript.
A. K., S. M. S. and M. F. designed the research, had access to the data and wrote the first draft; A. K. and S. M. S. had primary responsibility for final content and controlled the decision to publish; A. K., S. M. S., I. B., G. E. and M. F. performed the statistical analyses, analysed the data, read, redacted and approved the final manuscript. The corresponding author attests that all listed authors meet authorship criteria and that no others meeting the criteria have been omitted.
There are no conflicts of interest.
Supplementary material
For supplementary material/s referred to in this article, please visit https://doi.org/10.1017/S0007114522003233


 Open access