


With the rapid economic development and changing lifestyles, CVD remains the leading cause of human death worldwide(Reference Roth, Johnson and Abajobir1). Previous prospective studies indicate that dyslipidaemia is an independent and variable main risk factor for CVD, and effectively controlling blood lipid levels can reduce CVD risk(Reference Lee, Chang and Zhang2–Reference Farzadfar, Finucane and Danaei4). Therefore, monitoring and controlling blood lipid levels and risk factors are equally important for reducing CVD risk. In 2019, the number of Chinese rural population is 551·62 million (39·40 %). The overall and rural areas prevalence rates of dyslipidaemia in Chinese adults are 34·0 and 26·3 %, respectively(Reference Pan, Yang and Wu5). Although the blood lipid levels and the prevalence of dyslipidaemia in Chinese adults are lower than those in many developed countries, insufficient awareness, treatment and control of dyslipidaemia are common, especially in rural areas with low economic conditions and deficient healthcare systems(Reference Zhao, Zhang and You6).
Dyslipidaemia can be treated and improved through medical intervention and lifestyle changes, such as a healthy diet, physical activity, refraining from drinking and smoking(Reference Zachariah, Chan and Mendelson7,Reference Xu, Wang and Ware8) . Compared with single nutrient intake, general dietary pattern may create a comprehensive reflection on the food intake of the population and provide more effective measures for the intervention of dyslipidaemia(Reference Hu9). An improvement in the dietary pattern is one of the practical and more manageable methods to prevent and control dyslipidaemia and CVD in addition to medical methods(Reference Ravera, Carubelli and Sciatti10). Previous studies have shown that dietary behaviour changes might positively affect dyslipidaemia(Reference Yokoyama, Levin and Barnard11,Reference Siri-Tarino and Krauss12) . Therefore, the investigation of dietary patterns is vital to prevent and control dyslipidaemia.
Previous studies have shown a correlation between dietary patterns and dyslipidaemia; for example, among Brazilian adults, processed food patterns are positively correlated with LDL-cholesterol, HDL-cholesterol and total cholesterol (TC) levels in men(Reference Olinto, Gigante and Horta13); in Spanish people aged 40–55 years, the Mediterranean diet pattern characterised by a large intake of vegetables, fruits, whole grains, fish, beans, nuts and olive oil is positively correlated with HDL-cholesterol(Reference Penalvo, Oliva and Sotos-Prieto14). There are many studies on the relationship between diseases and dietary patterns obtained by principal component analysis and factor analysis. However, there are few studies on the association between dyslipidaemia and diet patterns obtained by the reduced rank regression (RRR) analysis to our knowledge. RRR extracts specific dietary patterns by establishing linear functions between dependent variables (disease-related biomarkers) and independent variables (food intake)(Reference Devlin, McNulty and Nugent15). Since the dependent variable is related to the occurrence and development of the disease, the dietary pattern obtained by RRR can better explain the role of diet in disease.
Obesity, especially visceral fat accumulation obesity, is closely associated with dyslipidaemia and other metabolic disorders. Studies have shown that atherosclerotic dyslipidaemia is related to visceral fat tissue, but not subcutaneous fat tissue, BMI and waist circumference(Reference Qing, Wei and Chan16–Reference Fox, Massaro and Hoffmann19). Therefore, the present study used the RRR (with visceral fat index (VFI) as a dependent variable) to determine the dietary pattern of abdominal obesity in rural adults in Henan, China, further explore its association with dyslipidaemia and provide dietary evidence to prevent dyslipidaemia.
Materials and methods
Study population
The study population was derived from the Henan Rural Cohort study(Reference Liu, Mao and Li20). A total of 39 259 people aged 18–79 years completed this study in the Henan Province of China from July 2015 to October 2017. After excluding those who: (1) did not provide complete information in the FFQ (n 9303) and (2) had missing data about the lipid index including TC, TAG, HDL-cholesterol and LDL-cholesterol (n 196), VFI (n 328), BMI (n 128) and waist circumference (n 82), finally 29 538 participants were recruited. The study protocol was approved by the Life Science Ethics Committee of Zhengzhou University (Code: (2015) MEC (s128)). The study protocol conformed to the guidelines of the 1964 Helsinki Declaration. All the participants signed an informed consent form.
Data collection
Standardised questionnaires were used to collect socio-demographic data by trained investigators through face-to-face interviews, including age, sex, marital status, educational level, per capita monthly income, physical activity level, smoking and drinking status, family history of dyslipidaemia, etc. Marital status was categorised as married/cohabiting and widowed/divorced/single. Educational levels were categorised into three groups: ‘illiterate and primary school, middle school, high school, and above’. Per capita monthly income was calculated by total household income and family size and categorised into three groups and expressed in Ren Min Bi: <1000, 1000–2999, and ≥ 3000. Smoking was defined as smoking at least one cigarette/d for six consecutive months and categorised into never, ever and current. Drinking was defined as drinking at least 12 times a year and categorised into never, ever and current. According to the validated(Reference Liu, Mao and Li20) International Sports Activity Questionnaire, physical activity level was categorised into low, medium and high levels. The family history of dyslipidaemia was defined as at least one of the parents, siblings or offspring with the disease.
The validated FFQ(Reference Xue, Yang and Wang21) was used to collect the participants’ food intake data in the past 12 months. The questionnaire included questions on staple food (rice, refined flour and their products), red meat (pork, beef, lamb, etc.), white meat (chicken, duck, goose, etc.), fish (fish and its products), eggs (chicken and duck eggs, etc.), milk and dairy products, fresh fruits, vegetables, beans and its products, nuts and peanuts (melon seeds, peanut, walnuts, etc.), pickles, grains (maize, oats, sorghum, sweet potatoes, etc.) and animal oil (lard, mutton, butter, etc.). The food frequencies and amounts were obtained by participants’ answers to the question ‘how often and how much do you eat each time?’ The frequency of food consumption was categorised into never, daily, weekly, monthly and yearly. Meanwhile, ‘jin’ (one jin equals 500 g) and ‘liang’ (one liang equals 50 g) were used to assess food intake to make it more convenient for rural residents. We provided a card with samples of a standard portion of each food group relevant for typical diets during the investigation.
The height and weight were measured by conventional measurement methods, using a tape measure for the waist and hip circumferences. The average value was taken after measuring twice by trained investigators. The bioimpedance body fat rate tester (OMRON V. BOY HBY-371) was used to evaluate VFI, BMI, etc. VFI was assessed by Omron bioelectrical impedance analysis. The basic working principle of the bioelectrical impedance analysis was Ohm’s law. Venous blood samples were collected for routine blood tests (XS-500i, SYSMEX) and biochemical indexes (Cobas c501, Roche) that included TC, TAG, HDL-cholesterol, LDL-cholesterol and the like after at least 8 h of overnight fasting. In addition, a random sub-sample (10 %) of participants was repeated to provide an estimate of reliability(Reference Liu, Mao and Li20).
Definition of dyslipidaemia
Dyslipidaemia has been defined as at least more than one of the following indicators: TC ≥ 6·2 mmol/l, TAG ≥ 2·3 mmol/l, LDL-cholesterol ≥ 4·1 mmol/l, HDL-cholesterol < 1 mmol/l and non-HDL-cholesterol ≥ 4·9 mmol/l, according to the ‘Guidelines for the Prevention and Treatment of Dyslipidemia in Chinese Adults (2016 Revised Edition)’(22). Simultaneously, dyslipidaemia has been classified as follows: (1) hypercholesterolaemia (TC ≥ 6·2 mmol/l); (2) hypertriacylglycerolaemia (TAG ≥ 2·3 mmol/l); (3) mixed hyperlipidaemia (TC ≥ 6·2 and TAG ≥ 2·3 mmol/l); (4) low HDL-cholesterol hyperlipidaemia (HDL-cholesterol < 1 mmol/l); (5) high LDL-cholesterol hyperlipidaemia (LDL-cholesterol ≥ 4·1 mmol/l); and (6) non-HDL-cholesterol hyperlipidaemia (non-HDL-cholesterol ≥ 4·9 mmol/l).
Definition of dietary pattern in abdominal obesity
The dietary pattern in abdominal obesity was obtained by the RRR method(Reference Hu9), which collected two aspects of information: one was the food intake as the independent variable, and the other was the index related to abdominal obesity (VFI(Reference Fang, Berg and Cheng23)) as the response variable. Therefore, the RRR method can be used to obtain the dietary pattern most relevant to this condition. A possible approach to reduce the data dependency of the pattern variables is to construct simplified dietary patterns by omitting food groups with low score coefficients and ignoring the weights of the remaining food groups. Moreover, simplified patterns are easier to interpret than patterns including all food groups(Reference Hoffmann, Schulze and Schienkiewitz24). Therefore, we excluded pickles that were consumed less while using RRR to analyse the dietary pattern. The independent variables included a total of twelve food groups: staple food, red meat, white meat, fish, eggs, milk and products, fruits, vegetables, bean and products, nuts, grains and animal oils.
Data analysis
Continuous data were presented as mean values and standard deviation or median and quartile, and the differences between groups were compared by t-test or Kruskal–Wallis test. Categorical data were presented as number (percentage), and the differences between the groups were analysed by the χ 2 test. The non-normally distributed dietary intake was Z-transformed. The dietary pattern scores were calculated by the RRR method; the higher the score, the higher the conformity to the dietary pattern. The subjects were assigned to four groups according to the quartile of the dietary pattern score. The RRR method was realised by the PLS process of SAS software (method = RRR)(Reference Hoffmann, Schulze and Schienkiewitz24), where the independent variable was dietary intake by Z-transform, and the dependent variable was VFI. Therefore, the resulting dietary pattern was named the abdominal obesity dietary pattern.
The logistic regression analysis was applied to estimate the association between dietary patterns and the risk of dyslipidaemia. OR and 95 % CI of dyslipidaemia in quartile and continuous data were reported in separate models. A restricted cubic spline was applied to explore the dose–response relationship between continuous dietary pattern scores and dyslipidaemia, with three knots located at the 25rd, 50th and 75th percentiles of dietary pattern scores according to the distribution. Meanwhile, approaches for mediation analyses with dichotomous outcomes were applied to determine whether VFI mediated the association between dietary patterns and disease outcomes. Notably, there was no contradictory for VFI between RRR and mediating effect analysis. Mediation analysis was applied by running the PROCESS for SPSS as previously introduced elsewhere(Reference Seligowski, Kaiser and Niles25). All the statistical analyses were performed using SPSS 21.0 and SAS 9.1 statistical software. Two-tailed P-values < 0·05 were considered statistically significant.
Results
Characteristics of participants
Of the 29 538 participants (11 987 males and 17 551 females), 10 092 participants had dyslipidaemia, and the crude prevalence of dyslipidaemia was 34·2 % (35·3 % in males and 33·4 % in females). The mean age of the subject was 55·4 years old. The number of patients with hypertriacylglycerolaemia, hypercholesterolaemia, mixed hyperlipidaemia, low HDL-cholesterol hyperlipidaemia, high LDL-cholesterol hyperlipidaemia and non-HDL-cholesterol hyperlipidaemia was 5494 (18·6 %), 2824 (9·6 %), 984 (3·3 %), 4323 (14·6 %), 2328 (7·9 %) and 2580 (8·7 %), respectively.
Participants with dyslipidaemia were older, of lower physical activity and more likely to smoke and drink. Besides, dyslipidaemia patients exhibited higher BMI, VFI, waist circumference, TC, TAG, LDL-cholesterol and non-HDL-cholesterol (Table 1).
Table 1. Characteristics of the participants according to the grouping
(Numbers and percentages; mean values and standard deviations)
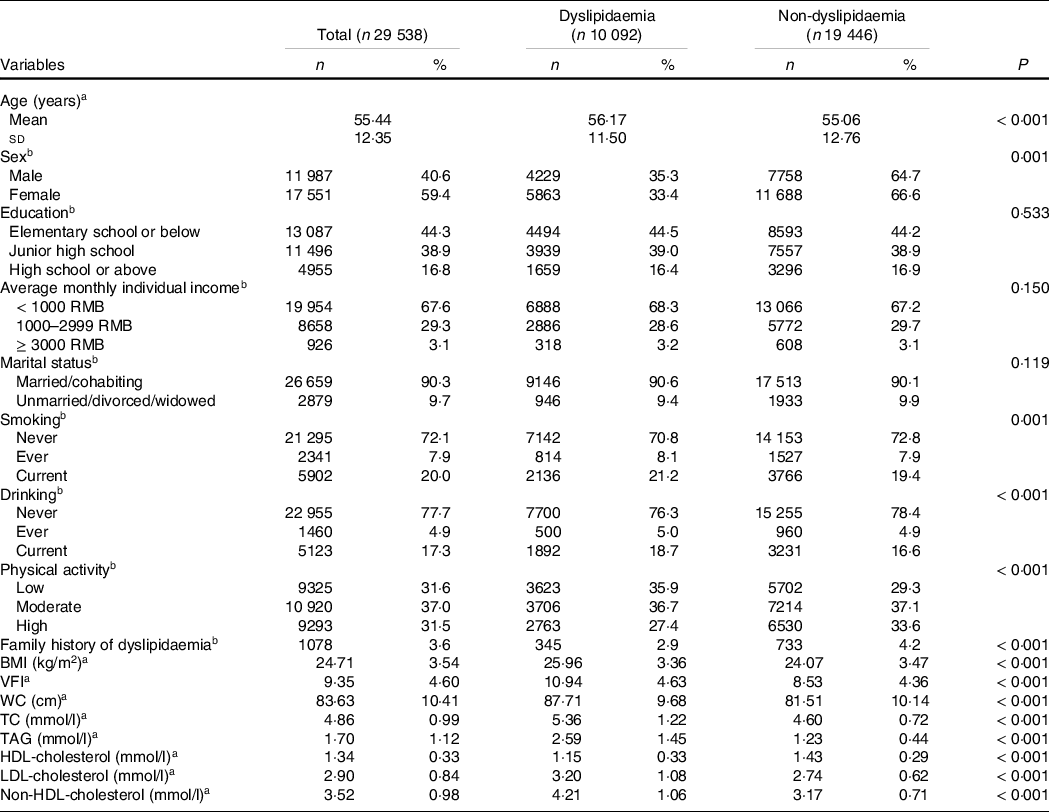
WC, waist circumference; TC, total cholesterol
a Continuous data are presented as mean and standard deviation and using t-test assessed the P value.
b Categorical data are presented as number and percentage, and using χ 2 test.
Definition of abdominal obesity dietary patterns
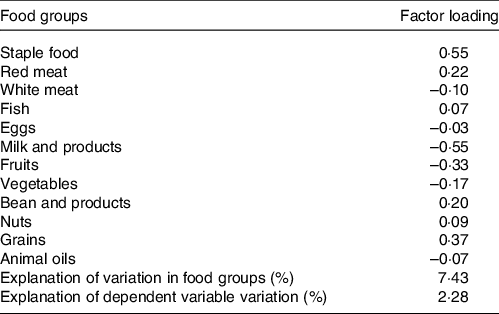
The abdominal obesity dietary pattern was obtained by the RRR method, which best explained the dietary pattern (explanation of variations in food groups: 7·43 %, explanation of the dependent variable variation: 2·28 %). The abdominal obesity dietary pattern was characterised by high consumption of staple food, red meat, fish, beans, nuts and grains, with a low intake of dairy products, fresh fruits and fresh vegetables, as shown in Table 2. Meanwhile, the quartiles of dietary pattern score were as follows: Q1: < −0·57, Q2: −0·57∼0·2, Q3: 0·2∼0·61 and Q4: ≥ 0·61. The food consumption of each group was shown in online Supplementary Table S1.
Table 2. Factor-loading matrix for the abdominal obesity dietary patterns and food groups
Relationship between abdominal obesity dietary patterns and dyslipidaemia
Table 3 shows an association between abdominal obesity dietary patterns and dyslipidaemia. Through logistic regression, we found that the highest quartile (Q4) of the dietary pattern was significantly associated with an increased risk of dyslipidaemia (OR: 1·178, 95 % CI 1·101, 1·261, P trend < 0·001) compared with the lowest quintile (Q1), in an unadjusted model. After full adjustment, the risk increased and remained significant (OR: 1·328, 95 % CI 1·228, 1·437, P trend < 0·001). Moreover, the prevalence of dyslipidaemia increased with an increase in dietary pattern score (P < 0·001) (online Supplementary Fig. S1). The relationship between abdominal obesity dietary patterns and subgroups of dyslipidaemia was shown in online Supplementary Table S2.
Table 3. The relationship between abdominal obesity dietary patterns and dyslipidaemia (Odds ratios and 95 % confidence intervals)
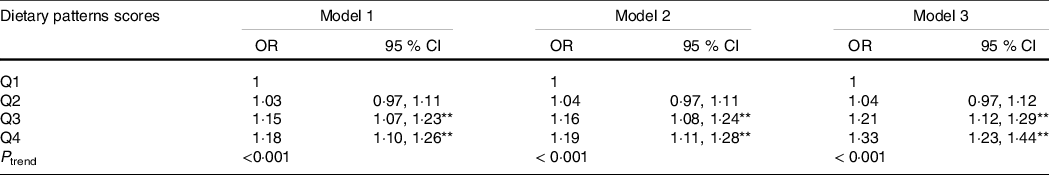
** P < 0 01.
The relationship between abdominal obesity dietary patterns and dyslipidaemia was analysed using logistic regression model.
The dietary patterns scores were divided into quartiles: Q1, Q2, Q3, Q4.
Model 1: no adjustment.
Model 2: adjusted for age, sex, education, marital status, per capita monthly income, smoking and drinking status, physical activity and family history of dyslipidaemia.
Model 3: adjusted for energy based on model 2.
The dose–response relationship between abdominal obesity dietary patterns and dyslipidaemia
The restricted cubic spline chart (Fig. 1(a)) showed no statistically significant non-linear dose–response association between the dietary pattern score and the risk of dyslipidaemia without adjusted confounding factors (P overall-association < 0·001, but P non-lin-association = 0·444). After adjusting for age, sex, educational level, marital status, per capita monthly income, smoking and drinking status, physical activity, family history of dyslipidaemia and energy, there was a non-linear dose–response relationship between the dietary pattern score and the risk of dyslipidaemia (P overall-association < 0·001, but P non-lin-association = 0·022) (Fig. 1(b)). Fig. 1 suggests that the higher the dietary pattern score, the higher the risk of dyslipidaemia.
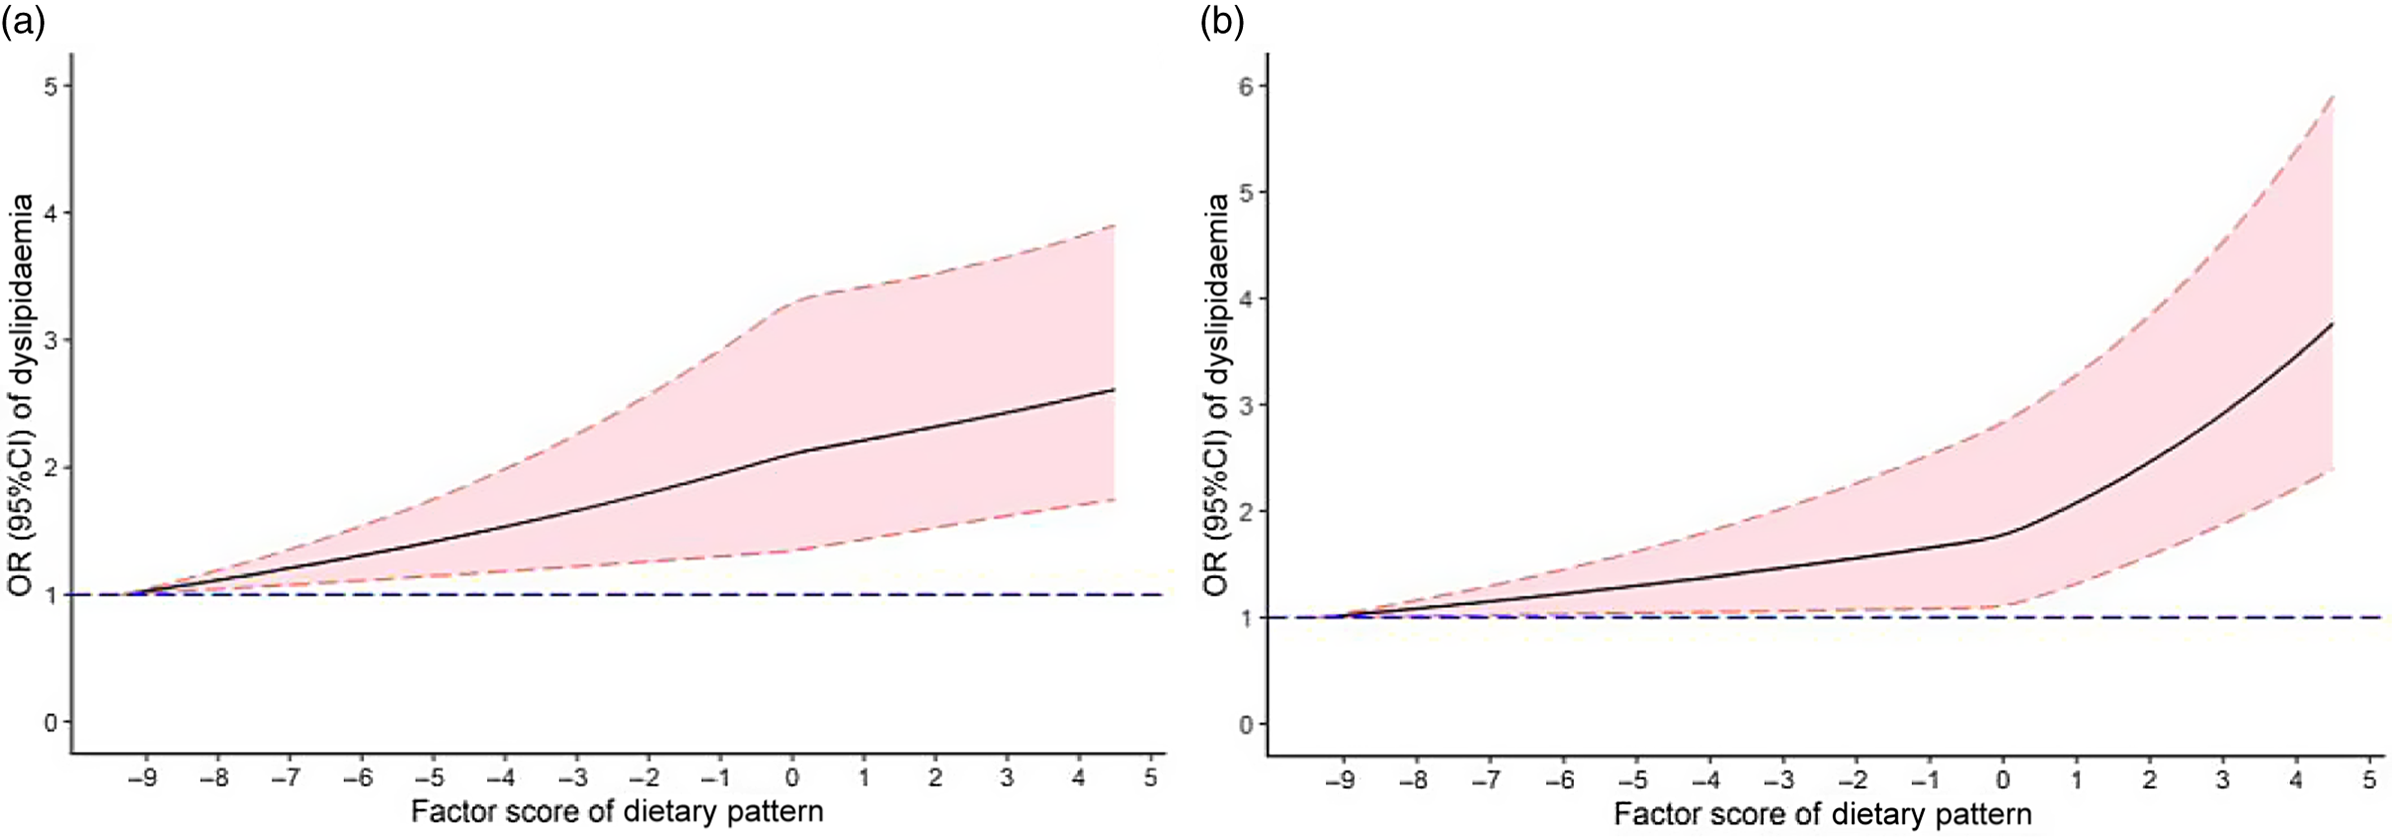
Fig. 1. OR (solid lines) and 95 % CI (dashed lines) of abdominal obesity dietary pattern scores for dyslipidaemia and visceral fat index (VFI) from restricted cubic splines. Wherein the figure (a) was non-adjusted models. A fully adjusted model (b) included age, sex, education, average monthly individual income, physical activity, smoking, drinking, family history of dyslipidaemia and energy intake.
Mediation effects
Fig. 2 presents the results of the mediation analysis protocol. After adjusting the confounding factors, such as age, sex, educational level, marital status, per capita monthly income, smoking and drinking status, physical activity, family history of dyslipidaemia and energy intake, the total effect of abdominal obesity dietary pattern on dyslipidaemia was significant (OR: 1·131, 95 % CI 1·096, 1·166, P < 0·001), and the direct effect of dietary patterns on dyslipidaemia was significant (OR: 1·064, 95 % CI 1·031, 1·098, P < 0·001); besides, the indirect effect partially mediated by VFI was also significant (OR: 1·068, 95 % CI 1·058, 1·077). VIF explained approximately 53·3 % of the odds of dyslipidaemia related to the dietary pattern, which suggests that the increased scores of dietary pattern might induce abdominal obesity, contributing to dyslipidaemia.
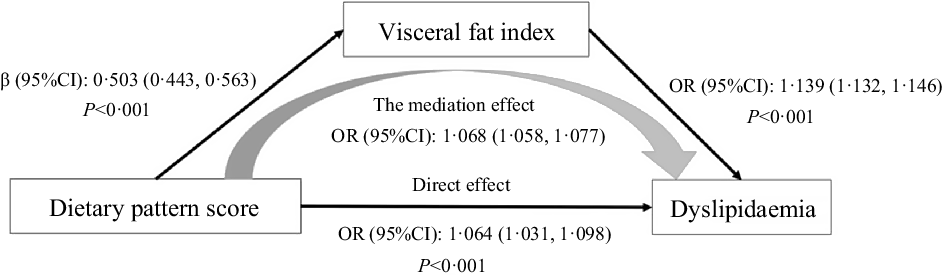
Fig. 2. Results of regressions conducted to test for mediation effects.
Discussion
Dyslipidaemia is an important risk of CVD, improving the abnormal fluctuation of the blood lipid level is a major focus of prevention and treatment of CVD(Reference Grundy, Stone and Bailey26). In addition, studies(Reference Li, Hruby and Bernstein27) have shown that unhealthy eating habits will increase the risk of dyslipidaemia, such as excessive intake of refined carbohydrates, sugars, saturated fats and trans fats. Diet intervention for the prevention and treatment of dyslipidaemia provides an effective way(Reference Grundy, Stone and Bailey26), and the establishment and analysis of dietary patterns is one way to understand the structure of the food for specific groups. Therefore, this study used the Henan Rural Health Cohort Study as the research population to explore the correlation between dietary patterns in abdominal obesity and dyslipidaemia. A total of 29 538 subjects were included; the crude prevalence rate of dyslipidaemia was 35·27 % for men and 33·41 % for women, consistent with a study on the epidemiological characteristics of adults’ dyslipidaemia in nine provinces and cities in China: the prevalence rate of dyslipidaemia was 39·91 %. In addition, the rates for men, women and rural populations were 51·11, 31·06 and 38·72 %, respectively(Reference Jing Dai and Yunjuan28). The present study results were slightly different from other studies because of the differences in the economic development and sanitation environment in different regions.
The dietary patterns in abdominal obesity in the present study were characterised by high carbohydrate intake derived from staple foods and whole grains and low intake of fresh fruits, vegetables, milk, white meat and eggs, similar to the unhealthy dietary patterns named ‘western’ dietary patterns characterised by high consumption of red or processed meat and refined grains, and low intake of fruits and vegetables(Reference Paterson, Neville and Silvestri29,Reference Lin, Fung and Hu30) . Fresh fruits and vegetables have been recommended as beneficial food items in various guidelines to prevent and control chronic diseases(Reference Grundy, Stone and Bailey26,Reference Aune31) because they are rich in cellulose and nutrients, such as Mg, Fe, folic acid, vitamins C and E, n-6 PUFA and antioxidants while lacking in cholesterol, total fat and SFA(Reference Li32). Epidemiological studies have established a relationship between the intake of eggs and a decrease in various abnormal metabolic indexes in women with the metabolic syndrome(Reference Shin, Lee and Kim33), indicating that a diet that restricts daily whole egg intake and moderate carbohydrates might further improve the atherosclerotic lipoprotein profile(Reference Blesso, Andersen and Barona34). Studies from Spain have shown that cheese and yogurt might increase the risk of abdominal obesity, with a negative correlation between liquid milk and the metabolic syndrome-related indicators, including TAG(Reference Beydoun, Fanelli-Kuczmarski and Beydoun35). Dietary interventions with white meat-like chicken were associated with a significant decrease in average plasma TC levels and LDL-cholesterol levels(Reference Scott, Dunn and Pownall36). It should be noted that fish had a higher factor loading result in our study; we speculated that the reason might be that Chinese rural people prefer to preserve food by frying. Fried products have a high fat content due to the frying process and oil uptake. Frequent consumption of fried foods, especially fried chicken and fried fish/shellfish, was associated with a higher risk of all cause and cardiovascular mortality(Reference Sun, Liu and Snetselaar37). The food structure of the abdominal obesity diet pattern in the present study was consistent with previous research.
This abdominal obesity dietary pattern as a high carbohydrate dietary pattern was consistent with previous studies: the higher the score of this dietary pattern, the higher the risk of abdominal obesity(Reference Zhang, Wang and Wang38,Reference Kim, Lee and Jung39) . The OR of dyslipidaemia increased with an increase in the abdominal obesity dietary pattern score. In addition, the prevalence of the total population and men also increased with an increase in scores while decreasing in women (online Supplementary Fig. S1), which might be because this abdominal obesity dietary pattern is more likely to lead to the accumulation of visceral fat in men, promoting the delivery of NEFA to the liver through the portal vein, and ultimately increasing the prevalence of dyslipidaemia(Reference Bredella40). Another reason may be the difference in sex hormones between men and women(Reference Tchernof, Labrie and Belanger41).
VFI was part of the mediating effect in the correlation analysis of abdominal obesity dietary pattern and dyslipidaemia. The direct and indirect effects of dietary patterns on dyslipidaemia were also significant. The results of the mediating effect analysis were similar to previous research. Mtintsilana et al. showed that central obesity was the mediating effect of the association between inflammatory factor index of dietary and type 2 diabetes markers(Reference Mtintsilana, Micklesfield and Chorell42). According to the findings of the US NHANES, adiposity mediates the association between whole grain consumption, glucose homoeostasis and insulin resistance(Reference Mazidi, Katsiki and Kengne43). In the present study, the mediating effect of VFI on the association between the dietary pattern of abdominal obesity and dyslipidaemia was 53·26 %.
The present study has several strengths. Firstly, this survey is a large-scale cross-sectional study of its kind in rural China. Secondly, we evaluated the association between dyslipidaemia and the dietary pattern of abdominal obesity extracted by the RRR analysis, and then further analysed the mediation effect of VFI. However, some potential limitations should be mentioned. Firstly, we could not evaluate the causal relationships between dietary patterns and dyslipidaemia risk due to the cross-sectional design. Second, food consumption in the present study was assessed by FFQ based on the self-report of participants, which might be susceptible to recall bias. Therefore, we evaluated the reliability and validity of FFQ to control this bias. Thirdly, we had no further calculation of nutrients since FFQ was collected according to the food group. For further research, we will evaluate the nutrients obtained through FFQ by calculating the nutrient weighting coefficients for each food group based on data from the 3-d 24-h dietary review of a small sample. Fourthly, we did not exclude patients with diabetes, hypertension and CKD before data analysis, because their food behaviours and patterns might have changed. Finally, this was a single study limited to the Chinese rural population, limiting the generalisation of the findings to other groups.
In conclusion, the dietary pattern in abdominal obesity extracted by RRR was characterised by high carbohydrate and red meat intake and low consumption of fresh fruits, vegetables, milk and dairy products. The dietary pattern scores in abdominal obesity positively affected VFI and dyslipidaemia, and there was a dose–response relationship. Higher dietary pattern scores in abdominal obesity increased the progression of dyslipidaemia. In addition, VFI played a partial mediating role in the relationship between the dietary pattern in abdominal obesity and dyslipidaemia.
Acknowledgements
The authors would like to give great gratitude for the participants, all research staff of present study. The authors thank anonymous reviewers for their helpful suggestions on the quality improvement of our present paper.
This research was supported by the National Key Research and Development Program Precision Medicine Initiative of China, grant number: 2016YFC0900803; National Natural Science Foundation of China, grant number: 81872626, 82003454; Chinese Nutrition Society – Bright Moon Seaweed Group Nutrition and Health Research Fund, grant number: CNS-BMSG2020A63; Chinese Nutrition Society – Zhendong National Physical Fitness and Health Research Fund, grant number: CNS-ZD2019066. Key R&D and promotion projects in Henan Province: 212102310219. The funders had no role in the study design, data collection and analysis, decision to publish or preparation of the manuscript.
X.-L., W.-J. L. and C.-J. W., conceived and designed the study. S.-B. P., D.-D. Z., Z.-X. M., J.-J. G. and J.-S. L. performed the investigation. Y.-X. and C.-L. analysed the data. Y.-X. and C.-L. wrote the manuscript. All authors read and approved the final manuscript.
The authors declare no conflict of interest.
Supplementary material
For supplementary materials referred to in this article, please visit https://doi.org/10.1017/S0007114521003640


