


The prevalence of obesity among 2–19-year-olds in the USA is 18·5 %, with ethnic/racial minority youth facing the highest burden of obesity(Reference Hales, Carroll and Fryar1). Diet is a known contributor to risk for obesity(Reference Kumar and Kelly2), but associations based on individual foods or nutrients are less consistent than those for dietary patterns(Reference Ambrosini3). Examining dietary patterns instead of individual foods/nutrients is advantageous because it allows researchers to measure the totality of individuals’ dietary intake and the complex, multidimensional nature of diets(Reference Ocké4). Dietary patterns may also better predict the risk for cardiometabolic diseases because they can capture both over- and under-consumption of key nutrients or foods over time(Reference Ambrosini3,Reference Schulze and Hoffmann5) .
Dietary patterns can be operationalised with various dietary quality indices and scores. For example, children’s diet quality has been examined using the Healthy Eating Index-2010 (HEI-2010)(Reference Truesdale, Matheson and JaKa6), Dietary Approaches to Stop Hypertension scores(Reference Golpour-Hamedani, Mohammadifard and Khosravi7) and the Mediterranean Diet Quality Index for children and adolescents(Reference Labayen Goñi, Arenaza and Medrano8,Reference Iaccarino Idelson, Scalfi and Valerio9) . These scores are based on recommended ‘healthy’ dietary patterns that have been defined a priori. While these scores are useful for studying the quality of diets and associations with health outcomes, the optimal utility of a priori defined dietary patterns in epidemiological studies is limited to populations with a broad distribution of scores for a given index. Often the scores in a given sample are not well distributed, and thus an alternative approach is needed.
For example, in the four randomised controlled trials within the Childhood Obesity Prevention and Treatment Research (COPTR) Consortium(Reference Pratt, Boyington and Esposito10) – which examined predominantly low-income, racial/ethnic minority youth aged 2–5 or 7–13 years – HEI-2010 scores in each study were narrowly distributed. Specifically, out of a possible score of 100, the mean and 95 % CI for each study were: 63·7 (95 % CI 62·8, 64·7), 64·5 (95 % CI 63·6, 65·4), 47·9 (95 % CI 46·8, 49·0) and 61·7 (95 % CI 60·3, 63·2)(Reference Truesdale, Matheson and JaKa6). Further, an HEI-2010 score ≥81 indicated good dietary quality(Reference Truesdale, Matheson and JaKa6), but only 0·3–8·1 % of participants met this criterion across the four COPTR studies. Such a narrow range of scores does not allow for accurate examination of associations between HEI-2010 scores and outcomes like BMI.
An alternative approach to using a priori defined dietary patterns is using data-driven methodology, including k-means cluster analysis(Reference Caliński and Harabasz11). K-means cluster analysis identifies groups of individuals with similar dietary intakes(Reference Hu12). By design, cluster analysis is exploratory and sample-specific and it relies on the researcher making informed decisions on topics ranging from food groupings to the number of clusters to examine(Reference Hu12,Reference Reedy, Wirfält and Flood13) . However, cluster analysis has a distinct benefit over a priori approaches because it allows researchers to search for the patterns that actually occur in a given sample, regardless of distributions of a priori scores or of overall dietary quality(Reference Miller, Lazarus and Lesko14). Previous reviews have examined data-driven dietary patterns in young children (aged 1– 5 years)(Reference Smithers, Golley and Brazionis15) and wider age ranges of children/adolescents (aged 2–19 years)(Reference Hinnig, Monteiro and de Assis16). The derived dietary patterns in youth are often named ‘Healthy’ and ‘Unhealthy’, with some studies identifying a third, culture-specific dietary pattern called a ‘Traditional’ pattern(Reference Smithers, Golley and Brazionis15,Reference Hinnig, Monteiro and de Assis16) . For example, a Traditional pattern in a cohort of youth from the UK was typified by high consumption of meat/meat pies, potatoes, fried fish, dairy products, cakes/buns and puddings(Reference Smith, Emmett and Newby17).
To our knowledge, only three previous studies have derived overall dietary patterns using cluster analysis in US children(Reference Knol, Haughton and Fitzhugh18–Reference Hidaka, Kerling and Thodosoff20). While these studies have included racially/ethnically diverse groups, with one specifically deriving dietary patterns for Black adolescents(Reference Ritchie, Spector and Stevens19), none of these studies included samples that were predominantly Hispanic and two of the studies used data collected during the late 1980s and 1990s(Reference Knol, Haughton and Fitzhugh18,Reference Ritchie, Spector and Stevens19) . Given changes in US children’s dietary intake from the 1980s to 2010(Reference Ford, Slining and Popkin21) and evidence that dietary patterns differ according to race and ethnicity(Reference Ritchie, Spector and Stevens19,Reference Lin, Bermudez and Tucker22) , there is a need to derive dietary patterns using recent data for multi-ethnic US youth. This is especially needed among samples that are predominantly Hispanic and non-Hispanic Black, populations with a higher prevalence of childhood obesity than non-Hispanic White youth (25·8 % and 22·0 v. 14·1 %, respectively)(Reference Hales, Carroll and Fryar1). Further, no studies in US children have examined associations between data-driven dietary patterns and BMI measures, with only one study having examined this association in adolescents(Reference Ritchie, Spector and Stevens19). There is a particular need to examine the association between dietary patterns and BMI in Mexican American youth, given inconsistent findings in the association between a Traditional Mexican dietary pattern (i.e. high intake of tortillas, beans, squash, tomato, chilli and onion)(Reference Valerino-Perea, Lara-Castor and Armstrong23) and risk for obesity in adults(Reference Carrera, Gao and Tucker24,Reference Flores, Macias and Rivera25) . Notably, one study conducted in the USA actually indicated that adults following a Traditional Mexican dietary pattern trended towards a higher BMI(Reference Carrera, Gao and Tucker24).
In this study, our objective was to fill these gaps by deriving data-driven dietary patterns and examining the associations of these patterns with baseline BMI and percentage of the 95th BMI percentile in low-income, racial/ethnic minority children enrolled in four trials of the COPTR Consortium(Reference Pratt, Boyington and Esposito10). We hypothesised that Healthy and Unhealthy patterns would be derived for each study and that a Traditional Mexican pattern representing Mexican food culture would be derived for studies with a high percentage of Mexican American participants. We expected an inverse association between the Healthy pattern and BMI measures and a positive association between the Unhealthy and Traditional dietary patterns and BMI measures, based on previous literature.
Methods
Research population
All data were collected between 2012 and 2014 during baseline examinations of the four COPTR Consortium studies. The COPTR Consortium included two obesity prevention randomised controlled trials (University of Minnesota, Now Everyone Together for Healthy and Amazing Kids (NET-Works)(Reference Sherwood, French and Veblen-Mortenson26) and Vanderbilt University, Growing Right Onto Wellness (GROW)(Reference Po’e, Heerman and Mistry27)), two obesity treatment randomised controlled trials (Stanford University, GOALS(Reference Robinson, Matheson and Desai28) and Case Western Reserve University, Ideas Moving Parents and Adolescents to Change Together (IMPACT)(Reference Moore, Borawski and Cuttler29)) and a Research Coordinating Unit (The University of North Carolina at Chapel Hill)(Reference Pratt, Boyington and Esposito10). These studies recruited predominantly low-income, racial/ethnic minority populations for 3-year multi-level obesity interventions(Reference Pratt, Boyington and Esposito10,Reference Sherwood, French and Veblen-Mortenson26–Reference Moore, Borawski and Cuttler29) . Each study had different intervention protocols, sample sizes and eligibility criteria. Preschool-aged children were recruited for the NET-Works (n 534 2- to 4-year-olds ≥50th BMI percentile) and GROW (n 610 3- to 5-year-olds ≥50th and <95th BMI percentile) studies(Reference Sherwood, French and Veblen-Mortenson26,Reference Po’e, Heerman and Mistry27) . Pre-adolescent and adolescent children with overweight or obesity were recruited for the GOALS (n 241 7- to 11-year-olds ≥85th BMI percentile) and IMPACT (n 360 rising 6th graders ≥85th BMI percentile, resulting in recruitment of 10- to 13-year-olds) studies(Reference Robinson, Matheson and Desai28,Reference Moore, Borawski and Cuttler29) . Additional details of the COPTR Consortium and each intervention study have previously been published(Reference Pratt, Boyington and Esposito10,Reference Sherwood, French and Veblen-Mortenson26–Reference Moore, Borawski and Cuttler29) .
The COPTR studies were conducted according to the guidelines laid down in the Declaration of Helsinki, and all procedures involving human subjects/patients were approved by the University of Minnesota (NET-Works), Vanderbilt University Medical Center (GROW), Stanford University Administrative Panel on Human Subjects in Medical Research (GOALS) and the University Hospitals of Cleveland Human Subjects (IMPACT). Written informed consent was obtained from parents in all COPTR studies; children additionally provided written assent in GOALS and IMPACT. A data and safety monitoring board appointed by the National Heart, Lung, and Blood Institute approved all study protocols and monitored participant safety and protocol adherence throughout the trials.
Dietary assessment
Dietary intake of each child was assessed using three 24-h dietary recalls collected via the Nutrition Database System for Research software (versions 2011–2013) developed by the Nutrition Coordinating Center, University of Minnesota, Minneapolis, Minnesota(Reference Pratt, Boyington and Esposito10,Reference Schakel, Sievert and Buzzard30) . All dietary recalls were conducted in English or Spanish, and each study aimed to collect data from participants on both weekends and weekdays(Reference Sherwood, French and Veblen-Mortenson26–Reference Moore, Borawski and Cuttler29). Dietary recalls were collected either in person or by telephone. Respondents were provided with two-dimensional food portion aids to assist in identifying portion sizes for each recall(Reference Sherwood, French and Veblen-Mortenson26–Reference Moore, Borawski and Cuttler29).
In the GOALS and IMPACT studies, the child self-reported their dietary intake with parental/guardian assistance as needed(Reference Robinson, Matheson and Desai28,Reference Moore, Borawski and Cuttler29) . Because children in NET-Works and GROW were younger, a parent/guardian served as a proxy for the child(Reference Sherwood, French and Veblen-Mortenson26,Reference Po’e, Heerman and Mistry27) . For children in childcare, food records were given to the childcare provider and the completed form was used by the parent/guardian to aid in dietary recall completion(Reference Sherwood, French and Veblen-Mortenson26,Reference Po’e, Heerman and Mistry27) . For the purpose of analysis, intake was measured in terms of number of servings and individual foods/beverages were collapsed into twenty-four food groups (online Supplementary Table S1). Intake was averaged across recalls within child.
Table 1. Characteristics of child and primary parent/guardian in the analytic sample for each Childhood Obesity Prevention and Treatment Research (COPTR) study
(Mean values and standard deviations; numbers and percentages)

NET-Works, Now Everyone Together for Healthy and Amazing Kids; GROW, Growing Right Onto Wellness; IMPACT, Ideas Moving Parents and Adolescents to Change Together; GED, General Equivalency Diploma; SNAP, Supplemental Nutrition Assistance Program.
* Child’s BMI percentile refers to age- and sex-specific BMI percentiles calculated using the Centers for Disease Control and Prevention SAS macro.
† Child’s %95th BMI percentile refers to the percentage of the age- and sex-specific 95th BMI percentile calculated using the Centers for Disease Control and Prevention SAS macro.
‡ Parent’s weight status classified as follows: underweight/normal weight (BMI < 25 kg/m2), overweight (BMI 25–29 kg/m2) and obesity (BMI ≥ 30 kg/m2).
Outcome assessment
Weight and height were measured with the child in light clothing without shoes using a standardised protocol across all studies(Reference Sherwood, French and Veblen-Mortenson26–Reference Moore, Borawski and Cuttler29). Weight was measured to the nearest 0·1 kg, and height was measured to the nearest 0·1 cm(Reference Sherwood, French and Veblen-Mortenson26–Reference Moore, Borawski and Cuttler29). BMI was calculated as weight in kg divided by height in metres squared. Age- and sex-specific BMI percentiles were calculated using the Centers for Disease Control and Prevention (CDC) SAS programme(31) (based on the CDC growth charts) to determine site-specific eligibility. However, the highest percentile estimated in the CDC growth charts was the 97th percentile, and thus using this programme to estimate the BMI percentile for an individual with a very high BMI is not recommended and has been shown to be inaccurate(31–Reference Flegal, Wei and Ogden33). The CDC recommends that, if a large portion of youth in an analysis has severe obesity (as was the case in COPTR), that all BMI should be expressed relative to the 95th percentile (‘percentage of the 95th BMI percentile’)(31). This variable is a better measure of adiposity for these youth and can be interpreted as in the following example: if the percentage of the 95th BMI percentile is equal to 160, the child would have a BMI equal to 1·6 times the CDC-defined age- and sex-specific 95th BMI percentile. Percentage of the 95th BMI percentile was thus calculated for all youth using the CDC SAS programme(31).
Covariate assessment
The primary parent/guardian completed questionnaires in their language of choice (English or Spanish) to assess the following variables: race/ethnicity (non-Hispanic White, non-Hispanic Black, Hispanic, multi-racial or other) of the child, age and sex of the child, employment status (full-time, part-time or not working for pay), highest household education (<high school, high school or equivalent, or at least some college), Supplemental Nutrition Assistance Program participation (yes/no) and marital status (single or married/living as married)(Reference Sherwood, French and Veblen-Mortenson26–Reference Moore, Borawski and Cuttler29). Regarding Hispanic ethnicity, parents were asked to indicate whether the child was of ‘Hispanic, Latino/a, or Spanish’ origin. If they selected ‘yes’, they then indicated (selecting all that applied) whether the child was Mexican American, Chicano/a; Puerto Rican; Cuban; or another Hispanic, Latino/a or Spanish origin(Reference Sherwood, French and Veblen-Mortenson26–Reference Moore, Borawski and Cuttler29). Parent’s height and weight were also measured by trained examiners using a standardised protocol across all studies(Reference Sherwood, French and Veblen-Mortenson26–Reference Moore, Borawski and Cuttler29). Parent’s weight status was determined according to existing standards: underweight (BMI < 18·5 kg/m2), normal weight (BMI 18·5–24·9 kg/m2), overweight (BMI 25·0–29·9 kg/m2) or obese (BMI ≥ 30 kg/m2)(34). Due to few individuals being classified as underweight in each study, the underweight and normal-weight groups were combined for analysis.
Statistical analysis
To derive dietary patterns, a k-means cluster analysis(Reference Caliński and Harabasz11) was conducted for each study separately among children with at least two dietary recalls (n 1 from GROW was excluded due to having only one dietary recall; analytic sample sizes as follows: NET-Works (n 534), GROW (n 609), GOALS (n 241), and IMPACT (n 360)). Each cluster analysis was based on energy-adjusted, standardised versions of the twenty-four dietary variables. Specifically, each of the dietary variables was energy-adjusted by dividing intake (average servings) by average total daily energy intake and subsequently multiplying by 1000 to create a variable of ‘servings/1000 kcal’(Reference Austin, Adair and Galanko35). Each variable was then standardised using z-scores to calibrate for the magnitude across variables(Reference Austin, Adair and Galanko35). Cluster solutions with 2–10 clusters were examined, and each analysis was run for a maximum of 1000 iterations. Seeds containing ≤5 % of the sample were removed during each iteration to ensure adequate sample sizes in the resulting clusters(Reference Everitt, Landau and Leese36). The best solution was selected according to the pseudo-F statistic(Reference Caliński and Harabasz11,Reference Milligan and Cooper37) .
To examine the predictors of dietary patterns and associations between dietary patterns and measures of BMI, participants with missing socio-demographic and anthropometric data were further excluded. Individuals were excluded for missing primary parent/guardian employment status (GROW n 1), Supplemental Nutrition Assistance Program participation (NET-Works n 1; GROW n 2; GOALS n 1), primary parent/guardian marital status (GROW n 2; IMPACT n 2) and primary parent/guardian’s weight status (NET-Works n 6; IMPACT n 17). This corresponded to excluding the following percentages of each study: 1 % of NET-Works and GROW, <1 % of GOALS and 5 % of IMPACT. The final analytic sample sizes were as follows: NET-Works (n 527), GROW (n 604), GOALS (n 240) and IMPACT (n 341).
Multiple logistic or multinomial logistic regression models were used to examine the odds of cluster membership according to socio-demographic and anthropometric characteristics. Multivariable linear regression models were used to examine associations between cluster membership and BMI or percentage of the 95th BMI percentile. Covariates in these models included child’s age, child’s sex, highest household education, primary parent/guardian employment, Supplemental Nutrition Assistance Program participation, primary parent/guardian marital status and primary parent/guardian weight status. Significance was set at P < 0·05 for all analyses. All analyses were conducted using SAS version 9.4.
Results
Table 1 presents the socio-demographic and anthropometric characteristics for each COPTR study. All studies except IMPACT were predominantly Hispanic, with IMPACT being predominantly non-Hispanic Black. Hispanic individuals in NET-Works, GROW and GOALS primarily reported being Mexican American/Chicano/a (74, 70 and 85 %, respectively; data not shown in Table 1). Parents in each study most frequently reported not working for pay, and the majority of households in GROW (75·5 %) and IMPACT (70·6 %) were Supplemental Nutrition Assistance Program participants.
Table 2 provides an overview of the k-means cluster analysis results. Two dietary patterns were derived for all studies except GROW, which had three patterns. Patterns were named based on the food groups that loaded highly on each cluster and in accordance with existing knowledge of diet quality and previously derived dietary patterns(Reference Smithers, Golley and Brazionis15,Reference Hinnig, Monteiro and de Assis16) . The NET-Works and GROW studies each had dietary patterns labelled ‘Healthy’ and ‘Unhealthy’, reflecting the degree of adherence to US dietary guidelines. A third pattern was derived for GROW called ‘Dairy/Sugar-sweetened beverage (SSB)’, named solely after the foods groups with the highest intake. The GOALS study also had a similar ‘Healthy’ pattern and a pattern labelled ‘Semi-Traditional’, reflecting intake of some, but not all, foods/beverages typical of a Traditional Mexican diet. The two patterns for the IMPACT study were distinct from those derived in the other three COPTR studies and were labelled ‘Mixed’, indicating adherence to some aspects of healthy and unhealthy diets, and ‘Sandwich’, due to this pattern containing high intake of food groups typically found in a sandwich. The most prevalent dietary pattern was the Healthy cluster for NET-Works children (59·7 %), the Dairy/SSB cluster for GROW children (51·7 %), the Semi-Traditional cluster for GOALS adolescents (62·2 %) and the Mixed cluster for IMPACT adolescents (51·7 %). The odds of belonging to each cluster according to socio-demographic characteristics are provided in online Supplementary Tables S2 and S3.
Table 2. Overview of cluster solutions for each Childhood Obesity Prevention and Treatment Research (COPTR) study
(Numbers and percentages)
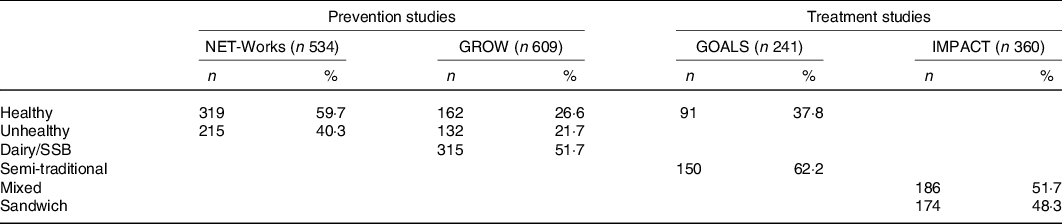
NET-Works, Now Everyone Together for Healthy and Amazing Kids; GROW, Growing Right Onto Wellness; IMPACT, Ideas Moving Parents and Adolescents to Change Together; SSB, sugar-sweetened beverages.
Specific food groups that characterised the Healthy and Unhealthy clusters in NET-Works and GROW differed slightly between studies (Figs. 1 and 2, respectively). However, the Healthy cluster was generally characterised by high consumption of fruits, vegetables, legumes, whole grains, eggs, seafood and poultry, and the Unhealthy cluster was characterised by high consumption of fried foods, snacks, desserts and sweetened milk. The Healthy cluster in the GOALS study (Fig. 3) was similar to the Healthy clusters in NET-Works and GROW except it was largely characterised by high milk intake and did not include high vegetable or poultry intake. For the IMPACT study (Fig. 4), the Mixed cluster was characterised not only by high intake of fruits, vegetables, whole grains, milk and poultry but also by high intakes of desserts, fruit juice and sweetened milk.

Fig. 1. Mean z-score of each food/beverage group servings per 1000 kcal for the selected k-means cluster solution for Now Everyone Together for Healthy and Amazing Kids (NET-Works) (n 534). AUSB, artificially and unsweetened beverages; SSB, sugar-sweetened beverages.
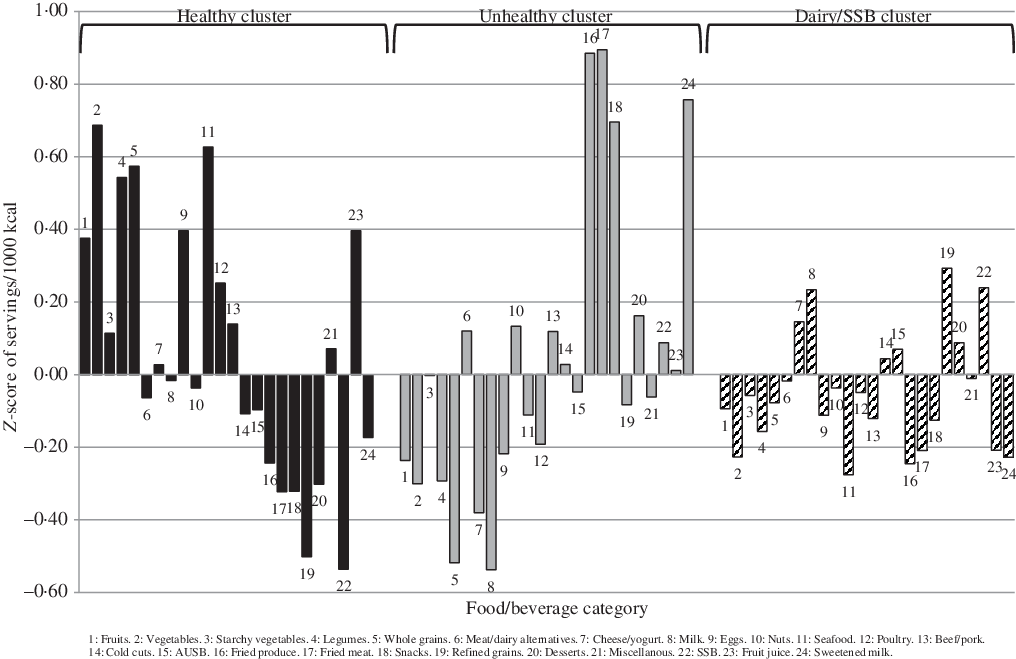
Fig. 2. Mean z-score of each food/beverage group servings per 1000 kcal for the selected k-means cluster solution for Growing Right Onto Wellness (GROW) (n 609). AUSB, artificially and unsweetened beverages; SSB, sugar-sweetened beverages.
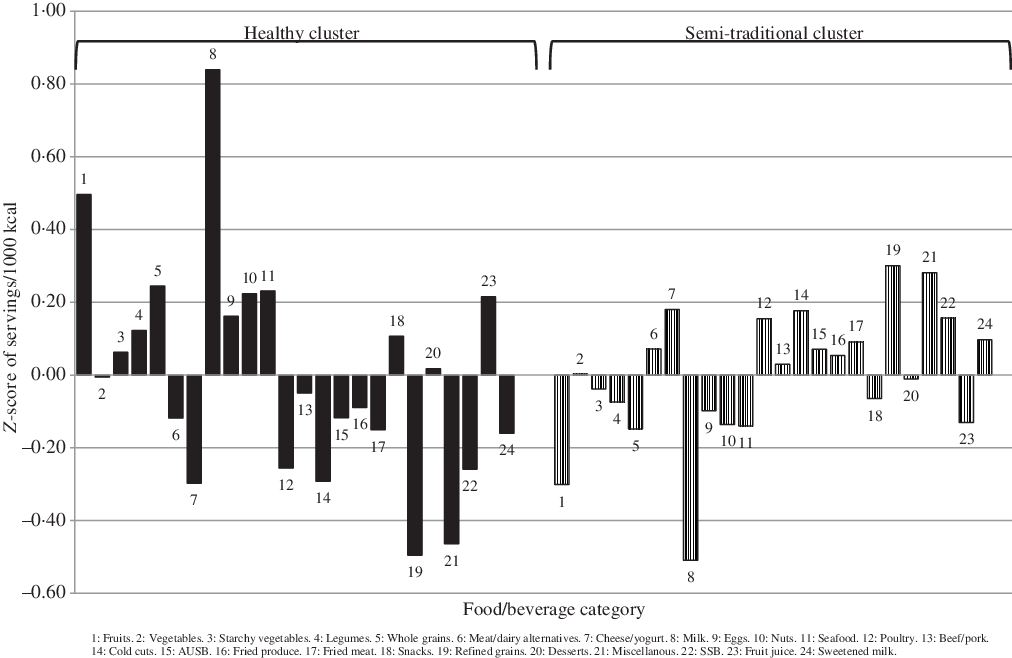
Fig. 3. Mean z-score of each food/beverage group servings per 1000 kcal for the selected k-means cluster solution for GOALS (n 241). AUSB, artificially and unsweetened beverages; SSB, sugar-sweetened beverages.

Fig. 4. Mean z-score of each food/beverage group servings per 1000 kcal for the selected k-means cluster solution for Ideas Moving Parents and Adolescents to Change Together (IMPACT) (n 360). AUSB, artificially and unsweetened beverages; SSB, sugar-sweetened beverages.
Foods that characterised the remaining clusters differed across studies. The Dairy/SSB cluster in the GROW study was typified by high intake of refined grains, milk, cheese/yogurt and SSB. The Semi-Traditional cluster in GOALS was defined by high intake of refined grains, poultry, cold cuts, cheese/yogurt, miscellaneous and SSB. Lastly, the Sandwich pattern in IMPACT was characterised by high intake of refined grains, cold cuts, miscellaneous and cheese/yogurt.
Table 3 shows the association between cluster membership and BMI and percentage of the 95th BMI percentile. All associations were null with the exception of the IMPACT study. For the IMPACT study, belonging to the Sandwich compared with Mixed cluster was associated with a 0·99 kg/m2 (95 % CI 0·01, 1·97) higher BMI and being 4·17 (95 % CI 0·11, 8·24) percentage points greater than the average percentage of the 95th BMI percentile.
Table 3. Associations between cluster membership and BMI and percentage of the 95th BMI percentile for each Childhood Obesity Prevention and Treatment Research (COPTR) study†
(β Values and 95% confidence intervals)
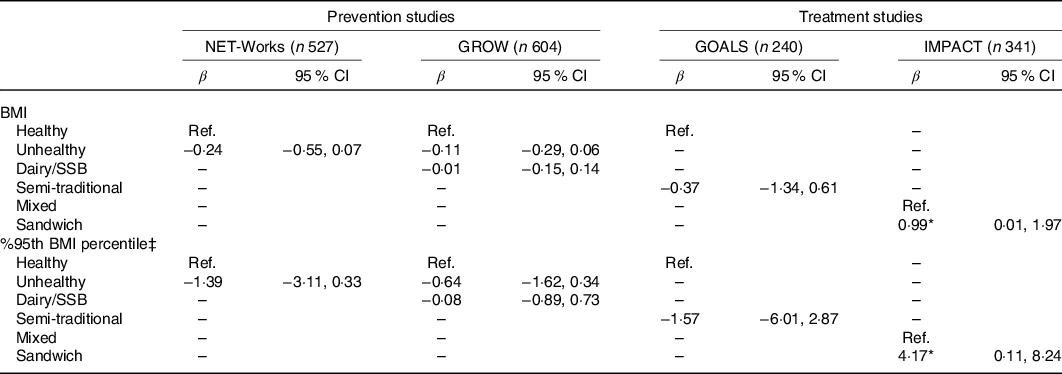
NET-Works, Now Everyone Together for Healthy and Amazing Kids; GROW, Growing Right Onto Wellness; IMPACT, Ideas Moving Parents and Adolescents to Change Together; Ref., reference; SSB, sugar-sweetened beverages.
* P < 0·05.
† Models adjusted for child’s age, child’s sex, highest household education, primary parent/guardian employment, Supplemental Nutrition Assistance Program participation, primary parent/guardian marital status and primary parent/guardian weight status.
‡ %95th BMI percentile refers to the percentage of the child’s age- and sex-specific 95th BMI percentile calculated using the Centers for Disease Control and Prevention SAS macro.
Discussion
This is one of the few studies to examine dietary patterns in low-income, racial/ethnic minority children and adolescents in the USA and the first US study (that we are aware of) to derive dietary patterns in samples of predominantly Hispanic youth. Additionally, this study is the first to our knowledge to examine associations between data-driven dietary patterns and BMI in young US children. Consistent with our hypothesis, 2–3 dietary patterns described overall dietary intake for each COPTR study. Healthy and Unhealthy patterns were found in both the NET-Works and GROW studies, and a similar Healthy pattern was observed in the GOALS study. A Semi-Traditional pattern was only identified for the GOALS study. Across studies, associations with BMI were largely null, but having a Sandwich compared with a Mixed dietary pattern in the IMPACT study was associated with a greater BMI and percentage of the 95th BMI percentile.
Identification of Healthy and Unhealthy patterns across the two COPTR studies of young children is consistent with a recent review of seventeen studies that identified these two patterns as the most common dietary patterns in young children (aged 1–5 years) in developed countries(Reference Smithers, Golley and Brazionis15). Similar to COPTR, the specific foods that characterised these patterns varied across studies, but Healthy patterns were generally characterised by high intake of fruits, vegetables and whole grains, and Unhealthy patterns were typified by high intake of SSB, chips and sweets(Reference Smithers, Golley and Brazionis15). The findings for the NET-Works and GROW studies are also similar to those of the three previous studies that derived dietary patterns using cluster analysis in US youth(Reference Knol, Haughton and Fitzhugh18–Reference Hidaka, Kerling and Thodosoff20). Specifically, two of the aforementioned studies identified a Healthy pattern(Reference Ritchie, Spector and Stevens19,Reference Hidaka, Kerling and Thodosoff20) and one study additionally reported an Unhealthy pattern(Reference Hidaka, Kerling and Thodosoff20).
It should also be noted that a third pattern was derived for the GROW study that was labelled the Dairy/SSB pattern, and the majority of children in GROW (51·7 %) belonged to this cluster. While this finding was unexpected, a similar pattern has been derived for 4- to 8-year-old low-income children in the US called ‘Big Eaters – Dairy and non-whole grains style’(Reference Knol, Haughton and Fitzhugh18). The Big Eaters – Dairy and non-whole grains style was also relatively common among youth (second most prevalent pattern) and was characterised by high energy intake, specifically high intake of refined grains, milk, cheese and added sugars(Reference Knol, Haughton and Fitzhugh18). However, researchers should interpret this Dairy/SSB pattern with caution given (1) it was unique to the GROW study and (2) there was substantial overlap of the Dairy/SSB cluster with both the Healthy and Unhealthy cluster in exploratory analyses using principal components analysis (data not shown).
It was hypothesised that Healthy and Unhealthy patterns would also be observed in the GOALS and IMPACT studies, given they are the most commonly derived patterns among adolescents(Reference Hinnig, Monteiro and de Assis16). However, a Healthy pattern was only observed for the GOALS study. While the Mixed pattern in IMPACT encompassed some components of healthy intake, such as whole grains and poultry, the lack of a Healthy pattern for the IMPACT study is consistent with the one previous examination of dietary patterns in US Black adolescents(Reference Ritchie, Spector and Stevens19).
A second dietary pattern was identified in the GOALS and IMPACT studies that was unique to each study. In the GOALS study, the second dietary pattern identified was the Semi-Traditional pattern, and the majority of youth belonged to this cluster (62·2 %). While similar to the Unhealthy patterns from NET-Works and GROW (in that the Semi-Traditional pattern was also typified by low intake of fruits, milk and lean proteins), it was considered a distinct pattern because it was not characterised by high intake of fried foods, snacks or desserts. Nearly 98 % of the GOALS study was Hispanic, of which 85 % were Mexican American or Chicano/a (the remaining 15 % were of ‘other Hispanic, Latino/a, or Spanish ethnicity’). Thus, it is plausible that this dietary pattern represents dietary intake characteristic of Mexican culture.
It is important to note that, while the majority of Hispanics in GOALS were of Mexican descent, the definition of a ‘traditional’ dietary pattern varies across Hispanic/Latino backgrounds as a result of cultural heritage and country of origin(Reference Siega-Riz, Sotres-Alvarez and Ayala38). Traditional diets in Mexican American adults have been described as high in intake of refined grains (in the form of tortillas)(Reference Carrera, Gao and Tucker24,Reference Siega-Riz, Sotres-Alvarez and Ayala38,Reference Sofianou, Fung and Tucker39) , meat(Reference Siega-Riz, Sotres-Alvarez and Ayala38,Reference Murtaugh, Sweeney and Giuliano40) , legumes(Reference Carrera, Gao and Tucker24,Reference Sofianou, Fung and Tucker39,Reference Murtaugh, Sweeney and Giuliano40) , tomatoes(Reference Carrera, Gao and Tucker24,Reference Siega-Riz, Sotres-Alvarez and Ayala38–Reference Murtaugh, Sweeney and Giuliano40) , cheese(Reference Murtaugh, Sweeney and Giuliano40) and sweetened drinks(Reference Carrera, Gao and Tucker24,Reference Siega-Riz, Sotres-Alvarez and Ayala38) . However, the GOALS pattern was not characterised by high intake of tomatoes and legumes, and thus this dietary pattern is labelled only as Semi-Traditional. Dietary acculturation may provide a potential explanation for the lack of a true Traditional Mexican dietary pattern, particularly with respect to the low intake of tomatoes and other produce. Notably, Mexican American individuals have been shown to consume fewer fruits and vegetables and more fast food with greater acculturation(Reference Ayala, Baquero and Klinger41–Reference Liu, Chu and Frongillo43). It is also possible that the Semi-Traditional dietary pattern is not a true Traditional Mexican dietary pattern due to the presence of multiple Hispanic/Latino backgrounds in our sample.
The second pattern identified in the IMPACT study was the Sandwich pattern. The observation that both dietary patterns for IMPACT were distinct from those derived in other COPTR studies is similar to previous research in COPTR which identified distinct snack-occasion-specific dietary patterns for IMPACT compared with the other COPTR studies(Reference LeCroy, Truesdale and Matheson44). Interestingly, the Sandwich pattern in IMPACT was similar to another pattern called ‘Packed Lunch’ that was previously observed at 7, 10 and 13 years of age in the Avon Longitudinal Study of Parents and Children in England(Reference Northstone, Smith and Newby45). Specifically, the Packed Lunch pattern was characterised by high consumption of white bread, ham and bacon, miscellaneous items (i.e. margarine, sweet spreads and salty flavourings), crisps (chips), biscuits (cookies), and artificially and unsweetened beverages (i.e. diet squash (fruit-flavoured beverage), tea and coffee)(Reference Northstone, Smith and Newby45).
Contrary to our hypotheses, associations between dietary patterns and BMI or percentage of the 95th BMI percentile were null with the exception that the Sandwich compared with the Mixed dietary pattern was associated with a higher BMI and percentage of the 95th BMI percentile. This finding for the IMPACT study is similar to findings for the Packed Lunch pattern in the Avon Longitudinal Study of Parents and Children(Reference Bull and Northstone46). Specifically, compared with a Healthy dietary pattern, a Packed Lunch pattern at 7 years of age was associated with a significantly greater odds of being in the top 10 % for BMI at 7 years of age. However, significant cross-sectional associations were not observed between the Packed Lunch pattern and BMI at age 10 or 13 years(Reference Bull and Northstone46).
A potential explanation for the null associations of dietary patterns with BMI and percentage of the 95th BMI percentile in this study is the cross-sectional design of the analysis. For example, individuals with a Healthy dietary pattern could have (1) adopted or reported a healthy diet as a result of having a higher BMI and a desire to lose weight or (2) followed a healthy diet to maintain their already normal BMI. This combination of individuals within one group may have prevented the detection of a significant association. Of course, it is possible that our derived dietary patterns were not associated with BMI and that other factors were more strongly associated with adiposity in these youth.
Strengths and limitations
The present analysis has several strengths, including the use of data-driven methodology to derive clusters. This methodology allows for the detection of dietary patterns unique to each population and does not rely on previously validated scores or indices(Reference Miller, Lazarus and Lesko14). This type of approach is especially useful in populations like the COPTR cohorts in which the distributions of a priori scores like HEI-2010 are narrow(Reference Truesdale, Matheson and JaKa6). Another strength is the diversity in age and in race/ethnicity in the COPTR populations with multiple 24-h recalls collected per child.
This study is limited by the self-reported dietary data. While repeated 24-h recalls were used to obtain valid reports of dietary intake, it remains a challenge to collect dietary data that is valid and precise, particularly in children(Reference Burrows, Golley and Khambalia47). Additionally, although comparisons were made between healthier and unhealthier dietary patterns, the patterns labelled Healthy did not meet all required dietary standards. For example, vegetable intake in the GOALS Healthy pattern was low, while the two Healthy patterns derived from the obesity prevention studies were low in milk intake. The lack of a Healthy diet pattern that meets the dietary recommendations for youth reflects a limitation of data-derived dietary patterns, in that the defined patterns are not reflective of evidence-based dietary quality.
We must also note that while there was consistency in dietary patterns across COPTR studies, dietary patterns derived using cluster analysis are, by design, sample-specific(Reference Hu12). Thus, these patterns may not be applicable to other populations. Further, while the use of cluster analysis to examine dietary patterns is commonplace in nutritional epidemiology(Reference Togo, Osler and Sørensen48–50), this approach does not allow investigators to delineate dissimilarities in dietary intake among individuals within a given group(Reference Reedy, Wirfält and Flood13). Additional limitations of this study include that unmeasured variables may explain differences in clusters despite our attempt to adjust for plausible determinants of cluster membership. Further, while this is one of the first studies to examine dietary patterns in minority race/ethnic groups, sample size within each COPTR study prevented the examination of dietary patterns specific to each race or Hispanic ethnic group.
Implications
Several potential intervention targets emerged from our analysis. Based on the association of the Sandwich compared with the Mixed dietary pattern with a higher BMI in the IMPACT study, potential intervention targets could be substitution of refined grains for whole grains and of cold cuts and cheese for poultry (given that poultry was the main source of protein in the Mixed dietary pattern). Despite null associations with BMI in the other COPTR studies, other potential intervention targets can be suggested based on how intakes of types of foods grouped together within each study’s patterns. For example, the Unhealthy dietary patterns were defined by high intake of fried foods as well as low intake of fruits and vegetables. The way these foods group together suggests that programmes and policies that promote fruit and vegetable intake, for example, may be associated with decreased fried food consumption, which would make the diets of children in the Unhealthy cluster more similar to diets of children in the Healthy cluster. Similarly, patterns defined by high intake of sweetened beverages (i.e. Unhealthy, Semi-Traditional and Sandwich patterns) were also defined by low intake of milk. Making milk, or plain water (which was not used to derive dietary patterns), the default choice for children may also help improve overall diet quality.
Conclusions
The specific foods that defined the dietary patterns varied across studies, and some dietary patterns were specific to each COPTR study. Dietary intakes of low-income, racial/ethnic minority preschool children largely cluster into Healthy and Unhealthy dietary patterns, while older age groups had dietary patterns consistent with other reports of food intake in the literature. This suggests that dietary patterns in youth may differ according to age, race/ethnicity or geographic location. No dietary patterns were associated with BMI except for the Sandwich pattern in the IMPACT study. Findings from the four COPTR studies suggest that all dietary patterns of low-income, racial/ethnic minority children can be improved in terms of diet quality and that public health messages focused on healthy substitutions, such as replacing refined grains with whole grains or cold cuts with poultry, may help youth mimic a dietary pattern associated with lower BMI.
Acknowledgements
This research was supported by grants U01 HL103561, U01 HL103620, U01 HL103622, U01 HL103629, U01 HD068890, UL 1RR024989 and NIH DK56350 from the National Heart, Lung, and Blood Institute and the Eunice Kennedy Shriver National Institute of Child Health and Development and the Office of Behavioral and Social Sciences Research. The content expressed in this paper is solely the responsibility of the authors and does not necessarily represent the official views of the National Heart, Lung, And Blood Institute, the Eunice Kennedy Shriver National Institute of Child Health and Human Development, the National Institutes of Health or the US Department of Health and Human Services. The National Heart, Lung, And Blood Institute, the Eunice Kennedy Shriver National Institute of Child Health and Human Development, the National Institutes of Health and the US Department of Health and Human Services had no role in the design, analysis or writing of this article. Support for MNL was provided by a National Heart, Lung, and Blood Institute training grant (T32 HL144456).
All authors contributed to the design of the research question. L. E. B. and S. D. J. collected data hands-on; T. N. R. and N. E. S. provided essential data sets; K. P. T. derived essential variables for this analysis, including all diet variables; M. N. L. analysed all data; M. N. L., H. L. N. and K. P. T. wrote the manuscript; D. M. M. and C. E. I. L. substantially edited the manuscript; all authors critically reviewed and edited the manuscript; M. N. L. had primary responsibility for final content. All authors have read and approved the final manuscript.
The authors declare that there are no conflicts of interest.
Supplementary material
For supplementary material referred to in this article, please visit https://doi.org/10.1017/S0007114520003852


