


In recent decades, the prevalence of type 2 diabetes mellitus (T2DM) has risen dramatically in countries of all income levels(1). China is experiencing an unprecedented epidemic of T2DM with a prevalence of up to 9·4 %(2). Middle-aged and older Chinese adults are at high risk, and the prevalence reached 20·2 % among those over 65 years(Reference Wang, Gao and Zhang3). The risk factors of T2DM are complicated, but some of those are modifiable, such as obesity, unhealthy diet, physical inactivity and smoking. Considerable evidence has highlighted the importance of dietary factors that contribute to the onset of T2DM(Reference Chatterjee, Khunti and Davies4).
Fe is a critical essential trace element in the diet, which plays a vital role in erythrocyte production, DNA replication, muscle growth, oxygen transport and diverse metabolic responsibilities. As a prooxidant and catalyst, free Fe helps to generate reactive oxygen species leading to oxidative stress(Reference Ganz5). The pancreatic β cells are particularly vulnerable to oxidative stress for their weak antioxidative defence mechanisms(Reference Simcox and McClain6). Haem Fe only comes from Hb and myoglobin in animal tissue, while non-haem Fe is found in both plant and animal products and is the only form of Fe in plants. Haem Fe is more efficiently absorbed and has a greater bioavailability than non-haem Fe(Reference Anderson and Frazer7).
Some studies have investigated the association between dietary Fe and the risk of diabetes(Reference Bao, Rong and Rong8). Results from Western developed countries have shown that haem Fe intake, which is only found in animal tissue, has been positively associated with the risk of T2DM(Reference Bao, Chavarro and Tobias9–Reference Rajpathak, Ma and Manson12). Results from north China and Chinese people in Singapore also showed a positive association between haem Fe intake and T2DM(Reference Luan de, Li and Li13,Reference Talaei, Wang and Yuan14) . Few studies have examined and found that total or non-haem Fe intake is associated with T2DM risk(Reference Bao, Chavarro and Tobias9). However, a large prospective cohort study in China showed a non-linear association between total or non-haem Fe intake with diabetes risk, but not haem Fe(Reference He, Fang and Yu15). The Western dietary pattern tends to be an animal-based diet characterised by a higher intake of meat and meat products(Reference Medina-Remon, Kirwan and Lamuela-Raventos16). The traditional Chinese dietary pattern is characterised as a plant-based diet with a higher intake of rice and vegetables, implying a low bioavailability of dietary Fe(Reference Li and Shi17). Due to economic growth and urbanisation, the Chinese dietary pattern has undergone a rapid change in recent decades. The decline in intake of plant-source foods and the increase in intake of animal-source foods are leading to a higher intake of dietary total and haem Fe(Reference Zhai, Du and Wang18). Therefore, this study aimed to examine the associations between intakes of total Fe, haem Fe and non-haem Fe with incident T2DM in middle-aged and older adults in southern urban China.
Methods
Study population
This study was based on the Guangzhou Nutrition and Health Study (GNHS), an on-going community-based prospective cohort study to investigate risk factors of CVD, diabetes mellitus, osteoporosis and other several chronic diseases. Participants were recruited through advertisements, health talks and referrals in the community of Guangzhou, China. This study recruited two batches of participants living in Guangzhou city (South China) for >5 years, between July 2008 and June 2010 and between March 2013 and August 2013, with a total of 4048 participants. Among 4048 participants, forty participants were older than 75 years old and sixteen residents did not participate in any questionnaire survey or measurement in this study. Finally, 3992 participants, aged 40–75 years, were eligible for inclusion in this study (GNHS 2008–2010, n 3158; GNHS 2013, n 834). All participants were notified by telephone to follow up every 2–3 years. Two follow-up visits were conducted for participants recruited between 2008 and 2010, and one follow-up visit for participants recruited in 2013. The study protocol of GNHS was registered in ClinicalTrials.gov (NCT03179657) and was approved by the Ethical Committee of School of Public Health, Sun Yat-sen University. Written informed consent was obtained from all participants.
Participants were excluded if they met one of the following exclusion criteria: (1) diabetes at baseline (n 312); (2) reported severe chronic disease at baseline, for example, cancer (n 27), chronic renal insufficiency (n 8), cirrhosis and chronic hepatitis (n 138); (3) without fasting glucose or glycosylated Hb (HbA1c) measurement at baseline and follow-up visits (n 174); (4) those with unreasonably high (>16 736 kJ/d (>4000 kcal/d) for males and >14 644 kJ/d (>3500 kcal/d) for females) or low (<3347 kJ/d (<800 kcal/d) for males and <2092 kJ/d (<500 kcal/d) for females) energy intake (n 43); (5) missing data on diet variables (n 29) or other variables (e.g. height, weight, socio-demographics, n 78); (6) diabetes occurring within 1 year after baseline (n 12) and (7) lost to follow-up (refusal, withdraw, serious diseases or death, n 491, follow-up rate >80 %). In total, 2696 participants were included in data analysis, with a median follow-up time of 5·6 (interquartile range 4·1–5·9) years. The flow chart of the study participants is shown in Fig. 1.

Fig. 1. Flow chart of the study participants. FG, fasting glucose.
Data collection
Trained project members conducted the face-to-face interviews in all questionnaire surveys at baseline and each follow-up visit. The questionnaire contents included: age, sex, household income, education level, history of chronic disease, smoking status, alcohol drinking, physical activity, dietary habits and so on.
A validated FFQ including seventy-nine items was used to collect information on the usual diet over the previous year(Reference Zhang and Ho19). The frequency of each food item (never, per year, per month, per week or per day) and the amount of food consumption (servings or portion sizes) were recorded. Nutrient content of all food items came from the Chinese Food Composition Table 2004(Reference Yang20). Nutrient intake was calculated by multiplying food intake by the nutrient content of the specified food portion size. The energy-adjusted Pearson correlation coefficients between the FFQ and the six 3-d dietary records ranged from 0·25 to 0·65 for nutrients and 0·30 to 0·68 for food groups. Dietary Fe intake was not specifically calculated in the previous validation study. In this study, total Fe intake was the sum of haem Fe (animal-derived) and non-haem Fe (both animal- and plant-derived). The FFQ included nineteen animal-source food items, including livestock (seven items), poultry (three items), fish (four items), mollusk (one item), shrimp and crab (two items), and mixed products (two items, containing some meat). Mix products (dumplings and stuffed bun) were disintegrated into pork and other sources(Reference Zhang, Chen and Ma21). Total meat includes red meat, processed meat and poultry. Red meat is considered as unprocessed mammalian muscle meat, like pork, beef and lamb. Haem Fe was computed as 40 % of total Fe content in all animal tissues including red meat, poultry, fish and animal organs(Reference Monsen, Hallberg and Layrisse22). Non-haem Fe was calculated by adding Fe content in all non-meat foods and 60 % of Fe content in all animal tissues, which was equal to that total Fe subtracted haem Fe.
Anthropometric measurements and blood pressure were performed by trained project members at baseline and each follow-up visit. Anthropometric measurements, including height and weight, were measured twice, and the average numbers were calculated. When height and weight were measured, participants took off shoes and coats and wore light clothing. They stood erect with back, buttocks and heels in continuous contact with the vertical height rod of the stadiometer. The horizontal headpiece was placed on top of the participant’s head to measure height with an accuracy of 0·1 cm. Weight was measured to the nearest 0·1 kg by using an electronic weighing scale. BMI was calculated as weight (kg) divided by square of height (m2). After participants had rested at least 10 min, blood pressure was consecutively measured twice on the left arm with a mercury sphygmomanometer. If the difference between two systolic or diastolic blood pressures recorded was over 4 mmHg or 3 mmHg, respectively, a third measurement was made and the mean of all the readings was used in subsequent analyses. Hypertension was defined as systolic blood pressure ≥140 mmHg, diastolic blood pressure ≥90 mmHg or self-reported hypertension medications.
Assessment of type 2 diabetes mellitus incidence
Incident cases of T2DM were identified if participants met one of the following conditions during the follow-up visits: fasting glucose ≥ 7·0 mmol/l or HbA1c ≥6·5 %, according to the American Diabetes Association criteria(23) (n 139); or self-reported diagnosed T2DM (n 66). Participants were asked the following questions in the face-to-face interviews to confirm self-reported T2DM cases during the follow-up visits: (1) ‘Have you ever been diagnosed with diabetes by your doctor?’ If yes, (2) ‘When you were diagnosed with diabetes?’ (3) ‘What type of diabetes was you diagnosed with?’ (4) ‘What was your fasting glucose on average last year?’ and (5) ‘Have you taken medicine regularly as required by your doctor in the past year?’ T2DM cases were identified until May 2017.
Measurement of fasting glucose and HbA1c
After 12-h overnight fasting, venous blood samples were collected by drawing from the antecubital vein at baseline and each follow-up visit. The blood samples were centrifuged at 3000 r/min, aliquoted and stored at –80 °C until analysed. fasting glucose was measured by the colorimetric method using a Roche Cobas 800 c702 automated analyzer (Roche Diagnostics GmbH). HbA1c was measured by HPLC using the Bole D-10 Hemoglobin A1c Program on a Bole D-10 Hemoglobin Testing System. The CV for the between-run assays were 2·5 % for fasting glucose and 0·75 % for HbA1c.
Statistical analysis
Dietary data were energy-adjusted by using the residual method to compute residuals of dietary intake by removing the variation caused by total energy intake(Reference Willett, Howe and Kushi24). Participants were divided into four groups according to sex-specific quartiles of energy-adjusted intakes of total, haem and non-haem Fe. Person-years were calculated for each participant from the date of baseline until the date of diabetes diagnosed or the date of the last follow-up visit. The differences of characteristics and dietary intake at baseline across the quartiles of dietary Fe intake were examined by using one-way ANOVA or the Kruskal–Wallis test for continuous variables, and the χ 2 test for categorical variables.
Cox proportional hazard models were used to examine the association between quartiles of dietary Fe intake and T2DM risk by taking the first quartile intake as the reference category in the multivariable-adjusted models. Model 1: adjusted for age (continuous), BMI (continuous, kg/m2), education level (≤9, 9–12, ≥12 years), household income (<500, 500–1500, 1500–3000, >3000 yuan/month per person), smoking status (non-smoker, smoker), alcohol drinking status (non-drinker, drinker) and physical activity (continuous, metabolic equivalent of energy-h/d). Model 2: adjusted for model 1 plus dietary intakes of total energy, protein, fibre, cholesterol, the ratio of PUFA:SFA, Mg, vitamin C, meat, vegetables, fruit (all in sex-specific quartiles), additionally adjusted non-haem Fe for haem Fe and adjusted haem Fe for non-haem Fe. Results were shown as hazard ratios (HR) and 95 % CI. P trend was calculated by treating the median value of each quartile of dietary Fe intake as continuous values to examine the trend of T2DM risk with increased intake of dietary Fe. We repeated the analyses to evaluate the association of haem Fe intake stratified by food sources (i.e. total meat, red meat, processed meat, poultry and fish/shellfish) with T2DM risk.
We conducted sensitivity analyses based on multivariable-adjusted models among participants recruited in two batches (GNHS 2008–2010 and GNHS 2013) separately. Restricted cubic spline was conducted to test the non-linearity association of Fe intake and T2DM risk in the multivariable-adjusted Cox regression model, but no significant non-linearity association was found. No significant interactions were found between dietary intakes of total Fe, haem Fe or non-haem Fe with age, sex, batch, baseline BMI and hypertension on T2DM risk. Therefore, no stratified analyses were performed.
Data were analysed by SPSS version 21.0 (SPSS Inc.) and STATA statistical software version 15.0 (Stata Corp.). A two-sided P <0·05 was considered statistically significant.
Results
Participants had a mean age of 57·9 (sd 5·6) years at baseline, and 70·8 % were female. During a median follow-up of 5·6 years (13 476 person-years), 205 incident cases of T2DM were identified. The median intakes of total Fe, haem Fe and non-haem Fe were 19·9, 1·2 and 18·7 mg/d among men and 20·2, 1·2 and 18·9 mg/d among women, respectively. 0·26 % of participants had a high intake of dietary total Fe (≥42 mg/d).
The baseline characteristics across the sex-specific quartiles of dietary Fe intake are presented in Table 1 and online Supplementary Table S1. Compared with the lowest quartile, participants in the highest quartile of haem Fe intake were more likely to be younger and smokers and have a lower prevalence of hypertension. No statistical differences were observed in education level, household income, alcohol drinking status, physical activity and BMI among all Fe intake groups. For dietary intake, participants in the highest quartile of total and non-haem Fe intake consumed more carbohydrate, fibre, protein, cholesterol, Mg, vitamin C, cereals, poultry, fish/shellfish, vegetables and fruit (all P < 0·001). Participants in the highest quartile of haem Fe intake consumed more protein, total fat, cholesterol, red meat, poultry and fish/shellfish, while consumed less carbohydrate, fibre and cereals compared with the lowest quartile (all P < 0·001).
Table 1. Baseline characteristics according to the sex-specific quartiles (Q) of dietary intake of iron in middle-aged and older Chinese
(Mean values and standard deviations, n 2696)

MET, metabolic equivalent of energy.
* To convert kcal to kJ, multiply by 4·84.
† Dietary data were energy-adjusted.
After adjustment for socio-demographics, lifestyle and dietary intake, the HR for T2DM risk in the highest quartiles of haem Fe intake was 1·92 (95 % CI 1·07, 3·46; P trend = 0·010), compared with the lowest quartile intake (Table 2). However, no significant association was found between intakes of total Fe or non-haem Fe with T2DM risk. Compared with the lowest quartile, the HR for T2DM risk in the highest quartile of total Fe intake and non-haem Fe intake were 1·34 (95 % CI 0·77, 2·34; P trend = 0·391) and 0·92 (95 % CI 0·52, 1·62; P trend = 0·696).
Table 2. Type 2 diabetes mellitus (T2DM) according to sex-specific quartiles (Q) of total iron intake, haem iron intake and non-haem iron intake in middle-aged and older Chinese
(Hazard ratios (HR) and 95 % confidence intervals, n 2696)
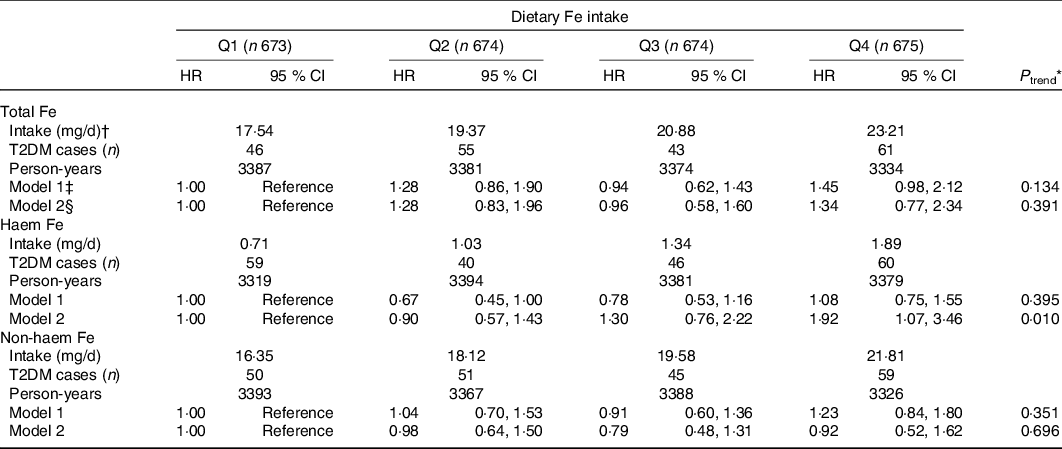
* Cox proportional hazard model was used to calculate P for trend by treating the median values of dietary Fe intake in quartiles as continuous values.
† Dietary Fe intake was shown as median intake value of each quartile.
‡ Model 1: Adjusted for age (continuous), education level (≤9, 9–12, ≥12 years), household income (≤500, 501–1500, 1501–3000, >3000 yuan/month per person), smoking status (non-smoker, smoker), alcohol drinking status (non-drinker, drinker), physical activity (continuous) and BMI (continuous).
§ Model 2: Adjusted for model 1 plus intakes of total energy, protein, fibre, cholesterol, the ratio of PUFA:SFA, Mg, vitamin C, meat, vegetables and fruit (all in sex-specific quartiles). Additionally adjusted non-haem Fe for haem Fe and adjusted haem Fe for non-haem Fe.
The association between haem Fe intake stratified by food sources with T2DM risk is presented in Table 3. The adjusted HR for T2DM for haem Fe from total meat was 2·74 (95 % CI 1·22, 6·15; P trend = 0·011), compared the highest quartile with the lowest quartile. For haem Fe intake from red meat, the participants with the highest quartile had 86 % (HR 1·86; 95 % CI 1·01, 3·44; P trend = 0·034) higher risk for T2DM, compared with the lowest quartile, while no significant associations were found in haem Fe intake from processed meat (HR 1·05; 95 % CI 0·71, 1·56; P trend = 0·809), haem Fe intake from poultry (HR 1·05; 95 % CI 0·68, 1·62; P trend = 0·801) or haem Fe intake from fish/shellfish (HR 0·81; 95 % CI 0·49, 1·33; P trend = 0·280).
Table 3. Type 2 diabetes mellitus (T2DM) according to sex-specific quartiles (Q) of haem iron intake from different food sources in middle-aged and older Chinese
(Hazard ratios (HR) and 95 % confidence intervals, n 2696)
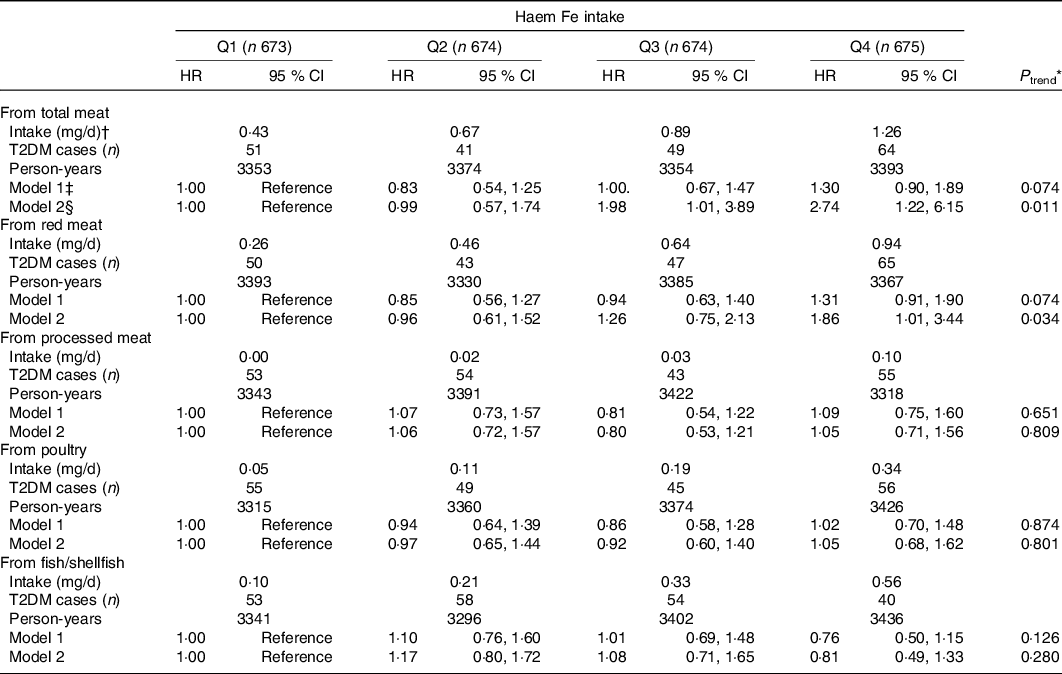
* Cox proportional hazard model was used to calculate P for trend by treating the median values of dietary Fe intake in quartiles as continuous values.
† Dietary haem Fe intake from dietary sources was shown as median intake value of each quartile.
‡ Model 1: Adjusted for age (continuous), education level (≤9, 9–12, ≥12 years), household income (<500, 500–1500, 1500–3000, >3000 yuan/month per person), smoking status (non-smoker, smoker), alcohol drinking status (non-drinker, drinker), physical activity (continuous) and BMI (continuous).
§ Model 2: Adjusted for model 1 plus intakes of total energy, protein, fibre, cholesterol, the ratio of PUFA:SFA, Mg, vitamin C, meat, vegetables and fruit (all in sex-specific quartiles).
The baseline characteristics across the two batches are presented in Supplementary Table S2. No significant interaction was found between dietary intakes of total Fe, haem Fe or non-haem Fe with batch on T2DM risk (P interaction = 0·340, 0·306, 0·710, respectively). No substantial difference in sensitivity analyses was found among participants recruited from the GNHS 2008–2010 (n 2238). However, no association was found between dietary Fe intake and T2DM risk in the GNHS 2013 (n 458), which might be explained by the small sample size (online Supplementary Table S3 and Table S4).
Discussion
In this prospective cohort study with over 5-year follow-up, we found that dietary intake of haem Fe (especially from red meat) was positively associated with T2DM risk in middle-aged and older Chinese adults. However, no significant association was found between total Fe or non-haem Fe intake with T2DM risk.
Our findings were consistent with an umbrella review of meta-analyses, which reported the association of higher haem Fe intake with increased diabetes risk, but no clear association was found for total Fe(Reference Neuenschwander, Ballon and Weber25). Many studies had observed a significant and positive association between haem Fe intake and T2DM risk(Reference Bao, Chavarro and Tobias9,Reference Talaei, Wang and Yuan14,Reference White and Collinson26) . As for total Fe and non-haem Fe intake, the null associations observed in this study were consistent with findings in a meta-analysis (including four studies in Western developed countries and one study in China)(Reference Bao, Rong and Rong8). Contrary to the results of this study, two prospective cohort studies (conducted among Chinese adults and middle-aged and older Japanese adults) suggested that intakes of dietary total and non-haem Fe were associated with T2DM risk, but not haem Fe(Reference He, Fang and Yu15,Reference Eshak, Iso and Maruyama27) . As mentioned above, the results from China were inconsistent(Reference Luan de, Li and Li13,Reference Talaei, Wang and Yuan14) . Cross-sectional findings obtained by Shi et al. also reported the positive association between intakes of total Fe and non-haem Fe with diabetes, and haem Fe intake was found no association(Reference Shi, Hu and Yuan28,Reference Shi and Pan29) . However, a prospective study by Shi et al. reported that high haem Fe intake was associated with hyperglycaemia, and the association between total Fe and hyperglycaemia was significant in men but not women(Reference Shi, Zhou and Yuan30).
In this study, we only found that higher haem Fe intake was associated with greater T2DM risk, but not total Fe and non-haem Fe. Dietary intakes of total Fe and non-haem Fe in this study analysis were higher than those in the Western countries(Reference Tzoulaki, Brown and Chan31,Reference Samaniego-Vaesken, Partearroyo and Olza32) . However, the prevalence of participants with total Fe intake above 42 mg/d (the tolerable upper intake level) was only 0·26 %. Non-haem Fe was close to 94 % of total Fe intake so that the absorption of dietary total Fe may be most dependent on non-haem Fe. Dietary components, such as phytate, oxalate, polyphenols, animal protein, vitamin C, could affect the absorption of non-haem Fe with estimated 1–20 % bioavailability. However, haem Fe is less dependent on the general composition of a diet with estimated 15–35 % bioavailability. Consequently, haem Fe can contribute to over 40 % of the total absorbed Fe in diet(Reference Hurrell and Egli33,Reference Collings, Harvey and Hooper34) . Haem Fe intake has been previously shown a positive association with body Fe store, while non-haem Fe intake has been previously shown no association(Reference Timmer, de Groot and Rijnhart35–Reference Fleming, Jacques and Dallal37). Other studies have reported a positive association between non-haem Fe intake and Fe stores, but haem Fe had a stronger association than non-haem Fe(Reference Young, Parker and Rangan38). The differences in the bioavailability and the ability to raise body Fe stores might partly explain why only haem Fe intake was associated with T2DM(Reference Bao, Rong and Rong8). In this study, the median haem Fe intake (1·2 mg/d) was lower than that in European (1·8 mg/d)(Reference Rajpathak, Ma and Manson12), but it was higher than that in Japanese (0·2 mg/d)(Reference Eshak, Iso and Maruyama27) and that in a large sample of Chinese adults (0·75 mg/d for men and 0·65 mg/d for women)(Reference He, Fang and Yu15). In Japan, high fish intake contributes to most of the haem Fe (45 % haem Fe comes from fish), but haem Fe largely comes from red meat in Western developed countries and China. On the other hand, findings from a large sample of Chinese adults reported that non-haem Fe and total Fe showed non-linear associations with diabetes risk. At relatively low levels of non-haem or total Fe intake, a negative correlation between intake and diabetes risk was reported, but when non-haem Fe intake exceeded 41 mg/d or total Fe intake exceeded 46 mg/d, higher intake increased diabetes risk in men(Reference He, Fang and Yu15). Cross-sectional findings obtained by Shi et al. reported that the highest (mean, 40·2 mg/d) v. the lowest (mean, 15·4 mg/d) quartile of total Fe intake was associated with diabetes risk(Reference Shi, Hu and Yuan28,Reference Shi and Pan29) . However, in this study, the highest and the lowest quartile of total Fe intake were 23·8 mg/d and 17·3 mg/d (mean), respectively. The association between total Fe or non-haem Fe with diabetes may be dose-dependent, and low intake may not pose a risk. Besides, participants from this study were middle-aged and older adults living in an urban city, while the majority of participants from other studies from China were adults aged over 20 years, which may affect the results. Furthermore, compared with the lowest quartile of haem Fe intake, participants with the highest quartile consumed more total fat, less fibre (Table 1), which might increase the risk of T2DM. However, participants in the highest quartile of total or non-haem Fe intake were likely to have a better dietary pattern with more fibre, vitamin C, Mg, vegetables, fruit and less total fat (Table 1), and it might prevent the incidence of T2DM. Although we adjusted these variables in multivariable-adjusted models, the differences in dietary patterns among groups could not be ignored.
We found that intakes of haem Fe intake from total meat and red meat were associated with T2DM risk, but not haem Fe intake from processed meat, poultry or fish/shellfish. Few studies have examined the association between T2DM risk and haem Fe from different food sources. A meta-analysis of ten cohort studies suggested that meat intake, including total meat, red meat and processed meat, was associated with T2DM risk(Reference Aune, Ursin and Veierod39). A cohort study in the Singapore Chinese population found that the HR for diabetes were 1·23 (95 % CI 1·14, 1·33) for red meat intake and 1·15 (95 % CI 1·06, 1·24) for poultry intake after adjusting for haem Fe intake. Meanwhile, haem Fe intake was associated with T2DM risk(Reference Talaei, Wang and Yuan14), which was consistent with this study. In a prospective study in the USA, researchers observed that haem Fe from red meat was positively associated with the metabolic syndrome and CVD(Reference Otto, Alonso and Lee40), but not haem Fe from other food sources. Although we assumed a haem Fe content of 40 % of total Fe in animal tissues, meat contains a higher level of Hb and myoglobin than fish; thus, the percentage of haem Fe in meat is higher than fish(Reference Monsen, Hallberg and Layrisse22). Besides, rich in total fat, saturated fat and other potential nutritional components(Reference Misra, Balagopal and Raj41,Reference Ekmekcioglu, Wallner and Kundi42) , red meat may independently or synergistically interact with haem Fe to affect glucose metabolism. Poultry and fish are health substitutions of red meat and processed meat to help decrease the risk of developing T2DM(Reference Ibsen, Warberg and Wurtz43). Red meat, especially fresh fatty pork, is the main component of total meat intake in China(Reference He, Yang and Xia44); red meat was close to 76 % of total meat in this study. Besides, the null association between haem Fe from processed meat, poultry or fish/shellfish with T2DM risk may be partly explained by the lower haem Fe intake from these food sources than red meat in the present study (the median haem Fe intake from different food sources was 0·78 mg/d for haem Fe intake from total meat and 0·54 mg/d from red meat; 0·02 mg/d from processed meat; 0·15 mg/d from poultry; 0·26 mg/d from fish/shellfish).
In healthy individuals, the amount of Fe in the body is controlled by its absorption, mobilisation, storage and recycling, but Fe excretion is not actively regulated(Reference Gozzelino and Arosio45). Dietary Fe intake might increase Fe absorbed by the intestine and body Fe stores(Reference Fernandez-Real, McClain and Manco46); studies have previously reported a positive association between dietary Fe intake and body Fe status(Reference Timmer, de Groot and Rijnhart35,Reference Young, Parker and Rangan38) . Fe could trigger inflammatory responses and promote reactive oxygen species generation(Reference Dutra and Bozza47,Reference Dos Santos Vieira, Hermes Sales and Galvao Cesar48) . Reactive oxygen species could cause pancreatic β cell apoptosis(Reference Simcox and McClain6) and impair the sensitivity to insulin in the liver and muscle(Reference Huang, Jones and Luo49). Both non-haem Fe and haem Fe may contribute to generating reactive oxygen species. However, we only found that haem Fe intake was associated with diabetes risk. Haem Fe intake might represent red meat intake in this study. Our results suggested that higher haem Fe intake from red meat was associated with higher T2DM risk, but not haem Fe intake from processed meat, poultry or fish/shellfish (Table 3). An umbrella review of meta-analyses has reported that a higher intake of red meat was associated with an increased incidence of diabetes with high quality of evidence(Reference Neuenschwander, Ballon and Weber25). Red meat is a rich source of total fat, saturated fat and other potential nutritional components, which could increase insulin resistance(Reference Ekmekcioglu, Wallner and Kundi42). Haem Fe might be the substitute marker of red meat consumption in this study.
To our knowledge, few prospective studies focused on the association between dietary Fe intake and T2DM risk in middle-aged and older Chinese adults. The strengths of this study include the prospective study with over 5-year follow-up period, the high rate of follow-up (>80 %). The face-to-face interviews were conducted by trained project members to collect data on dietary intake using a validated FFQ. Besides, we adjusted for a variety of socio-demographics, lifestyle and dietary factors to reduce the potential confounding effects. However, there are several limitations in this study. First, we analysed dietary Fe intake at baseline, but we did not analyse the change of dietary Fe intake during the study period. In addition, although these Fe intakes of this study were almost comparable to the intakes from other studies from China, dietary Fe intake was not specifically calculated in the previous validation study. Second, we did not analyse Fe metabolism biomarkers and inflammatory markers for participants so that we cannot include them in data analysis. As a confounding factor, Fe metabolism mediates the association between Fe intake and T2DM risk. Although participants in this study were free of severe chronic diseases (i.e. cancer, chronic renal insufficiency, cirrhosis and chronic hepatitis), the inflammatory status of participants was not measured and inflammatory markers may affect Fe absorption. Third, we did not collect information on supplemental Fe intake, drug or occult blood loss, which might affect body Fe stores and mediate the results. Fourth, an oral glucose tolerance test was not conducted to identify T2DM, so there may be undiagnosed T2DM cases.
Conclusions
We found that higher haem Fe intake (especially from red meat) was positively associated with T2DM risk in middle-aged and older adults in urban China, while dietary intakes of total and non-haem Fe were not significantly associated with T2DM risk. Controlling haem Fe and red meat intake may be a target to prevent T2DM in the middle-aged and older population. More experimental studies need to be done to explore the underlying mechanism in the future.
Supplementary material
For supplementary material referred to in this article, please visit https://doi.org/10.1017/S0007114520005048
Acknowledgements
The authors are very grateful to all the participants and staff who contributed to this present study.
This work was supported by the National Natural Science Foundation of China (no. 81773415) and the Key Project of Science and Technology Program of Guangzhou, China (no. 201704020035). Sponsors had no role in the design, analysis or writing of this article.
H.-L. Z. and A.-P. F. formulated the research question and contributed to study design. R.-H. Z., J.-A. L., F. W. and X.-T. L. participated in carrying out the experiments and collecting the data. S.-Y. L., R.-H. Z., J.-A. L. and X.-T. L. analysed the data. S.-Y. L., F. W. and A.-P. F. wrote and revised the paper. All authors had read and approved the final version of this manuscript.
There are no conflicts of interest to declare.


