

Over the last two decades, while international climate change diplomacy reached a deadlock, global ozone governance has been comparatively successful. Through the 1990 London Amendment to the Montreal Protocol (opened for signature in 1987), the international community agreed to phase out the use of chlorofluorocarbons (CFCs), halons and carbon tetrachloride. Regulations extended also to new ozone-depleting substances and to substitutes that were powerful greenhouse gases (HCFCs and HFCs). While concerns have arisen around measurements showing illegal production of CFC-11 in China and the use of methyl bromide in pest control, several scholars have nonetheless argued that the protection of the ozone layer is one of the success stories in global environmental diplomacy.Footnote 1 Indeed, the Montreal Protocol created a consensual and powerful legal and material framework capable of preventing the emission of any significant ozone-depleting substance in the world in the medium term.
However, when the main CFC producers and consumers signed the protocol in 1987, they did so in the absence of a scientific consensus concerning the actual mechanisms of annual ozone depletion in Antarctica. Several factors have been suggested to explain this. Historians, for example, have identified material reasons that facilitated the regulations. Substitutes for CFCs were first developed by industry in countries that had regulated some uses of these substances, in particular the United States, where the so-called ‘non-essential aerosol propellants’ had been banned by 1977.Footnote 2 International-relations (IR) scholars have described countries as complying with their own national interests. For instance, they emphasized the fact that the consortium named the ‘Toronto group’ (comprising in late 1985 the United States, Canada, Norway, Sweden, Finland, Denmark, Switzerland, Australia and New Zealand), which was actively pushing for regulation in the mid-1980s, notably included, from 1983 onwards, the United States. As the world's main CFC producer and consumer, and diplomatic power, it was only consistent that the US would support internationally ‘what it had already implemented domestically’, and its ‘industry had also already demonstrated that alternatives to CFC propellants were technically and economically feasible’.Footnote 3 Opposed to the Soviet Union, Japan and the European Commission (EC), the Toronto group managed in 1985 to convince parties to authorize ‘UNEP to convene technical workshops on CFC growth and control options, and to reconvene Protocol negotiations, aiming for completion within two years’.Footnote 4 The track was thus set to keep negotiations open, to be informed by the latest scientific findings.
Other IR and science policy scholars have identified important social dimensions structuring the ozone research community during the 1980s. For instance, according to science policy scholar Peter Haas, the ozone community can best be described as an international ‘ecological epistemic community’ that gave decisive impetus to ozone research and governance. This informal community was heterogeneous. It involved atmospheric scientists, such as British scientist Robert ‘Bob’ Watson and the American researcher Richard Stolarski; the Egyptian microbiologist and executive director of the United Nations Environment Programme (UNEP) Mostafa Tolba; several US Environmental Protection Agency members, such as Lee Thomas and Stephen Andersen, and their European counterparts; and diplomats, such as US delegation leader Richard Benedick. Yet, as Haas has argued, all its members shared key epistemic values, such as the confidence in scientific knowledge on stratospheric ozone and the legitimacy of the precautionary principle, and they all agreed to promote the immediate signing of a global agreement.Footnote 5
This epistemic community approach also reveals the need to further analyse the rhetorical arguments at stake in the negotiations. Thus, in paying close attention to discursive practices, political-science scholar Karen Litfin stressed the importance of ‘the subjective understandings of state and non-state actors as the source of interests and action’, focusing on ‘linguistic practices and rhetorical strategies embedded in a network of social relations’.Footnote 6 She rightly stressed the decisive role of ‘knowledge brokers’ within the ozone arena which helped bridge the gap between science and policy circles.Footnote 7 However, a crucial dimension of the ozone debate remains undeveloped: the role of non-textual resources, in particular the role of images, in building scientific consensus, environmental diplomacy and public awareness.Footnote 8
We believe that this dimension, discussed briefly in the early work of Rainer Grundmann and more recently in the field of rhetoric and media studies, will prove extremely useful for developing historical perspectives on ozone diplomacy, as well as more broadly for environmental diplomacy, particularly the emergent field of ‘visual diplomacy’.Footnote 9 Pioneering work in the history of science, and science and technology studies (STS), has already demonstrated that images fulfil far more than purely illustrative functions and that they are always both objects and instruments of scientific knowledge.Footnote 10 In particular, case studies of satellite images – the focus of this paper – have successfully stressed their narrative and political functions in conveying global environmental change.Footnote 11 Visuality may contribute there to creating a heightened awareness of particular natural events, ‘working on the multitude and cultivating iconic images with a lasting impact on them’.Footnote 12 Particularly relevant is the fact that scientific images can be appropriated by non-scientific actors and circulate in many different arenas, thus effectively bridging cultural and disciplinary boundaries, as much of the recent work on climate change images and climate model visualizations carried out by scholars in geography, history of science, STS, science policy and rhetoric has demonstrated.Footnote 13
In this article, we analyse the circulation and appropriation processes of the early images, both still and moving, of the Antarctic ozone hole created by engineers and scientists at NASA's Goddard Space Flight Center (GSFC), and published between the announcement of its discovery and the signing of the Montreal Protocol (16 May 1985–16 September 1987). Whereas negotiators claimed that they chose to deliberately ignore the ozone hole during the negotiations since no consensual theory was yet able to explain it, we demonstrate that ozone hole images did circulate widely in the two years leading up to the signing of the Montreal Protocol. By late 1985, NASA's Total Ozone Mapping Spectrometer (TOMS) satellite maps had been widely publicized by journalists, and were hence readily available to anyone. Significantly, they were also widely circulated in academia, shown during Senate hearings, included in assessment reports, and used in keynote presentations to politicians and diplomats. In other words, scientific visualizations of the ozone hole, and NASA's satellite images in particular, were present in all strategic places throughout this crucial period of the negotiation process. In conjunction with the powerful ‘ozone hole’ metaphor, they helped create what Karen Litfin aptly called ‘a sense of crisis’ amongst many influential actors, including the negotiators to the Montreal Protocol.Footnote 14 We thus argue that the diffusion of powerful images of the ozone hole played a key role in the unfolding of the negotiations, in particular by legitimizing the precautionary principle famously adopted in the protocol. As key tools of visual diplomacy, the production, distribution, mobilization and appropriation of the ozone hole images deserve our close attention in order to better understand how visual diplomacy was put into practice during the ozone negotiations.
In the first part of the article, we examine the creation during the 1980s of the expert networks that were needed to build a firm scientific basis for ozone regulations, and which created important connections between science and policy arenas. We show that from 1985 onwards, satellite images became crucial within these networks as they helped to convey a sense of urgency and to convince numerous actors of the reality and urgency of the ozone crisis. In the second part, we show that this development was accompanied and reinforced by the press coverage of ozone hole images in Western countries from late 1985 onwards, followed by other popular and mass media outlets that used the images to convey new messages to the broader public. Thus the direct use of images made by scientists and the publication of ozone imagery not only had an impact on a select group of scientists and diplomats; they also played a broader role as tools of ‘public diplomacy’ by shaping public opinion, thus also influencing in turn diplomatic activities. In both cases, we show that the scientists and scientific agencies designed their images to create a sense of urgency and played an active, decisive role in the distribution of them. By focusing on the specific modes of production and distribution of satellite imagery and their influence on diplomatic work, this article contributes to the emerging field of ‘visual science diplomacy’ promoted in this special issue.
NASA's satellite images as tools of visual diplomacy in the expert and international negotiation arenas
In his personal account of the international ozone negotiations, US chief negotiator to the Montreal Protocol Richard Benedick claimed that the negotiators chose to deliberately ignore the Antarctic ozone hole findings since no scientific theory was available to explain its mechanisms.Footnote 15 Many US government sources and numerous oral-history interviews conducted with government officials, scientists and negotiation participants confirm this official negotiation strategy which the US, as the negotiation leader, successfully imposed upon the Montreal negotiation process.Footnote 16 As environmental-policy scholar Edward Parson aptly put it, ‘All records of the negotiations, and the scientific advice being offered to them, are consistent with the widely reported claim that negotiators did not consider the Antarctic ozone hole’.Footnote 17 Indeed, one major problem was that stratospheric ozone measurements were highly heterogeneous and showed contradictory evidence.Footnote 18 The main argument was thus that if contradictory evidence emerged from Antarctic ozone research, it could put the entire negotiation process at risk. The evolution of stratospheric ozone in time over Antarctica during the first part of the 1980s was the first measured evidence of an ongoing destruction of the ozone layer; yet, in the negotiations, model predictions of mean ozone depletion at a global scale were continually favoured over the phenomenon at the South Pole because of the scientific uncertainties attached to the observations in Antarctica and to the causes of the phenomenon occurring there.Footnote 19
However, as we show here, measurements documenting an unexpected phenomenon over the South Pole did play a crucial role in the negotiations, as well as scientific images of the Antarctic ozone hole produced by NASA. What is more, oral-history interviews with the negotiators and scientists indicate that such images circulated widely and were informally included in the negotiations, with NASA's Bob Watson playing the role of an influential go-between.Footnote 20
Three NASA-led Antarctic field studies conducted in 1986 and 1987 (National Ozone Expedition (NOZE) I and II and the Airborne Antarctic Ozone Experiment, (AAOE)) were necessary in order to identify the role of heterogeneous chemistry in ozone depletion, as well as of the polar vortex and of polar stratospheric clouds, which all play a role in the annual creation of the Antarctic ozone hole. However, the latest findings from Antarctica were not shared with the negotiators during the final round of talks in early September 1987. In particular, the important results of NOZE II were not communicated before the press conference in Washington on 30 September 1987.Footnote 21
Nonetheless, the negotiators in Montreal could still rely on recent assessments of the most important scientific findings in international ozone research. First, the British Antarctic Survey's (BAS) discovery of annual stratospheric ozone depletion above Halley Bay, a British research station on the Antarctic continent, was published in Nature in May 1985.Footnote 22 Moreover, several studies published in the main scientific journals in 1986–7 reinforced the BAS's results. All studies reported significantly declining total ozone values during Antarctic spring over the previous five or six years. Finally, when the State University of New York (SUNY) team communicated its latest results in Nature on 30 July 1987, it stressed in a final sentence that the observations left ‘little doubt that the development of the Antarctic ozone hole involves chlorine chemistry as a direct and prominent feature’, implying that human activities were very likely responsible for the worrisome phenomenon.Footnote 23
Although the BAS announcement, as ozone team leader Joseph Farman recalls, did not attract immediate attention from academia or the press, the rapid confirmation of the findings by NASA researchers did have far-reaching implications.Footnote 24 This was mostly due to the fact that as an outcome of the Vienna Convention for the Protection of the Ozone Layer signed in March 1985 and laying out the roadmap to Montreal, international ozone assessments were organized under NASA's leadership. In particular, the leading role of British scientist Bob Watson merits special attention here. A well-respected atmospheric chemist specializing in ozone science and working at the time for NASA's Jet Propulsion Laboratory (JPL), Watson was invited to chair the scientific assessment reports. He personally pushed for considerable harmonization, technical standardization and most importantly internationalization of ozone assessment efforts.Footnote 25 Indeed, until the late 1970s, ozone assessments were organized solely on a national basis, mostly with only one scientific institution involved. The scientific conclusions of the assessments were thus highly vulnerable to contestation.
Because they were the outcome of a truly international, common scientific effort (an effort in which the sponsoring institutions had no say on the scientific outcome), the so-called ‘Blue Books’, the first international assessment report on atmospheric ozone, were much less vulnerable to critique.Footnote 26 Comprising three volumes and published in 1986 just before the Montreal negotiations started, they used the ‘ozone hole’ metaphor (on several occasions) only in connection with the recent volcanic eruption of El Chichon in 1982, and atmospheric circulation anomalies linked to El Niño.Footnote 27 However, several NASA-produced TOMS satellite maps were included in colour, showing the spatial evolution of Antarctic ozone depletion over time during austral spring.Footnote 28
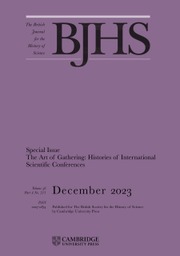
Those early, colourful ozone maps were indeed very important because they had a considerably larger impact than the first ozone depletion announcement by the BAS team published earlier that year. In the BAS's initial Nature paper, published in 1985, the British researchers used the far less impressive notion of ‘ozone depletion’ in conjunction with a simple graph revealing a local decline in stratospheric ozone, as opposed to the global metaphor of the ‘ozone hole’ which resurfaced in the press only once NASA's satellite views of the southern hemisphere were made available. Thus it was from NASA's global satellite perspective that one could see a clearly visible ‘hole’ in the sky.Footnote 29 This was mostly achieved with the skilful use of different visualization techniques, in particular through the introduction of contour lines in conjunction with what is now known as ‘false colour’. The false-colour imaging technique consists in assigning arbitrary colours to specific value intervals (in this case measured ozone value intervals). Thus scientists of NASA's ozone team at GSFC transformed the 140,000 daily ozone measurements into maps, homogenizing visualized space first by connecting equal values with the help of contour lines, and second by choosing intervals large enough to allow only a very limited number of false colours to be assigned to each value range. The resulting satellite maps dramatically revealed the immense size of annual ozone destruction, covering, at its peak, the entire Antarctic continent. The actual choice of the colour palette, in particular the introduction of vivid colours such as yellow and red (Figure 1), immediately drew the reader's attention to the centre of the image, where the ozone hole was located, potentially supporting diplomatic goals by this visual spotlight on the object of urgency.Footnote 30 NASA's satellite images were thus central to the profound reframing of the ozone issue into a global environmental threat, just as the negotiations started.
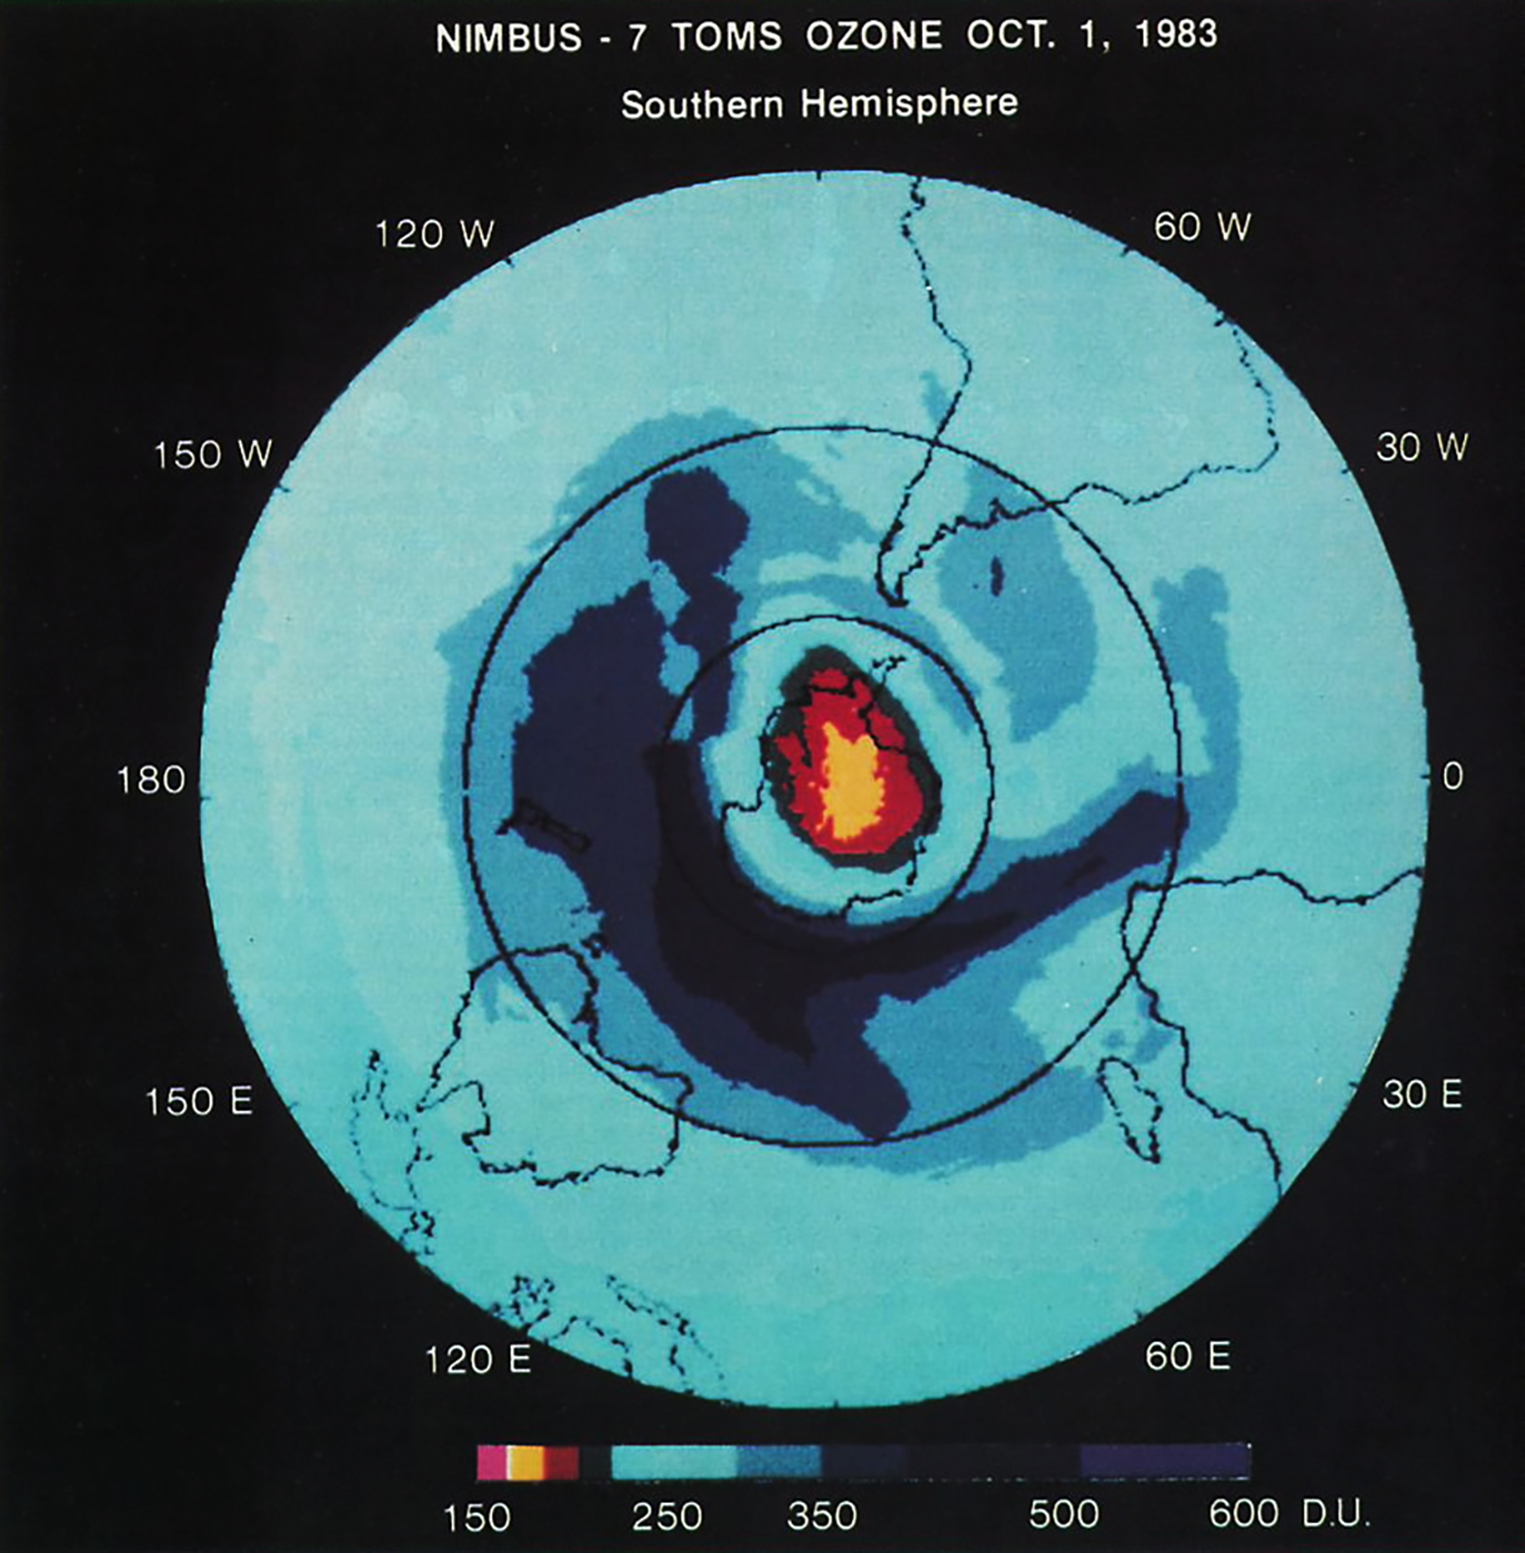
Figure 1. First-published TOMS satellite map showing total ozone above the Antarctic region for 1 October 1983 (NASA).
Indeed, Joseph Farman, the lead author of the BAS's Antarctic ozone depletion announcement, recalls that NASA's satellite maps, published later that year, triggered the first important public reactions to their Nature article. Interestingly, the first official response came through diplomatic, rather than scientific, channels. In October 1985, several months after the BAS's publication, the US embassy in London called Farman, inviting him to meet Bob Watson, who wanted to share the latest TOMS satellite maps with his ozone team. Adrian Tuck from the UK Meteorological Office also attended this meeting at the US embassy in London, where he complimented Farman on the BAS's findings. In Tuck's eyes, NASA's satellite images now clearly confirmed the BAS's results. As Farman recalls, it was from this important embassy meeting in London onwards that things accelerated considerably.Footnote 31 The ozone hole was becoming a hot topic.
The crucial importance of these images can also be observed in the early scientific assessment reports. Published in mid-1986 under the leadership of Bob Watson, the Blue Books were very important in at least two ways. First, they established a scientific consensus that the ozone threat was real. Second, by being included in a big international expert report, NASA's powerful satellite views of ozone destruction now legitimately entered the arena of policy and international negotiation. As US chief negotiator Richard Benedick later acknowledged, the international ozone assessment reports played ‘an essential role in informing and building policy’.Footnote 32 To be sure, the modelling community needed some time to integrate the BAS's latest findings, but NASA's global satellite views now started to circulate rapidly from late 1985 onwards, reframing the ozone debate as a global threat, leading one observer even to claim that ‘the hole transformed the overall tone of the ozone debate dramatically’.Footnote 33
NASA's satellite images were thus central to a profound reframing of a local depletion phenomenon into a global environmental risk. Indeed, the ozone hole might have never come to be considered in the way it was were it not for the introduction of time-lapse images, released by NASA first in the form of what information design specialist Edward Tufte called ‘small multiples’.Footnote 34 Small multiples are a series of graphics that look very much like still frames of an animated movie. They are used in many scientific and technical publications and a typical example is shown in Figure 2. With small multiples, the same combination of variables is repeatedly pictured, thus privileging change in measurement over time. As the design of the images remains unchanged, attention is directed almost exclusively to shifts in data (in Figure 2 to declining ozone values). So these image series, frequently used by NASA in their early articles, which confirmed the British findings, ‘effectively legitimized a discursive speculation about planetary risk [in particular through translating] scientific uncertainty into risk’.Footnote 35 These images thus considerably reinforced a new sense of urgency.
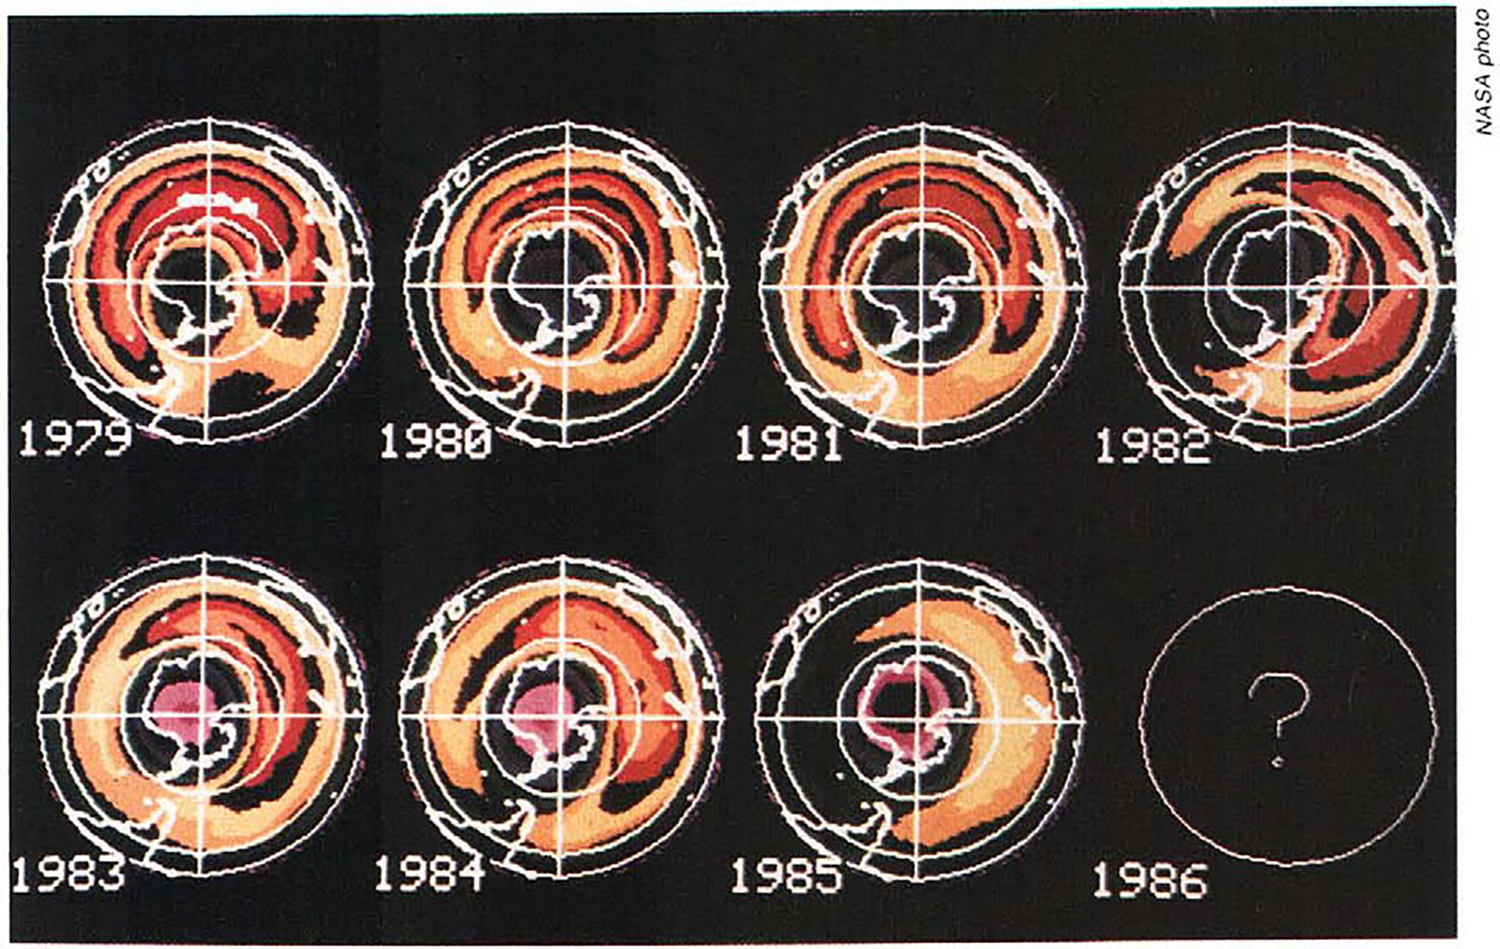
Figure 2. Total ozone maps showing increasingly declining ozone values above the Antarctic continent. Chemical & Engineering News (1986) 64(47), p. 19.
Bob Watson, coming from NASA and in his function as chairman of the first international ozone assessment, was very aware of the crucial influence that these scientific visualizations could have not only on scientists but also on negotiators. In an oral-history interview conducted by sociologist Rainer Grundmann, Watson confirmed that the recurring nature of the ozone hole, combined with its continental size, rendered colourfully in the early TOMS satellite visualizations, had an important impact on the negotiators, especially on EC delegates.Footnote 36 What is more, Watson himself played an active role in this. In fact, in the ozone case, Watson's role might best be described as that of an influential ‘go-between’ (or one may also say ‘knowledge broker’, in the sense of Litfin), working at the crucial interface between science and policy. As a NASA employee, he had direct access, well before any other scientists, to the latest results of the satellite group led by Donald Heath at GSFC, Maryland. The group had built the TOMS instrument for the Nimbus-7 satellite and produced by late 1984 the first experimental maps of declining ozone levels in the southern hemisphere.Footnote 37 Watson not only frequently used these images to convince other scientists of the urgency and the global nature of the ozone threat (as argued above), but also turned to the satellite images as informal negotiation tools within the diplomatic arena.
For instance, as one delegate remembers, at the beginning of the negotiations in Montreal, ‘Watson made presentations … showing pictures of the ozone hole’.Footnote 38 So if we follow Grundmann's line of argument, this strongly suggests that the Antarctic ozone hole and in particular NASA's powerful ozone visualizations were informally included in the negotiations. The same delegate also recalls that even though the ozone hole and its images were excluded from the official negotiations, their informal inclusion nonetheless had a lasting impact on the delegates: ‘Even if it was decided not to use that information [within the negotiations] … [i]t is like in a trial when someone says something and the judge will say “We'll have that stricken from the record”. But the jury heard it. You can strike it from the record but it's in their brain’.Footnote 39 Although Watson, as chairman of the ozone assessments, was firmly committed to adopting a ‘neutral’ position without publicly providing concrete policy recommendations (unlike more outspoken scientists, such as Sherwood Rowland), his frequent use of satellite maps suggests otherwise. Watson understood quickly that in this context, images were much more effective than words as a diplomacy device. Hence, from the embassy meeting in October 1985 onwards, he consistently used visual diplomacy to persuade other negotiators. As NASA's satellite images dramatically revealed the urgency of the ozone crisis – in directing the viewer's attention to the increasing damage human emissions were causing – opposing CFC regulations became more and more difficult.
During these informal screenings, it is also likely that Watson used not only still images but also early moving images which were produced by the GSFC ozone team.Footnote 40 As early as late 1985, former NASA scientist Mark Schoeberl managed to animate the TOMS maps with the help of an automatic camera, adding a highly dynamic and, again, very dramatic element to the presentation.Footnote 41 As we will show in the next section, those early ozone hole animations rapidly became popular in the media and were widely distributed. They underlined and made visible the highly dynamic and, perhaps most importantly, recurrent nature of this global environmental phenomenon, giving weight to diplomatic arguments in favour of rapid drastic regulations.
It is thus fair to say that the use of satellite images in the scientific and diplomatic arenas had at least two effects. First, they translated an otherwise invisible threat into a visible one and effectively reframed the issue as an urgent global environmental threat. In particular, NASA's satellite images contributed to the transformation of a local depletion phenomenon (at first only observed at one British research station on the Antarctic continent) into a truly planetary threat, even helping to convince the scientists themselves of the global nature of ozone depletion. Second, because of the role they played in the diplomatic arena as informal negotiation tools, these images contributed as crucial tools of visual diplomacy to a shift towards the precautionary principle, making it more and more difficult to argue against the regulation of CFCs.
Visual diplomacy as public diplomacy: scientific ozone hole images, public opinion and the ozone negotiations
The release of the ozone hole story in 1985 had two important implications for public opinion. First, after having prematurely closed the controversy over ozone layer destruction in the late 1970s, the media hastily reopened it. As sociologist Stephen Zehr has shown, scientists succeeded in maintaining ‘the cognitive authority of science’ at this crucial moment, despite the fact that their earlier conclusions had been proven wrong. They argued in the press and Congressional hearings that prior incorrect claims about ozone depletion were mostly linked to ‘incorrect models’. Both popular-science columnists (e.g. in Science News) and general press journalists (e.g. in the New York Times) helped scientists to convey this view and thus to maintain their authority.Footnote 42
Maintaining authority was indeed crucial at this time as scientists now were often voicing deep concern which was translated and amplified in the media into legitimate public concern, helping build pressure also on the ongoing negotiation process in favour of political action.
Second, public actors now had scientific visualizations of this global environmental threat at their disposal. Whereas non-scientific images of the ozone hole (such as cartoons) became widespread only after the signing of the Montreal Protocol, many important media outlets around the world mobilized NASA's satellite images relatively quickly after their release in late 1985, spreading the news of the discovery of the ozone hole not only among policy makers but also among the general public.Footnote 43 Thus the forming of renewed representations and political expectations in the media was an important element of public diplomacy.
In this second part, we therefore argue that the shaping of public opinion in the media through the use of scientific ozone visualizations had an important impact on the ongoing ozone negotiations. From late 1985 onwards and until the signing of the Montreal Protocol in September 1987, NASA's satellite animations played a key role, as systematic analysis of visual material gathered from audiovisual news and television archives in France, Germany, Switzerland and the United States shows. Our analysis thus complements earlier important work conducted by Rainer Grundmann on the ozone issue in the print media in the United States and Germany. Grundmann's key findings were a rapid increase in 1986 and 1987 of ozone articles published in the US national press (i.e. the New York Times, the Washington Post, the Financial Times), with a clear preference given to reporting on politics and the negotiations rather than on scientific aspects of the ozone case.Footnote 44
Also, it is worth reminding ourselves that compared with other environmental issues, the CFC–ozone issue was, between 1985 and 1987, not considered as important as other health, environmental and technological topics, such as the 1985–6 influenza B epidemic, the space shuttle Challenger explosion, the Chernobyl disaster or recurrent urban smog problems in large cities (in 1987, ozone levels in Los Angeles exceeded federal health standards on 141 days).Footnote 45 In absolute terms, its media coverage remained relatively weak in the industrialized countries, even in the United States, where it was most intensely discussed.Footnote 46 Only a handful of ozone hole images and animations were published in the period. But while they were not numerous, they were rapidly publicized in the media and in other non-scientific communities and could reach a broad variety of audiences.
The first known public occurrence of an ozone hole image did not appear on television but in the print media. The now famous satellite map of total ozone levels over Antarctica, provided by NASA scientist Donald Heath to science journalist Walter Sullivan, was published in the New York Times on 7 November 1985 (see Figure 3).Footnote 47
Figure 3. Total ozone map showing the Antarctic ozone hole. New York Times, 7 November 1985, p. B21.
Walter Sullivan used the ‘ozone hole’ metaphor (a notion probably proposed to him by Sherwood Rowland or Donald Heath) to describe the phenomenon.Footnote 48 From a visual perspective, two dimensions of Figure 3 need to be stressed. First, a spectacular impression of vacuity is translated graphically: with a simple contrast between different hues going from white to black, a hole is created over the Antarctic continent. In fact, this vacuity is deceiving since there always remains some ozone in the stratosphere. Second, ozone concentrations are expressed ‘in terms of how deep a layer would be formed by the gas, in centimetres, at normal atmospheric temperature and pressure’ (at sea level in a temperate country).Footnote 49 Transposing the ozone layer to our atmospheric conditions made it appear much thinner (less than 0.19 centimetres in the middle) than it is in the stratosphere, thus reinforcing the impression of great fragility. Maybe more importantly, the understanding of such a statement requires only relatively rudimentary knowledge of natural science, which may be assumed to be possessed by most readers of the New York Times, and contrasts with the high complexity of atmospheric chemistry and of the instrumental theory used to create such an image.
Besides, Walter Sullivan correctly specifies that the anthropogenic origin of the ozone hole is only an assumption at this stage. However, he also insists on the legitimacy of the scientists of the British Antarctic Survey who proposed this hypothesis. More importantly, his text is clearly designed to make the new measurements from Antarctica come within the scope of a long-term story of political actions on ozone-depleting chemicals. The inscription of new events in a historical narrative of political actions – here as following important precedents for the regulation of ozone-depleting substance in the late 1970s – is often a decisive rhetorical argument for further action.Footnote 50
In the period under consideration, several similar examples of fixed (mostly black-and-white) scientific images based on satellite data featured in the general press and in popular-science journals.Footnote 51 However, in general, scientific images of the Antarctic ozone hole were used parsimoniously. Most journals favoured the story of long-term ozone diplomacy, and the tale of the scientific expeditions to the South Pole, which were described as an outstanding human adventure. This was the case, for instance, in the popular-science magazine New Scientist. The London-based magazine devoted many articles to the ozone affair, as a systematic analysis of all issues published between late May 1985 (the issue reporting the BAS's discovery) and mid-September 1987 (the signature of the Montreal Protocol) reveals. All ozone articles took the threat seriously and unambiguously advocated for a stringent treaty, yet none of them included an image of the ozone hole.Footnote 52
In other journals, the reluctance to publish ozone hole images had other causes. For instance, the technical journal Chemical & Engineering News chose a photograph of an ice shelf and a scientist of the NOZE II experiment as the cover of its mid-August 1987 issue, just a few weeks before the deliberation in Montreal (see Figure 4a). Only after the signature of the Protocol did the journal introduce on its cover an image of the ozone hole. And still the image was associated with a comment highlighting the ‘complexity’, i.e. the uncertainties, in ozone science (Figure 4b). These were important indeed when the issue was published in early November, but a rather strong consensus had already emerged on the anthropogenic origin of the ozone hole after the communication of the latest results in late September and in October 1987. The attitude of Chemical & Engineering News may thus best be explained by the fact that it is the official journal of the American Chemical Society, with close ties to the chemical industry.
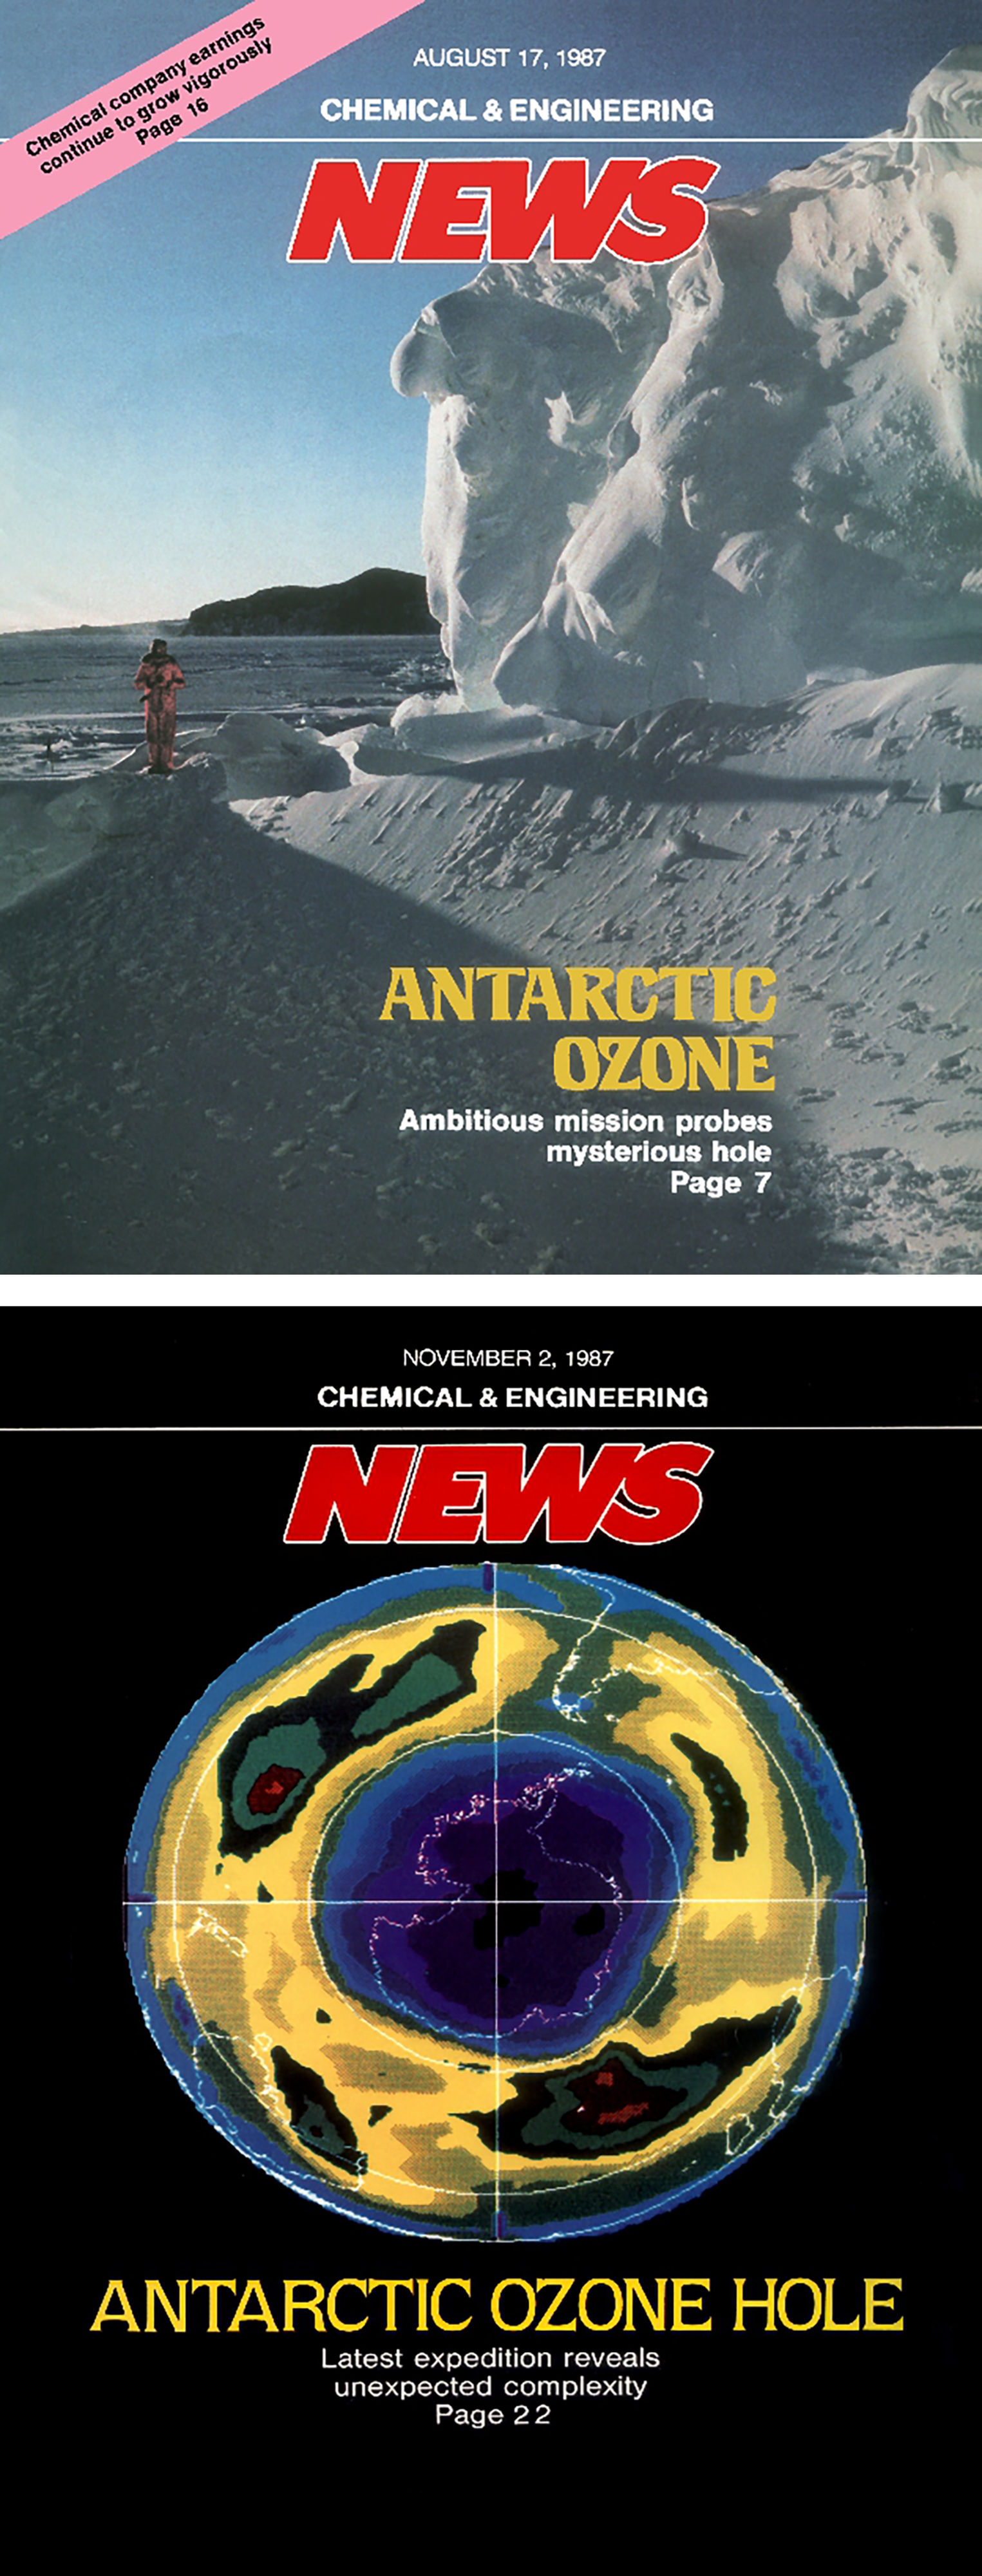
Figure 4. a, b. Title pages of Chemical & Engineering News in August and November 1987.
However, the picture looks very different with respect to broadcast media, which has received much less scholarly attention in this context. Many programmes relayed ozone hole imagery. In the United States, ‘many [Americans] first saw the ozone hole on television’.Footnote 53 This was also true for some parts of Europe, where NASA's powerful ozone hole animations were broadcast on several occasions. One important difference was that in the mid-1980s, most large national newspapers (such as the New York Times) still printed in black and white, while the majority of households in the wealthy West were now equipped with colour television sets.Footnote 54 Viewers thus saw NASA's colourful visualizations either in science documentaries and popular-science programmes, or while watching their respective national news programmes. For example, the highly successful popular-science programme Nova prominently featured NASA's satellite visualizations in an episode titled ‘The hole in the sky’ (1987, produced by WGBH). Originally broadcast in the United States on PBS on 24 February 1987, six months later British television viewers could watch the documentary on Channel 4, on 3 September 1987 – just at the moment when the last negotiations were about to take place in Montreal.Footnote 55
Not all journalists were convinced that ozone hole visualizations would be a helpful starting point. In the face of the high uncertainty attached to the underlying mechanisms of the Antarctic ozone hole, some journalists contested the legitimacy of the newly produced ozone hole images, particularly in conjunction with presumed iconic victims such as penguins, as shown in the Nova documentary. In a review of ‘The hole in the sky’ published on 3 September 1987, New Scientist journalist Debora MacKenzie deplored the emphasis put on iconic species. ‘The role of CFCs in depleting ozone over most the globe’, she wrote,
is much better observed and understood than this amazing singularity [i.e. the Antarctic ozone hole], which may not have anything to do with CFCs. Since current efforts to save the ozone are focused on CFCs, it is perhaps a pity that the programme chose the Antarctic ozone hole as its starting point and focus. Except, of course [she adds ironically], that it's a wonderful excuse for penguin shots.Footnote 56
While ‘sceptics’ or ‘merchants of doubt’ tried to discredit any scientific theory linking stratospheric ozone concentrations to anthropogenic activities at that time (including the ozone hole, of course), MacKenzie did not refute the existence of an ozone hole over Antarctica, nor the possibility that it might result from anthropogenic activities.Footnote 57 But she thought the images of penguins in Antarctica ‘divert attention from the real danger: chlorofluorocarbons which are dismantling the ozone layer worldwide’. And she estimated it to be too early to legislate on the ground of recent measurements made at the South Pole, especially as there was enough room to negotiate an ambitious protocol on the basis of knowledge pre-existing these new data. The important uncertainties in stratospheric science, she thus argued, must not delay action but rather call ‘for extreme caution’. ‘The very unexpectedness of the hole’ must only reinforce this caution, but precaution would have to be high even in absence of the Antarctic phenomenon.Footnote 58 So even more critical journalists contributed finally to instigating a ‘sense of crisis’, thus actively pushing the political agenda of those in favour of the precautionary principle.
Another frequent documentary framing was the embedding of time-lapse images of the Antarctic ozone hole in a localized or even highly individualized context. For instance, on Swiss television, viewers of the popular-science programme Menschen, Technik, Wissenschaft (People, Technology and Science) were presented in March 1987 the global ozone depletion issue also as a national and local threat.Footnote 59 Switzerland has the world's longest time series of total ozone observations, the so-called Arosa series, with measurements reaching back to 1926.Footnote 60 By showing an ozone depletion graph of declining total ozone values over Arosa, with a clear downward trend first discernible from 1957 onwards, the presenter of the programme, meteorologist Jörg Kachelmann, was able to demonstrate that ozone values were dropping not only in Antarctica but also above Switzerland. Invited to comment on this worrying trend, atmospheric physicist and ozone expert Hans-Ulrich Dütsch (the leading Swiss ozone scientist responsible for the Arosa series at that time) asserted that an anthropogenic origin was now more and more likely, and that political action must quickly follow as it has become very urgent to curb CFC emissions. Kachelmann went on to suggest that as long as national legislation remained in favour of industry (he pointed to several legal loopholes still allowing the use of CFCs), consumers now had the choice, due to the introduction of the obligation to clearly label products containing CFCs, not to buy those products, thus effectively delegating the ozone problem to the individual.
Very similar patterns can be observed in many other shows produced during that time, such as the CBS children's programme In the News (which ran in the US from 1971 to 1986), with a 1986 episode on ‘Ozone in the news’, or the French television programme C'est la vie broadcast on Antenne 2 in April 1987.Footnote 61 All programmes have in common the visual merging of a global environmental threat (i.e. NASA's time-lapse images of the Antarctic ozone hole) with highly local and individualized contexts, thus framing the ozone question as a call not only for global action, but also for individual action. To be sure, due to their urgent undertone, all of these shows clearly contributed to the heightening of the public's sense of environmental danger, and thus put further pressure on the ongoing negotiation process. However, the call for individual action (in the absence of political action), voiced on several occasions, must also be seen critically. Indeed, as historian Finis Dunaway has shown for other important industry branches such as the plastics industry, framing at an individual level can contribute to an important depoliticization of a global environmental problem, as it effectively shifts public debate away from the regulation of industry and towards consumer choice.Footnote 62
The second category of television programmes, national news programmes, also demonstrates (as already argued in the previous section) that GSFC's scientific visualizations of the ozone hole were never just technical images. In the first place, the chromatic patterns used performed a clear function: specific colours were chosen so that the images displayed a clear hole rather than a mere gradation of colours, hence suggesting that an abnormal and potentially very serious phenomenon was occurring.Footnote 63 Second, the time-lapse images evoked the whole Earth, being based on a representation of a half globe and thus mapping an area much larger than only the Antarctic continent where ozone depletion was first observed. The choice of a globe-like view was particularly effective because it resonated powerfully with the iconic whole-Earth images of the space race. Particularly important here was NASA's famous Blue Marble photograph of the Apollo 17 mission (Nasa image AS17-148-22727), itself now an emblem of the environmentalist movement, as the space agency itself began an ‘environmental turn’.Footnote 64 In reporting on the ozone hole, many news programmes mobilized both NASA's ozone visualizations and these famous photographs, effectively reinforcing this close, visual bond and affirming the scientific and cultural value of whole-Earth imagery.Footnote 65 Third and finally, the ozone animations were dynamic, telling the story of a decaying sky. Shown and reshown on many occasions during news broadcasts on private and public stations around the world, the swirling animations of the yearly formation of the Antarctic ozone hole stoked public pressure to find political solutions to this life-threatening problem, exacerbated by the announcement in October 1986 that the Arctic also now had an ozone hole.Footnote 66
Thus, throughout the negotiation processes, many major Western popular and mass media outlets publicized and broadcast images of the ozone hole. Not only did the images play a direct, diplomatic role in the negotiations (as explained in the first section); they also indirectly informed the negotiation process through the added pressure that public anxiety produced. Of course, one cannot quantify such pressure, but negotiators dealing with the problem could no longer ignore the fact that a large Western audience in Europe and North America had seen, and been convinced by, the striking images of the global environmental threat. More importantly, even though no robust scientific theory existed to explain the physico-chemical phenomenon at stake in Antarctica, NASA did not refrain from communicating the ozone images widely from late 1985 onwards. Here, public diplomacy takes the form of a state-sponsored initiative aiming at influencing domestic and foreign publics in order to make them subscribe to the international diplomacy strategy of a state. It is thus fair to describe NASA as a major actor in public diplomacy in the Montreal Protocol negotiations, precisely because the agency actively shaped public perception by providing a constant flow of images of the ozone hole. Moreover, the ozone hole can be considered one of the first major outcomes of the ‘environmental turn’ that the agency underwent after the abrupt ending of the Apollo programme. Finally, this raises, of course, also the question of exactly how independent NASA, an institution of the ‘fifth branch of government’ (the scientific advisers at the public agencies), was with regard to the executive or ‘first branch’ of government – in this case, Ronald Reagan and his closest advisers.Footnote 67 This question remains unanswered.Footnote 68
In general, one can observe that most journalists framed the latest scientific findings through the narrative of political progress, and some highlighted the uncertainties associated with the ozone hole images. Whilst for industrialists, conservative policy think tanks (the ‘merchants of doubt’) and ‘sceptics’ scientific uncertainty could be used to downplay the potential dangers, journalists, on the other hand, took the existence of the threat as a given (due to the success of the images) and used science's inability to explain how the threat had come about to justify their demands for action.Footnote 69 If science could not account for the phenomenon, then it was even more necessary to abide by the precautionary principle.
This was also the case because the public call for action was rarely associated with quantitative risk data. No reliable statistical risk data had been computed for the newly discovered ozone hole phenomenon over Antarctica yet, and few data existed for the risk at a global scale based on the knowledge of atmospheric chemistry developed since 1970.Footnote 70 One notable exception was estimated skin cancer rates, which were included in several reports and television programmes, often to provide a national health context. For example, in March 1987, Swiss television reported an estimate 12 to 24 per cent rise in the skin cancer rate.Footnote 71 However, such public-health figures were always highly uncertain. As a consequence, a qualitative approach prevailed not only in the press, but also in the Montreal Protocol negotiations. This implied resorting to a legitimate, qualitative rational principle, which was to be found in the precautionary principle, the official rationale behind the adoption of the treaty. As argued above, the scientific images of the ozone hole contributed to reinforcing the use of the precautionary principle. They thus played an important part in building a culture of debate and negotiation based on qualitative uncertainties. As rhetoric scholar Kenneth Walker has shown, ‘uncertainties marshal an affirmative speculation that embraces complexity and broadens notions of a participatory deliberation over future actions’.Footnote 72
Conclusion
This examination of the role of images in the history of ozone diplomacy demonstrates the importance of building a multifaceted diplomatic approach, which had started before the negotiations of the Montreal Protocol in December 1986. Here, diplomacy is to be understood in the broad sense, engaging the role of scientists, UN institutions, industry, consumer choices, state agencies and nation states. From its beginning in 1970, the process of debating the protocol had undergone many ups and downs, before speeding up significantly in the mid-1980s. Several important political measures preceded the famous BAS paper reporting the discovery of ozone depletion in Antarctica in May 1985. By March 1985, twenty countries had signed the Vienna Convention, which invited the signatories to control activities that ‘have or are likely to have adverse effects’ on the ozone layer, obliging them to cooperate on the related scientific investigations. This had the immediate and important benefit of making the Soviet Union release figures on CFC production for the first time in 1986. At the same time, projections based on new scenarios showed the imperative need for including developing countries in the process of regulation since they were expected to become the main contributors of ozone-depleting substances in the near future.Footnote 73
Framing this episode as one of visual diplomacy shows that the latest scientific observations of a decrease in ozone concentrations over Antarctica, and particularly NASA's satellite visualizations, played an important (although unquantifiable) role in the adoption of the protocol on 16 September 1987. Because no scientific consensus existed on the exact causes of the ozone hole, the precautionary principle was the official rationale behind the signature of this ambitious agreement. The ‘ozone hole’ metaphor and NASA's satellite images, along with the naturalist and political narratives, played a key role in convincing scientists and diplomats to subscribe to this principle, either in the name of the Antarctic phenomenon itself, or in the name of the substantial uncertainties in atmospheric science it had revealed. This is not an isolated case: scientists habitually produce and circulate images, and diplomats ‘spend large chunks of their working time on planning for and executing what we may call visual work’.Footnote 74 But the ozone hole images were exceptional because they embodied and combined both a long-term global environmental threat and an immediate environmental-related threat to individual health, and they were released just in time to have a lasting impact on the negotiation process in Montreal. During the negotiations of the Montreal Protocol, only a handful of ozone hole images circulated, but their significance went well beyond their number. Together with their associated uncertainties and narrative interpretations, they circulated rapidly and could effectively ‘translate interests, knowledges, and identities’ of the various interested communities.Footnote 75 They played a significant role in the awareness-raising campaigns that were conducted in different arenas in order to promote the precautionary principle.
In this paper, we have demonstrated that scientific images produced these striking effects as tools of visual diplomacy in the scientific community; in parts of the general and popular-science press; in the television media in the United States, the UK, France and Germany; and finally in the international negotiation arena. Although singularly successful, the ozone story represents nonetheless only one short episode in the long history of the Anthropocene and we still need to better understand the workings and impact of audiovisual products in the political, and especially the diplomatic, debates over environmental threats. Paying close attention to the various modes of production of images, to their materiality as well as to the ways actors circulate and legitimize new types of environmental images, can produce new promising results for the emerging fields of visual diplomacy and visual science diplomacy. In face of growing environmental concerns now associated with climate change and the Anthropocene – which rely heavily on iconographical material yet struggle for various reasons in finding equally influential icons – these new visual perspectives are imperative.


