


Post-traumatic stress disorder (PTSD) may develop after exposure to exceptionally threatening or horrifying events. It can arise after a single traumatic event or from prolonged exposure to trauma. The symptom course is characterised by re-experiences of the traumatic events in the form of intrusive memories, flashbacks or nightmares; avoidance of stimuli associated with the traumatic events; negative alterations in cognition and mood and marked alterations in arousal and reactivity.1
Rates of PTSD
PTSD rates vary widely across countries, with lifetime prevalence in general populations ranging from 0% to 7%.Reference Kessler and Ustun2,Reference Dückers, Alisic and Brewin3 As expected, countries with higher exposure to trauma have a higher prevalence of PTSD. More surprisingly, in the context of high trauma exposure, countries with more resources and better healthcare services have populations with a higher risk of developing PTSD than other countries.Reference Dückers, Alisic and Brewin3 Norway is a high-income country with low social inequality, good public healthcare and social services.4,5 In line with the hypothesis that countries with more resources are at higher risk for PTSD, relatively high levels of PTSD should be expected in the Norwegian population. However, with the exception of two studies limited to include a young twin panelReference Amstadter, Aggen, Knudsen, Reichborn-Kjennerud and Kendler6 or people living in two distinct geographical areas of Norway,Reference Lassemo, Sandanger, Nygård and Sørgaard7 studies of PTSD in the general Norwegian population have not been conducted.
Prevalence estimates
The term ‘prevalence of PTSD’ describes the proportion of individuals that the disorder affects at a given time, which may be at the time of the survey (point prevalence), during the past 12 months (period prevalence) or throughout life (lifetime prevalence). Most prevalence studies of PTSD in general populations have reported a lifetime prevalence.Reference Dückers, Alisic and Brewin3,Reference Kessler, Aguilar-Gaxiola, Alonso, Benjet, Bromet and Cardoso8 This factor may call for caution in results interpretation because of the delay between exposure, recovery and assessment of post-traumatic symptoms.Reference Richardson, Frueh and Acierno9 The validity and reliability of PTSD prevalence estimates may be compromised by timing and latency of assessment, poor recall, intervening influences of the media and popular opinion, and the emotional, psychological and other sociopolitical factors that can affect reporting. The point prevalence, on the other hand, is less susceptible to recall bias, which is likely even when compared with estimates of period prevalence.Reference Streiner, Patten, Anthony and Cairney10 Also, the population burden is more directly a function of the proportion of individuals affected by the disorder at a certain time point.
Aim of the study
The aim of this study was to examine lifetime trauma exposure and the point prevalence of current PTSD in the general Norwegian population.
Method
Participants
This analysis was part of the Norwegian Population Study, which was designed to gather data for a wide variety of health conditions.Reference Schou-Bredal, Heir, Skogstad, Bonsaksen, Lerdal and Grimholt11,Reference Bonsaksen, Grimholt, Skogstad, Lerdal, Ekeberg and Heir12 The study had a cross-sectional survey design of a national probability sample with data collection in 2015–2016. The study sample, constructed by the Central National Register of Norway, aimed to be representative of the general population. Names and addresses of 5500 individuals were randomly selected from a public registry of the Norwegian adult population, stratified by age, gender and region of residence. A questionnaire along with a letter explaining the purpose and procedures of the study was sent by mail to the 5500 selected individuals. Of these potential respondents, 9 had died, 21 could not complete the questionnaire because of disease or old age and 499 mailings were returned because the address was not valid (Fig. 1). We made a maximum of three attempts to contact the selected persons. More details about the study procedure and participant sociodemographic characteristics are provided elsewhere.Reference Schou-Bredal, Heir, Skogstad, Bonsaksen, Lerdal and Grimholt11
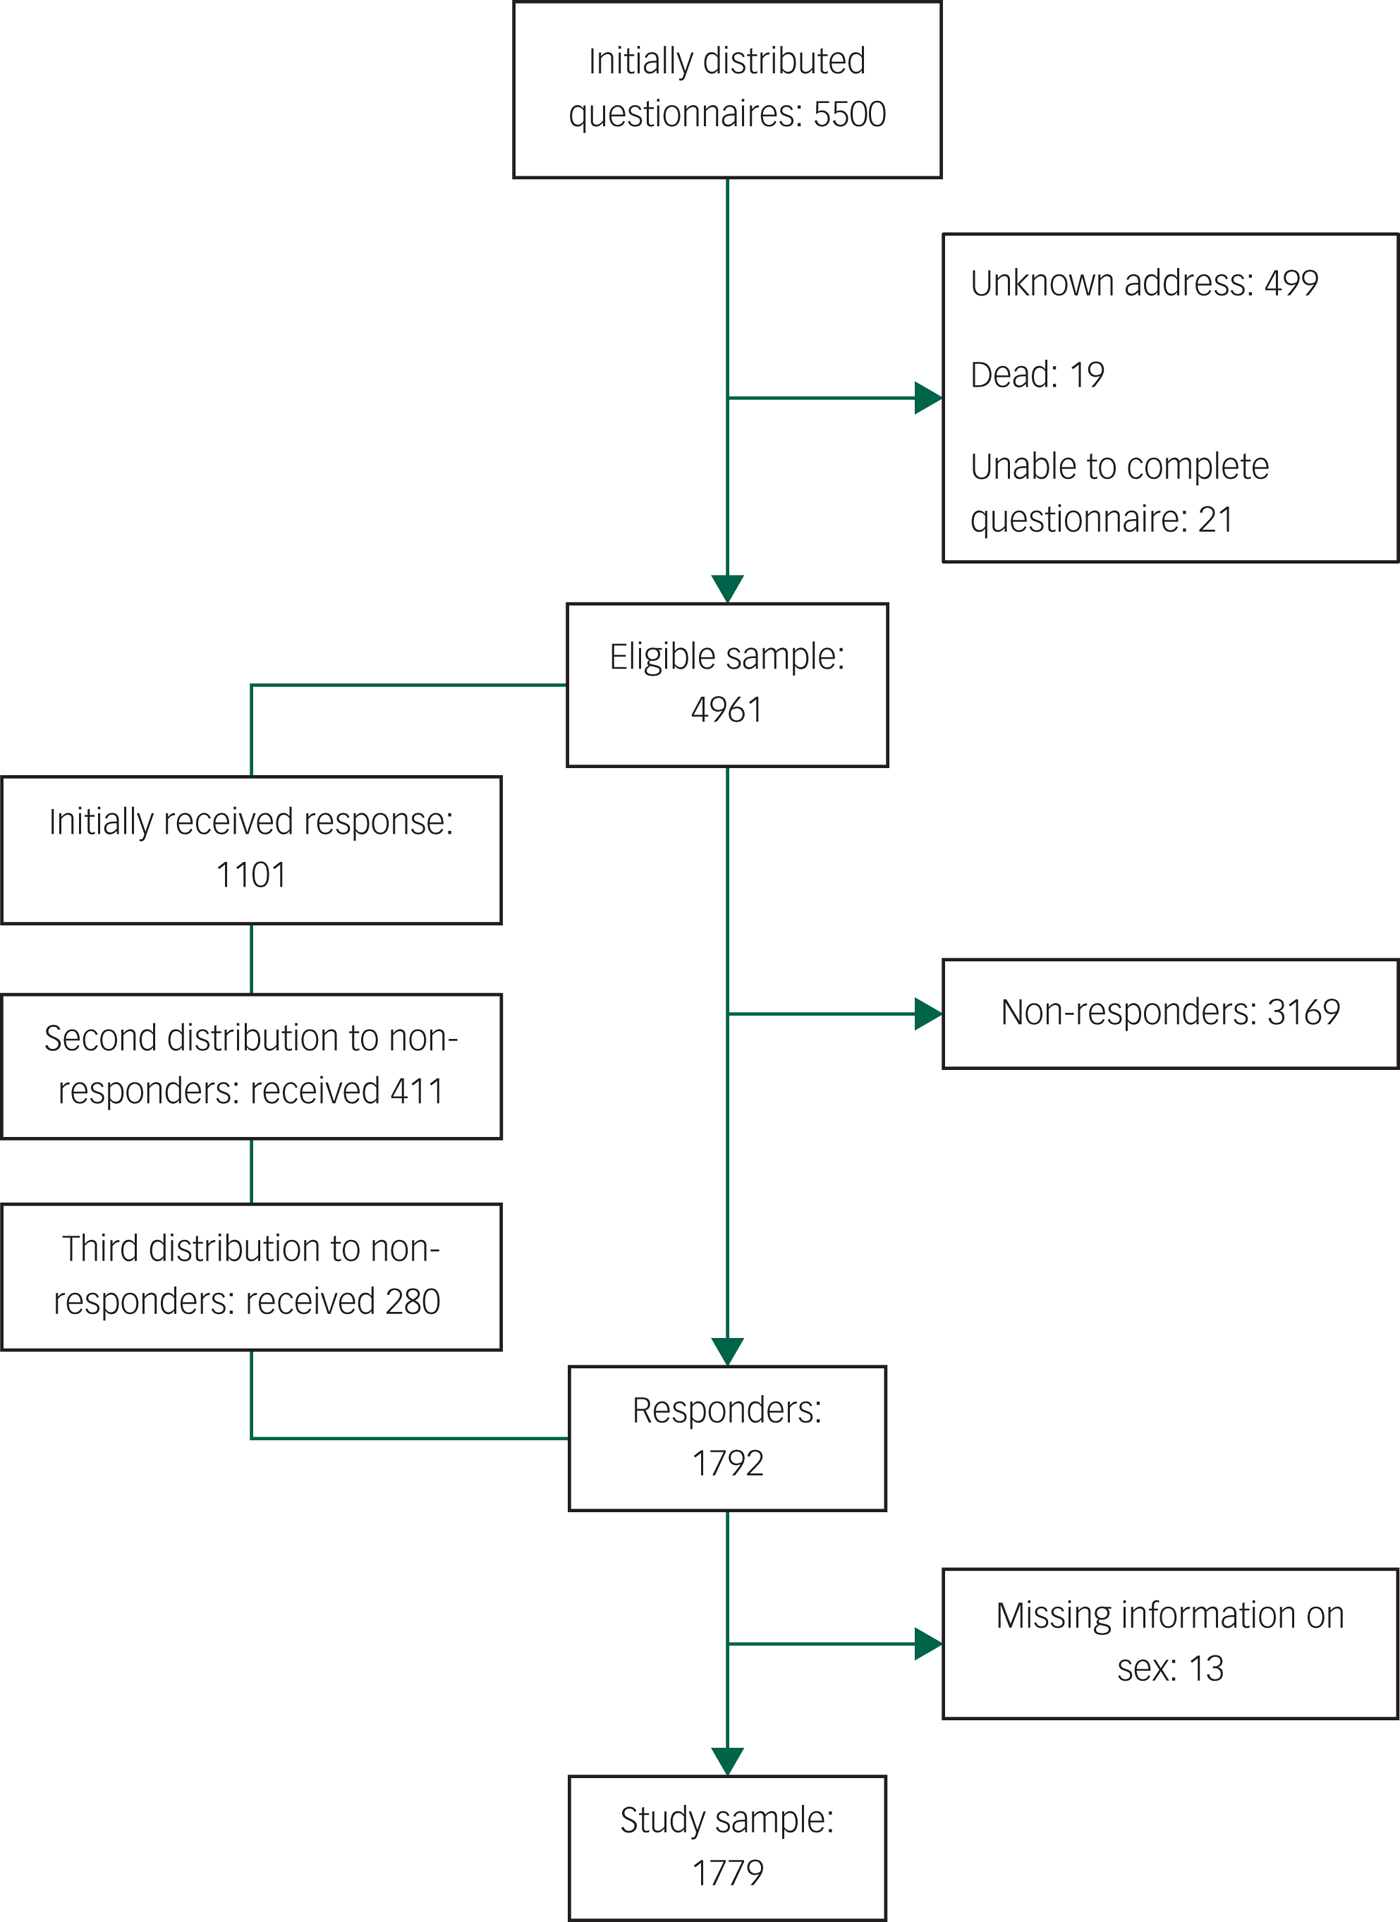
Fig. 1 Flowchart showing participant inclusion.
The survey was carried out anonymously. Any research participant has consented to the inclusion of material pertaining to themselves. Upon request, the Regional Committee for Medical and Health Research Ethics required no further formal ethical approval. The principles in the Declaration of Helsinki were respected.
Measures
Information about age, gender, education and marital status was obtained. For the present study, data were collected on lifetime exposure to serious life events and current post-traumatic stress associated with the event that was currently most distressing. To achieve a PTSD diagnosis, a respondent had to have experienced accidental or violent death, threat of life, serious injury or sexual violence (the A criterion of the DSM-5), as well as fulfilling the DSM-5 symptom criteria for PTSD.1 In the absence of clinical interviews, we used survey data on the Life Event Checklist for DSM-5 (LEC-5) to measure serious life events and the PTSD Checklist for DSM-5 (PCL-5) to measure symptoms.
The LEC-5
Trauma exposure was measured by LEC-5, a self-report measure designed to screen for potentially traumatic events.Reference Weathers, Blake, Schnurr, Kaloupek, Marx and Keane13 The measure screens for 17 categories of serious life events (e.g. natural disaster, fire or explosion, transportation accident, physical assault, sexual assault, life-threatening illness, or injury). Respondents were asked whether they had experienced each category of life event, and whether it happened to them directly or they had witnessed it, learned about it happening to a close family member or close friend or experienced repeated exposure to aversive details as part of their job.
If reporting more than one event, respondents identified their worst event, i.e. the event that currently bothered them the most. To clarify the DSM-5 criterion A status of PTSD, the LEC-5 includes a series of items in which respondents describe the index event in detail.Reference Silverstein, Lee, Witte and Weathers14 Respondents were asked whether the event involved death or danger to life, serious injury or sexual violence and had to give at least one positive answer to fulfil the A criterion. If the event involved the death of a close family member or close friend, the respondents were asked to clarify whether it was because of accident, violence or natural causes. Death by natural causes is not included in the A criterion and was not accepted as part of a PTSD diagnosis. Previous versions of the LEC have been shown to be reliable and valid in a variety of samples.Reference Gray, Litz, Hsu and Lombardo15
The PCL-5
We used the PCL-5 to measure PTSD symptoms. This 20-item self-administered questionnaire assesses the full domain of the DSM-5 PTSD diagnosis.Reference Blevins, Weathers, Davis, Witte and Domino16 The PCL-5 has four subscales, corresponding to each of the symptom clusters in the DSM-5. The symptoms endorsed were specifically linked to the index event identified in the LEC-5. Each item was scored on a five-point Likert scale (0, not at all; 1, a little; 2, moderately; 3, quite a bit; 4, extremely) to rate the extent to which the 20 symptoms bothered study participants during the past month.
We used the DSM-5 diagnostic guidelines1 applied to the PCL-5 to categorise participants as fulfilling the PTSD symptom criteria or not. Participants indicating scores of 2 or above on at least one of five re-experiencing symptoms, one of two avoidance symptoms, two of seven symptoms of negative alterations in cognition and mood and two of six arousal symptoms were classified as fulfilling the PTSD symptom criteria.Reference Blevins, Weathers, Davis, Witte and Domino16,Reference Ashbaugh, Houle-Johnson, Herbert, El-Hage and Brunet17
The Norwegian version of the PCL-5 was developed through an alternating procedure of translations and back-translations.Reference Vijver and Hambleton18 The original authors approved the final English back-translation. PCL-5 has good or excellent internal consistency, reliability and validity.Reference Blevins, Weathers, Davis, Witte and Domino16,Reference Ashbaugh, Houle-Johnson, Herbert, El-Hage and Brunet17,Reference Sveen, Bondjers and Willebrand19
Statistical analyses
Prevalence rates of PTSD are presented for men and women separately, as numbers and percentages. Cases with missing data were reviewed in detail, and those not fulfilling the PTSD A criterion were considered as non-PTSD regardless of symptom scores. Cases with a positive A criterion and positive scores on the critical number of items in each symptom cluster were considered PTSD. Those that could not have reached the critical number of positive items regardless of scores on missing items were considered non-PTSD. Finally, some cases had a positive A criterion but too incomplete data to determine if a person had PTSD or not; most of these cases apparently were associated with a perceived lack of relevance. In the primary analysis, these cases were considered as non-PTSD and then excluded in a secondary sensitivity analysis.
We used logistic regression to examine the association between number of categories of experienced serious life events and risk of PTSD. Multiple logistic regression analysis was used to adjust for gender, age, education and marital status. All tests were two-tailed, and differences were considered significant if P < 0.05. Data were analysed using SPSS version 23 for Windows (SPSS Inc., Chicago, IL, USA).
Results
Responders
Altogether, 1792 individuals participated in the study, for a response rate of 36.0%. Table 1 shows the sociodemographic characteristics of the sample. There was a slightly higher proportion of women (53.1%). Gender was not reported by 13 (0.7%) of the responders, leaving a sample of 1779 participants for analyses performed separately for men and women (Fig. 1). Proportions of age and gender did not differ significantly between responders and non-responders, and the distributions of persons living in rural and urban areas were similar.
Table 1 Sociodemographic characteristics of the participants in a nationwide probability sample of the general Norwegian population (N = 1779)

Missing data of sociodemographic characteristics ranged from 0.39% to 0.90%.
Trauma exposure
Table 2 shows categories of serious life events reported. At least one serious lifetime event was reported by 85% of men and 86% of women. The average number of categories of events experienced was 3.9 (95% CI: 3.6–4.1) for men and 4.1 (95% CI: 3.8–4.3) for women (P = 0.22). Of the total sample of men and women, 13% experienced one event category, 25% experienced two or three, 27% experienced four to six and 21% experienced seven or more. The two most common event categories experienced were transportation accidents (44.6%) and life-threatening illness or injury (48.5%).
Table 2 Lifetime trauma exposure and current PTSD in the general Norwegian population
Events reported by Life Events Checklist for the DSM-5. The event can either have happened to the respondent directly or the respondent can have witnessed it, learned about it happening to a close family member or close friend or experienced repeated exposure to aversive details about it as part of their job (e.g. paramedic, police, military or other first responder). For serious life events, lifetime, each individual may be represented in more than one category, with a maximum of one event per individual in each category. For events causing current post-traumatic stress disorder (PTSD), there is a maximum of one event per individual overall.
Gender differences: *P < 0.05, **P < 0.01, ***P < 0.001.
Men and women were exposed to serious events of different natures (Table 2). Men were, to a greater extent than women, exposed to natural disasters, fire or explosions, transportation accidents and other serious accidents. Women were more often exposed to sexual assault, other unwanted or uncomfortable sexual experiences, life-threatening illness or injury, human suffering, sudden violent deaths and other stressful events not specified in the questionnaire. Within the category ‘not specified in the questionnaire’, respondents most often described family or workplace conflicts.
The lifetime experiences of serious life events reported in Table 2 can have happened to the respondent directly or the respondent can have witnessed it, learned about it happening to a close family member or close friend or experienced repeated exposure to aversive details about it as part of their job (for example, paramedic, police, military or other first responder). Thus, the number of life events that occurred directly to the respondent may be lower than reported in the table. For example, 19.1% of men and 13.3% of women had experienced physical assault personally, 6.0% of men and 4.6% of women had been attacked or threatened with a weapon and 1.7% of men and 10.1% of women had been subjected to sexual assault.
Current PTSD
The prevalence of current PTSD was 3.8% for men and 8.5% for women (P < 0.001). The most common events causing PTSD were sexual assaults, physical assaults, life-threatening illness or injury, and sudden violent deaths (Table 2). Sexual assaults caused PTSD more often in women than in men. Among men, the conditional probability of current PTSD given a particular lifetime exposure was highest for physical assaults (3.1%), combat or exposure to a war zone (2.9%) or sudden violent deaths (2.8%). For women, it was highest for sexual assaults (10.6%), assaults with a weapon (7.2%) or physical assaults (3.7%). The event that caused PTSD was either experienced directly (64.3%), witnessed (11.6%) or happened to a close family member or close friend (23.2%), or the individual was repeatedly exposed to adverse details of it as part of the job (0.9%).
When we excluded participants with incomplete PCL data and a possible positive PTSD A criterion (n = 46), the estimated prevalence of current PTSD increased from 3.8% to 4.0% for men and from 8.5% to 8.8% for women.
When related to any serious life event, and thus not restricted to those with exposure to actual or threatened death, serious injury or sexual violence (A criterion of DSM-5), the current prevalence of symptom-defined PTSD was 4.8% for men and 9.8% for women. Causes of symptom-defined PTSD not covered by the A criterion of the DSM-5 were, for example, illness of self or others, non-violent death of a family member and workplace conflicts.
Risk of PTSD
Table 3 shows the association between number of categories of serious life events experienced and current PTSD. Risk of PTSD increased proportionally with the number of event categories experienced. Adjustment for covariates did not change this relationship. Female gender and lower education were associated with a higher risk of PTSD in the multivariate model (Table 3).
Table 3 Associations between number of categories of experienced serious life events and current PTSD in a nationwide probability sample of the general Norwegian population (N = 1779); results are presented unadjusted and adjusted for sociodemographic covariates
PTSD, post-traumatic stress disorder; Ref, reference value.
Discussion
In this study of a probability sample of the general Norwegian population over age 18 years, most people had experienced at least one serious life event. PTSD was attributed to a small proportion of the events, with a prevalence of 3.8% for men and 8.5% for women. The most common events causing PTSD were sexual assaults, physical assaults, life-threatening illness or injury, and sudden violent deaths. Risk of PTSD increased with the number of events experienced. Female gender and lower education were associated with a higher risk of PTSD.
Trauma exposure
Our estimate of people who had experienced at least one lifetime serious event (86%) appears to be higher than similar estimates in the World Mental Health Survey.Reference Benjet, Bromet, Karam, Kessler, McLaughlin and Ruscio20 That survey included data from other Western European countries such as Belgium, the Netherlands, Germany, France, Italy, Spain, Portugal and Northern Ireland (54%–73%), as well as Israel (75%), Australia (76%), New Zealand (79%) and the United States (83%). Our estimate is at the highest level also when compared with other studies from Australia (75%),Reference Chapman, Mills, Slade, McFarlane, Bryant and Creamer21 Canada (76%)Reference Van Ameringen, Mancini, Patterson and Boyle22 and Sweden (81%),Reference Frans, Rimmö, Åberg and Fredrikson23 or another study from the Netherlands (81%).Reference De Vries and Olff24
Variation in the different estimates may result from different measurement methods and how the different types of life events were presented. Compared with our use of a 17-event questionnaire, the World Mental Health Survey covered 27 potentially traumatic events from the Composite International Diagnostic Interview. Studies from Australia, Canada, Sweden and the Netherlands asked about 29, 18, 7 and 36 events or types of events, respectively. However, all studies included an open-ended question about serious events not specified, and based on face value, the different methods seemed to extract roughly the same information about lifetime traumatic events.
According to the World Bank national accounts data,25 Norwegians and some other populations with the highest numbers of reported serious life events, such as the Swedish and Dutch, are among the wealthiest in the world. Also, for other measurements of personal and social well-being, these populations are in the forefront. For example, Norway topped the global happiness rankings for 2017, with Sweden and the Netherlands among the top 10 countries.Reference Helliwell, Layard and Sachs26 Of note, people in these countries report higher numbers of serious life events than people in many countries with less social and economic progress, such as Bulgaria (29%),Reference Benjet, Bromet, Karam, Kessler, McLaughlin and Ruscio20 Romania (42%)Reference Benjet, Bromet, Karam, Kessler, McLaughlin and Ruscio20,Reference Florescu, Mihaescu-Pintia, Ciutan, Sasu and Gălăon27 and Mexico (69%),Reference Benjet, Bromet, Karam, Kessler, McLaughlin and Ruscio20,Reference Borges, Benjet, Petukhova and Medina-Mora28 or even a war-exposed population in Lebanon (69%).Reference Karam, Mneimneh, Dimassi, Fayyad, Karam and Nasser29
Some countries with much lower economic welfare than Norway also have a high incidence of serious life events, such as Colombia, Peru and Ukraine (83%–85%).Reference Benjet, Bromet, Karam, Kessler, McLaughlin and Ruscio20 However, we were unable to find examples of countries with a higher incidence of reported serious life events than Norway, despite huge differences in welfare, social distress and conflicts.
Higher numbers of reported serious life events in the Norwegian population can represent a high risk of exposure, or more likely, there are significant differences in what people in various countries remember or consider to be a serious life event. Remarkable individual differences in severity perception have been documented in the literature, even among people who have experienced the same event.Reference Heir, Blix and Knatten30 Also, the severity perception of an event often changes over time,Reference Giosan, Malta, Jayasinghe, Spielman and Difede31,Reference Heir, Piatigorsky and Weisæth32 which can affect what people report in retrospect. Social or cultural influences can lead to adjustments in perception. For example, our 48.5% prevalence of lifetime exposure to life-threatening illness or injury is remarkably higher than the overall 11.8% prevalence of lifetime exposure to life-threatening illness or injury in the World Mental Health Survey.Reference Benjet, Bromet, Karam, Kessler, McLaughlin and Ruscio20 Yet there are no indications that there is more disease or injury in the Norwegian population. Hypothetically, people living in a society with low expectations of adverse life events may be more likely to perceive or remember certain experiences as serious.
Systematic differences may also occur in the likelihood of underreporting some traumas because the experiences are embarrassing or otherwise culturally sensitive.Reference Schaeffer, Stone, Turkkan, Bachrach, Jobe, Kurtzman and Cain33 However, for reports of sexual assaults, the numbers are quite stable among countries. The finding that 1.7% of men and 10.1% of women had been subjected to sexual assault was close to the 1.1% male and 9.4% female rape prevalence reported in another Norwegian study.Reference Thoresen, Myhre, Wentzel-Larsen, Aakvaag and Hjemdal34 These values are also similar to those in other Scandinavian studies in which 9% of women in DenmarkReference Balvig and Kyvsgaard35 and 11% of women in Sweden36 reported lifetime rape or attempted rape. Quite similarly, 11% of women in a study that included 28 European countries had been subjected to sexual assault.37
Current PTSD
Comparisons of our point prevalence of PTSD with other studies are challenging because most studies to date have focused on lifetime prevalence. The point prevalence is a joint function of lifetime prevalence and duration of the disorder. Because about half of PTSD cases remit within 6 months and the probability of remission does not vary much across exposure types,Reference Morina, Wicherts, Lobbrecht and Priebe38 the point prevalence of PTSD is expected to be considerably lower than lifetime prevalence estimates. Still, the point prevalence in our study is higher than lifetime PTSD reported from various populations in Germany, Belgium, France, Spain, Italy, Bulgaria, Romania, Ukraine, Brazil, Columbia, Mexico, Japan, China, South Korea, Lebanon, Iraq and South Africa.Reference Dückers, Alisic and Brewin3 Only countries like Sweden,Reference Frans, Rimmö, Åberg and Fredrikson23 the Netherlands,Reference De Vries and Olff24 Australia,Reference Chapman, Mills, Slade, McFarlane, Bryant and Creamer21 New ZealandReference Oakley-Browne, Wells, Scott, Kessler and Ustun39 and the United StatesReference Kessler, Berglund, Demler, Jin, Merikangas and Walters40 have lifetime PTSD prevalence rates that are equal to or higher than the point prevalence in the Norwegian population. Thus, even when considering that estimates of lifetime prevalence may be conservative because of recall bias,Reference Belli, Perfect and Lindsay41 it is striking that the point prevalence in the Norwegian population is higher than a broad range of lifetime estimates of other countries, ranking Norway among the world's top countries for PTSD.
The high PTSD rate in the Norwegian population supports the ‘vulnerability paradox’ in which those living in countries with more resources have higher, rather than lower, PTSD risk.Reference Dückers, Alisic and Brewin3 Essential for PTSD is the exposure to actual or threatened death, serious injury or sexual violence.1 The subjective perception of life threat, however, can play a key role in the development and maintenance of PTSD regardless of the objectively estimated threat of the actual exposure.Reference Heir, Blix and Knatten30 Social and cultural factors can affect what is perceived as threatening or violating. Again, people living in a society with low expectations of adverse life events may be more likely to perceive an adverse event as serious. Indeed, moderation of negative appraisals of the traumatic event or its sequelae is an appropriate approach in cognitive therapy of PTSD.Reference Ehlers and Clark42 At the population level, high attention to serious life events and their potential harm to mental health outcomes may have the opposite effect.
According to general principles, in situations where many people are exposed to some risk,Reference Rose43,Reference Rose44 a small shift in the distribution of perceived threat may have a large effect on the number of people with PTSD. Thus, small between-population differences in threat appraisals can lead to paradoxical results in the cross-population prevalence of PTSD.
Another approach to PTSD is the ‘centrality of the event’, which refers to how central an event is to a person's life story and identity.Reference Rubin, Berntsen and Bohni45 The perceived centrality of stressful events is consistently associated with higher levels of post-traumatic stress symptoms.Reference Berntsen and Rubin46–Reference Blix, Birkeland, Solberg, Hansen and Heir48 According to Rubin et al,Reference Rubin, Berntsen and Bohni45 the memory of the traumatic event and its centrality are key elements in the development and maintenance of trauma symptoms. Consequently, societies in which an adverse event is more easily constructed as central in people's life story and identity might have higher rates of PTSD. Compared with most other countries, Norwegian society pays high attention to serious life events and the possibility of adverse health outcomes.Reference Shultz, Thoresen and Galea49,Reference Kristensen, Dyregrov, Weisæth, Straume, Dyregrov and Heir50 Faced with the high rates of PTSD in the general population, it is appropriate to question whether this level of attention can have negative effects on mental health at the population level.
The high rates of trauma exposure and PTSD compared with other countries should also be discussed as a possibility of underreporting in other countries and stigma of mental illness being greater. An openness culture about mental health problems has occurred in Norway in recent decades. This has helped to remove some stigma around mental disorders and caused more people to recognise or report such problems. On the other hand, it may also have made it easier to blame an illness or event that can cause illness, rather than taking personal responsibility for life's difficulties.
Methodological considerations
Interpreting the results of this study requires noting some limitations. First, we had a moderate (36%) response rate. Responders and non-responders did not differ significantly in gender or age, and the distributions of persons living in rural and urban areas were similar. Also, the responders were considered representative of the general Norwegian population in terms of education, employment and relationship status.Reference Schou-Bredal, Heir, Skogstad, Bonsaksen, Lerdal and Grimholt11,Reference Bonsaksen, Grimholt, Skogstad, Lerdal, Ekeberg and Heir12 Nevertheless, we cannot exclude the possibility of sampling bias. For instance, our findings could be biased if people affected by trauma found the study more relevant and were more willing to complete the survey; in contrast, there also could be bias if they found the study too personal or emotionally disturbing and avoided responding to trauma questions.Reference Hussain, Weisæth and Heir51
Second, we used the PCL-5 self-reported measure to assess the prevalence of PTSD, rather than using clinical assessment. When compared with the Structural Clinical Interview of the DSM-IV, a Norwegian version of the PCL is almost equivalent in its ability to assess PTSD in epidemiological research.Reference Hem, Hussain, Wentzel-Larsen and Heir52 Nevertheless, the lack of clinical interviews in the present study involves a limitation with unknown direction of the possible bias.
Third, we did not assess comorbid psychological conditions. Depression and anxiety disorders are clinically important when considering the long-term mental health effects of trauma exposure.Reference Hussain, Weisæth and Heir53 Some symptoms included in a PTSD diagnosis, such as difficulty sleeping or concentrating, could be part of depression or other psychiatric disorders and thus bias the prevalence rates of PTSD.
Finally, retrospective reports of serious life events can be associated with recall bias. Some events could have been forgotten or were no longer considered important, whereas others could have been subject to memory amplification.Reference van Giezen, Arensman, Spinhoven and Wolters54 Moreover, as with all diagnostics of PTSD, the attribution of symptoms to a particular event is a subjective appraisal.
Strengths of the study include the national probability sample, trauma questionnaires that were embedded in a wider health research context and not presented solely as a trauma survey, use of point prevalence rather than lifetime prevalence of PTSD and a responder population apparently representative of the general Norwegian population.
Clinical implications
High estimates of serious life events and correspondingly high rates of PTSD support the vulnerability paradox in which people in wealthy countries with more resources and better healthcare services have a higher risk of PTSD. A possible explanation may be that high expectations for a risk-free life or a happy life can lead to a low threshold for perceiving adverse events as life-threatening or as violating integrity. High attention to various life events and their potential harm to mental health can make such events more central in people's life stories and identities, contributing to adverse health effects such as PTSD.
Most people experience some potentially traumatic events during their lives, so a small shift in the perception of life threat or violation of integrity can greatly affect the number of people with PTSD. The suggested explanations for the high rates of PTSD in the Norwegian population should be regarded as hypotheses. More research is needed to determine how different aspects of a society can affect people's experiences of serious life events. Yet there is reason enough to consider the Hippocratic principle of not doing harm. Health professionals should be aware of possible harmful effects of promoting people's perception of life threat or violation of integrity.


 Open access
eLetters
No eLetters have been published for this article.