


Introduction
Vulture populations are declining worldwide (BirdLife International 2012a). In Africa, large reductions in vulture numbers have occurred in recent decades in areas where these birds were previously abundant, to the extent that some populations have either become locally extinct or are found only in protected areas (Ogada et al. Reference Ogada, Keesing and Virani2012). In keeping with these trends, Bearded Vulture Gypaetus barbatus populations are declining throughout much of the species’ range (Margalida et al. Reference Margalida, Heredia, Razin and Hernandez2008a, BirdLife International 2012b), and have been since as early as the mid-19th century, with some populations nearing extinction by the mid-20th century (Mingozzi and Estève Reference Mingozzi and Estève1997).
Two distinct subspecies of Bearded Vulture are recognised. The subspecies G. b. barbatus occurs north of the Tropic of Cancer in Asia, Europe and North Africa, while G. b. meridionalis occurs south of Tropic of Cancer in Ethiopia, East Africa and southern Africa (Mundy et al. Reference Mundy, Butchart, Ledger and Piper1992). Globally, the species is classified as ‘Least Concern’ (BirdLife International 2012b). Although the population size is small and seems to be decreasing, the species has a very large range and the overall decrease in numbers is not rapid enough to justify its classification as ‘Vulnerable’. However, a number of discrete sub-populations within each of the two subspecies are threatened with extinction.
In Central Asia and the Himalayas, Bearded Vultures seem abundant (Terrasse Reference Terrasse2001), although significant declines have been noted recently in the Upper Mustang region of Nepal (Acharya et al. Reference Acharya, Cuthbert, Baral and Chaudhary2010). Numbers have also decreased further west, with recent localised extinctions in the Mediterranean, mainly attributed to human persecution and poisoning (Frey Reference Frey, Muntaner and Majol1996, Xirouchakis et al. Reference Xirouchakis, Sakoulis and Andreou2001). In Europe, the species has disappeared from many parts of its historical distribution (Hiraldo et al. Reference Hiraldo, Delibes and Calderon1979, Del Hoyo et al. Reference Del Hoyo, Elliott and Sargatal1994, Frey Reference Frey, Muntaner and Majol1996, Mingozzi and Estève Reference Mingozzi and Estève1997, Carrete et al. Reference Carrete, Donázar and Margalida2006, Margalida et al Reference Margalida, Heredia, Razin and Hernandez2008a), and it is now considered ‘Endangered’ in the European Union (Annex I, EU Wild Birds Directive 79/409/EEC, Appendix II of the Bern Convention, Bonn Convention and CITES). The North African population of G. b. barbatus remains small and isolated from other Mediterranean populations, with a high risk of extinction in the medium-to-long term (Godino et al. Reference Godino, Paz, Mouati, Simón, Frey, Schaden and Bijleveld van Lexmond2005).
Within sub-Saharan Africa, knowledge of the species is poor. Earlier, crude estimates of the numbers of pairs of G. b meridionalis in Ethiopia and East Africa were 1,430 and 50 respectively (Mundy et al. Reference Mundy, Butchart, Ledger and Piper1992), while the most recent published report puts the East African population at only 20–30 pairs (Zimmerman et al. Reference Zimmerman, Turner and Pearson1996). More recent, unpublished reports suggest that the number of pairs in Ethiopia and East Africa is significantly lower than these previous estimates, particularly in East Africa where apparently only about 10 pairs remain (S. Thomsett pers. comm.). Other reports from Ethiopia also suggest a decrease (Ash and Atkins Reference Ash and Atkins2009), but basic data on population status is lacking from this country (Shimelis Reference Shimelis2011).
In southern Africa, the population lost c.38% of its former distribution range during the period 1700–1969 (Boshoff et al. Reference Boshoff, Brooke and Crowe1978, Reference Boshoff, Vernon and Brooke1983, Brooke Reference Brooke1984, Brown Reference Brown1991) and was described as “rare and threatened” in a review of the status of threatened South African birds in the 1970s (Siegfried et al. Reference Siegfried, Frost, Cooper and Kemp1976). The population continued to decline in the 1970s and 1980s although the distribution remained constant (Brown Reference Brown1991). The extent of the breeding range of the Bearded Vulture in southern Africa was estimated to be about 35,000 km2 during 1980–1983, a reduction of 21,000 km2 from the historic distribution which extended into the south-western Cape (Brown Reference Brown1991), with the population largely restricted to the highlands of Lesotho and immediately adjacent areas of the Maloti-Drakensberg mountains (Brown Reference Brown1990). In the 1980s, the breeding population was estimated at 204 pairs based on extrapolations from 61 known breeding territories (Brown Reference Brown1992). The breeding density ranged from 3.4–7.2 pairs/1,000 km2 in the seven geographical regions used by Brown (Reference Brown1992) to estimate density. In the 1990s, Colahan and Esterhuizen (Reference Colahan, Esterhuizen and Boshoff1997) observed no breeding pairs in the Free State, and Maphisa (1997) noted that sightings in the lowlands of Lesotho were rare and that some breeding territories were abandoned. In 2000, the Bearded Vulture was classified as ‘Endangered’ in the Red Data Book of birds of South Africa, Lesotho and Swaziland (Anderson Reference Anderson and Barnes2000a), as a result of its small and continuously declining population size, restricted range, range contraction, and its susceptibility to several known threats in Lesotho and South Africa.
A more recent review of the conservation status of the Bearded Vulture in southern Africa (Krüger et al. Reference Krüger, Piper, Rushworth, Botha, Daly, Allan, Jenkins, Burden and Friedmann2006) indicated that numbers were continuing to decrease. However, the review also identified the lack of sufficient knowledge and understanding of the basic demography of the regional population as a major deficiency, and an urgent need to accurately determine the number and distribution of breeding pairs and the causes of current trends in the occupancy of breeding territories.
Bird population declines can show a number of patterns; for example, populations can exhibit range contraction alone, range contraction and reduced densities in marginal and/or optimal habitat, or no range contraction but reduced densities (Wilcove and Terborgh Reference Wilcove and Terborgh1984). Declining populations may abandon marginal habitats or peripheral areas and contract toward the core of the species’ range (Mayfield Reference Mayfield1972, Reference Mayfield1973a, Reference Mayfield1973b, Rodríguez Reference Rodríguez2002), or they may show reduced densities in the periphery of the range (Wilcove and Terborgh Reference Wilcove and Terborgh1984). Understanding the pattern of decline may help to infer the causes of the decline which will aid the development of appropriate monitoring and conservation measures.
In this paper we use data from 13 years of ground and aerial surveys of the Bearded Vulture population in southern Africa to document the number and location of breeding territories as a measure of population size, and thereby estimate the size of the species’ breeding range and its breeding density. We also compare our numbers with those derived from a collation of historical survey data (1960–1999), to establish and explain the extent and pattern of decline shown by the southern African Bearded Vulture population over recent decades. In particular, we explore whether the southern African Bearded Vulture population has shown a change in territory occupancy, distribution and density over the two survey periods, and then examine whether this change has been more pronounced in the periphery of their breeding range. The study aims to improve our understanding of the current dynamics of the region’s Bearded Vulture population, and to help produce more accurate population projections to guide in situ conservation decisions.
Methods
Census of former and current breeding territories
The location of former breeding territories (defined as cliffs that have a history of use by nesting Bearded Vulture) was obtained from a variety of published records and unpublished reports (Appendix S1 in the online Supplementary Materials). These documents included details of all known breeding territories occupied since the 1960s, the earliest records of nest site locations within the breeding distribution range in the Maloti-Drakensberg mountains (Brown Reference Brown1992). A similar approach was used by Whitfield et al. (Reference Whitfield, Fielding, McLeod, Haworth and Watson2006) to classify all potential territories of Golden Eagles in Scotland.
We then attempted to determine the current occupancy status of these breeding territories and to identify any additional territories that may have remained undiscovered, through extensive ground and aerial helicopter surveys conducted between 2000 and 2012. Potential new territories were identified from topographical maps, by land managers from a questionnaire survey conducted within the species’ range (Hiltunen Reference Hiltunen2008) and from individuals who had carried out other field-based activities in specific localities of interest. We then surveyed these potential territories to confirm their occupancy status. Our 13-year census period with multiple visits to most sites (Table S1; 77% of sites visited more than once) gives us the confidence that observed trends were real and not a result of year-to-year population fluctuations or survey and observer biases.
Full details of the census method followed between 2000 and 2012 are available in Brown (Reference Brown1992) but are described briefly below. Surveys were undertaken during the breeding period (nest building to fledging: May to December) because fidelity to nest sites is highest during this period which increased the probability of seeing birds with territorial behaviour (i.e. nest-building, nest defence) and determining the occupancy status of the territory. Ground surveys were done on foot or by road, and potential breeding territories were scanned using binoculars and 20–60 x telescopes for an average of four hours (4.24 ± 0.18 hours, n = 122, range 0.5–11.5 hours) between first and last light, or until breeding was confirmed. Bearded Vulture pairs are known to have a number of alternative nests on average 230 m apart (Brown 1988), therefore observations included all the cliff faces containing all potential alternative nests of that territory. To ensure that the observation period was sufficient, surveys were predominantly (69%; n = 608) carried out during the nestling period when activity at the nest peaks, with either an attendant adult or with food being provisioned several times a day (Brown Reference Brown1990). Since territories recorded by Brown (Reference Brown1990) were on average 7.2 km apart, observers were able to distinguish between neighbouring territories. Aerial surveys were conducted in helicopters, flying approximately 100–500 m from the cliff edge at an average flying speed of 70–80 km/h with a minimum of two observers looking out of the port side of the aircraft. The census method followed between 1960 and 1999 included a variety of protocols including those of Brown (Reference Brown1992) described above.
Territories were considered occupied if at least one adult was flushed off the cliff or seen flying or roosting in the area, entering a pothole or overhang on the cliff; if a chick or fledgling was seen; or if there was fresh whitewash and plant material (sticks) on the nest indicating recent use attributed to this species based on the location of the whitewash and the type of nest structure. Where nest structures were seen but no bird was seen in the area, the territory was recorded as unoccupied. Nest structures can remain intact in potholes long after abandonment, so nest structures alone do not serve as a useful indicator of occupancy. Territories where nest structures were no longer evident or where birds had not been seen in a number of years (at least four consecutive years of survey) were considered abandoned.
The location of all territories was entered into the geographic information system ArcGis v. 9.3 (ESRI, Redlands, USA). Since the GPS coordinates recorded were those of the aircraft or the observer on the ground and not of the nest, the actual location of the nest site was extrapolated to the cliff edge. Where a pair had alternative nest sites on the territorial cliff, the location of the most frequently used site was taken as the location of the territory. As a means of examining regional patterns of change, breeding territories were grouped and compared by country and district (Lesotho) or province (South Africa) (Figure 1).

Figure 1. The location of the southern African distribution range of the Bearded Vulture indicating Lesotho and the three provinces of South Africa.
Estimating territory occupancy and population size
We compared occupancy of current (occupied during 2000–2012) and former (occupied during 1960–1999) territories using two scenarios. Firstly, we calculated population change based on the current status of all territories recorded during 1960–1999. This scenario excluded those territories recorded for the first time during 2000–2012 and therefore represents the minimum population change. For this calculation, we took into account that a pair may have moved their breeding activity to a nearby cliff between the former and current study period, rather than abandoning their territory. Our decision to categorise whether a pair had abandoned or potentially relocated their territory was based on the status of, and distance to, the neighbouring breeding territory within that time period. We used Brown’s (Reference Brown1990) estimate of maximum average inter-nest distance (7.2 km) as the deciding factor; where “abandoned” former nests located < 7.2 km from current nests were considered to be nest relocations within the same territory, while those located > 7.2 km from any current nests were considered to have been abandoned. Territories where former occupied nests were located < 7.2 km of each other were considered abandoned rather than relocated if the neighbouring territory was still occupied.
Secondly, we assumed that all territories located for the first time during the current survey period (2000–2012) were occupied formerly (1960–1999) based on the knowledge that pairs use alternative nests on the same cliff rather than moving to a different cliff (Brown Reference Brown1990), and many territories had large, well established nest structures suggesting many years of use. All known territories were considered occupied at some point since 1960 and therefore represented potential breeding territories. If all potential territories were occupied in any one year this would represent the total overall potential former population size. However it is unlikely that all territories would be occupied annually. Therefore, when examining population change we are reporting on maximum population change, since all territories would not necessarily have been occupied every year between 1960–1999 and 2000–2012.
Territory occupancy data were used to estimate the maximum and minimum number of Bearded Vulture in southern Africa. The total number of currently occupied territories together with the total number of known trios were used to calculate the number of breeding adults in the population. Estimates of non-breeding adults are not available for the population and are difficult to ascertain (Margalida et al. Reference Margalida, Oro, Cortés-Avizanda, Heredia and Donázar2011). It was assumed that there were no non-breeding adults in the population based on Brown (Reference Brown1997) and personal observations of slow replacement at territories where an individual of a pair had disappeared. To calculate population size in the absence of data on the current age structure of the population, we used previous estimates of age ratio (adults: non-adults) found in this population (1: 0.6; Brown Reference Brown1997).
Estimating breeding distribution and density
The extent of the former and current breeding range was measured by minimum convex polygons using the Hawth’s analysis tools (Beyer Reference Beyer2004) for ArcGis 9®. The area of occupancy of the former and current population was measured using the distribution of occupied breeding territories within quarter degree squares (QDSs), making it comparable with Brown’s (Reference Brown1992) study. The number of occupied QDSs was multiplied by the size of a QDS (625 km2) to obtain the area of occupancy.
Breeding density was examined using the number of breeding pairs per 1,000 km2 based on the area of occupancy. Inter-nest distances were measured as the distance to the nearest nest of a neighbouring conspecific pair.
Core versus peripheral territories
Territories were classified as either within the core breeding range or the peripheral (marginal) breeding range based on the number of surrounding QDSs that contained occupied breeding territories. Territories were classified as “peripheral” if they were surrounded by four or less QDSs (giving an index of 0–4) that contained occupied breeding territories. “Core” territories were those surrounded by at least five occupied QDSs (giving an index of 5–8).
Statistical analyses
We used a Generalised Linear Model (GLiM) with a binomial distribution to examine territory status in relation to country (South Africa or Lesotho), which was fitted as a categorical effect. We used a General Linear Model (GLM) (i.e. with a normal distribution) to examine inter-nest distances in relation to period (former or current) and location (core or periphery), which were fitted as categorical effects. We tested whether the probability of a territory being occupied or abandoned differed depending on the level of its periphery index. For this we used a GLiM (binomial error structure and a logit link function) with occupancy status (1/0) as the response variable and the periphery index as the continuous explanatory variable.
Results
Territory occupancy and population size
We identified a total of 190 potential breeding territories in southern Africa through ground and aerial surveys, and from published sources (Table S1a). These were territories which were known to be used by Bearded Vultures at some point in the past 52 years. Since all potential breeding cliffs throughout the distribution range were searched during the census period, this was considered the total number of potential territories in southern Africa. Lesotho had 92 territories and South Africa had 98 (Table 1).
Table 1. A comparison of former and current breeding territory occupancy of the Bearded Vulture in southern Africa (known number of sites in each period).
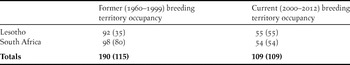
The total number of breeding territories occupied during the 2000–2012 census period was 109, of which 55 were in Lesotho and 54 were in South Africa (Table 1). Of these 109 territories, occupancy varied annually between 31% and 75% with an average of 55% of the territories being occupied annually overall (Figure 2). Breeding territories were fairly evenly distributed throughout the central and eastern highlands of Lesotho and along the Drakensberg escarpment in KwaZulu-Natal and the Eastern Cape (Figure 3). Territories off the main escarpment were located on cliffs along river courses, outlying mountain peaks and sandstone and basalt rock formations above 1,800 m. The remaining 81 territories were classified as either unoccupied (n = 12) or abandoned (n = 69) by 2012 (Table S2).

Figure 2. Bearded Vulture territory occupancy in southern Africa between 2000 and 2012 where the annual number of occupied territories is depicted as a percentage of the total number of territories occupied between 2000 and 2012 (n=109) that were surveyed.

Figure 3. A comparison between territories currently (2000–2012) and formerly (1960–1999) occupied (●); territories only located during the current period (2000–2012) but likely to be occupied in the past (Θ); and abandoned territories (X), i.e. those only occupied formerly.
Of the total number of potential breeding territories (n = 190), 115 were reported to be occupied during 1960–1999 (Table S1b, Table 1). The status of the remaining 75 during this time is unknown, because these territories were only located during the current census period as a result of increased survey effort. The minimum population decline was explored using a scenario which included only the territories known to be active in the past (n = 115). A resurvey of these known former territories classified 59 territories as abandoned, suggesting a 51% decline (Table 2). However, if we allow for the possibility that some apparently abandoned former territories are actually still occupied, with nest sites relocated to new cliffs < 7.2 km from the former nest cliffs (n = 22), then the more conservative overall decline is estimated at 32% (Table 2). If we also allow for the unlikely possibility that sites only recorded in 2000–2012 (n = 75) were newly formed territories not occupied formerly, then the decline is estimated at only 5%.
Table 2. A comparison of the percentage decrease in the number of occupied territories from the number of known and potential Bearded Vulture territories recorded in southern Africa during the former (1960–1999) and current (2000–2012) period.
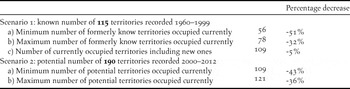
In the second scenario where all potential territories were assumed to be formerly active (n = 190), the maximum population decline is estimated at 43% (n = 81) with just over half (57%; n = 109) the territories currently occupied (Table 2). Lesotho and South Africa experienced similar (χ 2 = 0.43, df = 1, P = 0.51) maximum declines of 40% and 45% respectively (Table S3). There were 12 territories classified as unoccupied but which were only checked 1–3 times during this period, primarily through aerial surveys (Table S4). It is therefore possible that we may have missed the presence of an adult and the territory may have been occupied at some point during this period. Therefore, if we make the conservative assumption that all these territories were actually occupied at some stage during the 2000–2012 period then the current population comprises a maximum of 121 occupied territories, and would give an estimated minimum population decline of 36% (Table 2).
If the 5% decline in known territories is discounted as being unlikely, the maximum decline in the known number of territories (51%) is higher than the maximum decline in potential territories (43%). The minimum decline in known territories (32%) is slightly lower than the minimum decline in potential territories (36%), and is probably a more accurate reflection of the actual trend in breeding territory numbers. Either way these different approaches yielded very similar results and suggest that the decline is real and lies between 32% and 51%.
All further analyses exploring change were based on the current (minimum) estimate of 109 known occupied territories and the assumption that newly found territories were previously occupied, giving a total of 190 formerly occupied territories.
Current population estimate
Based on the current territory occupancy figures (n = 109 minimum and n = 121 maximum) and the known number of trios in the population (n = 3), we estimate the southern African Bearded Vulture population to comprise a minimum of 221 breeding adults and 131 non-adult birds and a maximum of 245 breeding adults and 145 non-adult birds. The total current population estimate, therefore, is between 352 and 390 individuals.
Breeding distribution and density
The extent of the current breeding range (33,883 km2), as calculated by minimum convex polygon, is 37% less than that of the former breeding range (53,817 km2) and depicts the total study area (Figure 4).

Figure 4. A comparison between the current (solid filled: 2000–2012) and former (hashed filled:1960–1999) breeding distribution of the Bearded Vulture in southern Africa, mapped per Quarter Degree Square (625 km2), within the former (thin line) and current (bold line) extent of the breeding range, showing formerly (x) and currently (●) occupied territories.
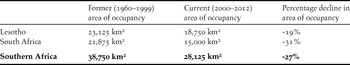
The area currently occupied by breeding Bearded Vultures in southern Africa, based on the number of QDSs with territories occupied during the survey period (n = 109), is 28,125 km2, with breeding recorded in 45 QDSs (Figure 4). In contrast, the area occupied by the former breeding population, based on all territories known or assumed to have been occupied at least once during 1960-1999 and 2000–2012 (n = 190), was 38,750 km2, with breeding recorded formerly in 62 QDSs (Figure 4). This estimate is slightly larger than an earlier estimate of 35,000 km2 (Brown Reference Brown1992) because it incorporates additional QDSs with newly confirmed breeding territories. If we assume these newly found sites were occupied previously, then the area of occupancy, decreased by 27% over the past five decades. This decrease was greater in South Africa (31%) than in Lesotho (19%) (Table 3).
Table 3. A comparison of the former and current breeding area of occupancy of the Bearded Vulture in southern Africa (where area = number of occupied quarter degree squares multiplied by the area of a quarter degree square).
Consistent with the observed changes in territory occupancy and breeding range, current Bearded Vulture densities of 3.9 occupied territories/1,000 km2, are 20% lower than the 4.9 occupied territories/1,000 km2 recorded formerly, i.e. based on the assumption that all currently know sites were previously occupied. Consequently, the average inter-nest distance of currently occupied territories is higher (9.0 ± 0.8 km, n = 109; range 1.3–55.5 km) than the average inter-nest distance of formerly occupied territories (7.7 ± 0.6 km, n = 190; range 1.0–52.9 km), although this difference is not significant (F 1,19 = 1.08, P = 0.32). The difference in inter-nest distances between the two periods is small because former peripheral territories with greater inter-nest distances were abandoned, resulting in the remaining territories having lower inter-nest distances than expected.
Core versus peripheral territories
Visual inspection of the data suggested that more peripheral sites had become abandoned rather than those in the core of the range (Figure 5). Of all known territories (n = 190), 161 were classified as core and 29 were classified as peripheral territories (Figure 5). Overall 39% (n = 35) and 38% (n = 27) of the core territories in Lesotho and South Africa respectively were abandoned, whereas 100% (n = 2) and 63% (n = 17) of peripheral territories in Lesotho and South Africa were abandoned (Figure 5).
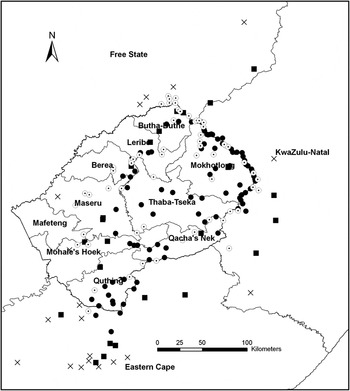
Figure 5. The location of currently (2000–2012) occupied Core (●) and Peripheral (■) breeding territories, and abandoned Core (Θ) and Peripheral (x) territories in the breeding range of the Bearded Vulture in southern Africa.
The location of a territory (in terms of a site’s periphery index) had a significant influence on the probability of abandonment (χ 2 = 9.33, df = 189, P = 0.002). Territories that were more peripheral, had a higher probability of abandonment, or put another way, abandoned territories had a lower periphery index (i.e. surrounded by less occupied QDS) than occupied territories (abandoned: 5.4 + 0.2; occupied: 6.2 + 0.1) (Figure 6).
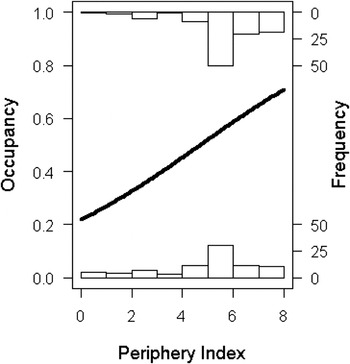
Figure 6. The relationship between probability of territory occupancy (where “0” is abandoned and “1” is occupied) and region. The line is the fitted line from a Binomial Generalised Linear Model. The probability of occupancy increases with an increase in the periphery index (where “0” is Peripheral and “8” is Core), which is based on the number of surrounding Quarter Degree Squares which contained breeding Bearded Vultures.
The current breeding density in the core of the range (4.6 territories/1,000 km2) is more than double the density in the periphery of the range (2 territories/1,000 km2). Unsurprisingly, core breeding territories are significantly (F 1,109 = 0.08, P < 0.0001) closer together (6.7 ± 0.4 km, n = 84; range 1.3–16.4 km) than peripheral territories (16.4 ± 2.7 km, n = 25; range 1.7–55.5 km).
Discussion
This study confirmed the decrease of the Bearded Vulture in southern Africa documented by Krüger et al. (Reference Krüger, Piper, Rushworth, Botha, Daly, Allan, Jenkins, Burden and Friedmann2006). This study quantified decreases in territory occupancy (by 32–51%), breeding distribution (by about 27%) and density (by about 20%) over the last 52 years, and verified that territory abandonment has been more frequent around the periphery of the species’ range. Our results suggest that recommendations to address the already severe declines documented in the 1980s (Brown Reference Brown1991) have either not been implemented or have not been sufficient to adequately arrest these negative trends.
Our recent extensive and thorough census revealed a slightly larger former breeding range, with new breeding territories that were not previously recorded by Brown (Reference Brown1992). Our estimates of former breeding range (38,750 km2), breeding density (3.9 pairs/1,000km2) and breeding population (190 pairs), are very similar to the estimates of 35,000 km2, 3.4–7.2 pairs/1,000 km2 and 204 pairs respectively derived by Brown (Reference Brown1992), despite only 30% of the territories being known at that time. Our estimate of the current number of breeding territories in Lesotho (55) is at the lower end of a more recent, independent estimate of 55–70 breeding territories (Kopij Reference Kopij, Frey, Schaden and Bijleveld van Lexmond2004).
Although there has been a reduction in breeding density, the density recorded during this study (3.9 pairs/1,000km2) is within the range of densities recorded for various regions within the Spanish Pyrenees (0.14–7.4 pairs/1,000 km2), with the highest densities being recorded in the core region (Margalida et al. Reference Margalida, García, Bertran and Heredia2003, Carrete et al. Reference Carrete, Donázar and Margalida2006, Margalida et al. Reference Margalida, García and Cortés-Avizanda2007, Gómez de Segura et al. 2012). Similarly the average nearest neighbour distance in our population (9.0 km) was within the range of 2.1–28.0 km and 8.9–11.1 km recorded in the Spanish Pyrenees (Donázar et al Reference Donázar, Hiraldo and Bustamante1993, Margalida et al. Reference Margalida, Donázar, Bustamante, Hernández and Romero-Pujante2008b). Although the results allow for interesting comparisons with wild populations elsewhere, the densities recorded in the Spanish Pyrenees are those of a recovering population with an important network of supplementary feeding sites which probably promotes territory shrinkage (Margalida et al. Reference Margalida, Donázar, Bustamante, Hernández and Romero-Pujante2008b) and therefore may not be a real reflection of natural densities.
Breeding densities were highest in the core of the range along the Maloti-Drakensberg escarpment and in the Lesotho Highlands but many breeding territories off the main escarpment in South Africa have been abandoned. Our study therefore, confirms the previously documented abandonment of territories in the lowlands (Maphisa Reference Maphisa and Boshoff1997) and peripheral areas of the range (Colahan and Esterhuizen Reference Colahan, Esterhuizen and Boshoff1997). The population has exhibited a contraction in breeding range as well as a contraction to the centre of the breeding range, evidenced by the greater chance of abandonment in the peripheral areas and higher territory densities in the core areas than in the peripheral areas. This observed decline supports the patterns identified by Mayfield (Reference Mayfield1972, Reference Mayfield1973a, Reference Mayfield1973b) and Wilcove and Terborgh (Reference Wilcove and Terborgh1984) who recorded reduced densities in marginal and sub-optimal habitats and contraction toward the center of the species’ range as populations decline. Our findings also show some support for the “melting range” analogy (Rodríguez Reference Rodríguez2002); as a population declines in abundance, it becomes increasingly rare in peripheral areas and experiences a range reduction, and remaining territories occupy the range where densities were higher before the decline. Knowledge of the mechanisms of decline and the underlying local densities is required to interpret the patterns in range contraction and density reduction for the monitoring and conservation of the species to be more effective (Schonewald-Cox and Buechner Reference Schonewald-Cox, Buechner, Seitz and Loeschcke1991). These mechanisms, such as food availability, climatic factors or human density and associated infrastructure require further investigation.
The declines shown, and the potential threats discussed, in this study are reflected by a number of studies on other sub-populations of Bearded Vulture (e.g. Frey Reference Frey, Muntaner and Majol1996, Mingozzi and Estève Reference Mingozzi and Estève1997, Del Hoyo et al. Reference Del Hoyo, Elliott and Sargatal1994, Carrete et al. Reference Carrete, Donázar and Margalida2006, Margalida et al. Reference Margalida, Heredia, Razin and Hernandez2008a) and on other vulture populations in Africa (Rondeau and Thiollay Reference Rondeau and Thiollay2004, Thiollay Reference Thiollay2007, Virani et al. Reference Virani, Kendall, Njoroge and Thomsett2011, Ogada et al. Reference Ogada, Keesing and Virani2012). Regionally, cliff-nesting Cape Vultures Gyps coprotheres have also declined in range and numbers throughout the Maloti-Drakensberg mountains and adjacent areas (Piper Reference Piper and Boshoff1997, Vernon and Boshoff Reference Vernon, Boshoff and Boshoff1997, Anderson Reference Anderson and Barnes2000b, Allan and Jenkins Reference Allan and Jenkins2006, Boshoff et al. Reference Boshoff, Piper and Michael2009), possibly as a result of a similar suite of driving forces.
Tall cliffs are ubiquitous throughout the Lesotho highlands and along the Drakensberg escarpment, and this together with the fact that there were many unoccupied territories, provides further support for Brown et al.’s (Reference Brown, Brown and Guy1988) previous conclusion that the availability of suitable breeding territories is not a limiting factor in the size of the southern African breeding Bearded Vulture population. The original range contraction and population decline that restricted the species to its current range were attributed to persecution by humans (shooting, poisoning and disturbance at nests) and a decrease in the availability of carrion (Siegfried et al. Reference Siegfried, Frost, Cooper and Kemp1976), although studies in Spain have shown that food shortages affect this species to a lesser degree (Margalida and Colomer Reference Margalida and Colomer2012). More recently, decreasing numbers have been attributed to poisoning (Brown Reference Brown1991), displacement by humans and livestock at lower altitudes and degradation of habitat (Mundy et al. Reference Mundy, Butchart, Ledger and Piper1992, Vernon and Boshoff Reference Vernon, Boshoff and Boshoff1997), and the deliberate persecution of vultures for traditional medicine, food and ceremonial purposes (Maphisa Reference Maphisa and Boshoff1997, Ngwenya Reference Ngwenya2001, Mander et al. Reference Mander, Diederichs, Ntuli, Khulile, Williams and McKean2007). We also cannot exclude the possibility that climatic factors have forced birds into higher and cooler sites and reduced the breeding population over this time period (Simmons and Jenkins Reference Simmons and Jenkins2007) as predicted for other southern African birds (Simmons et al. Reference Simmons, Barnard, Dean, Midgley, Thuiller and Hughes2004).
The past few decades have seen a large increase in the size of the human population and associated developments within the region (Statistics South Africa 2011). We hypothesize that anthropogenic influences are driving the abandonment of Bearded Vulture territories, particularly on the periphery of the breeding range, but the exact mechanics of this interaction remain unknown and require further investigation. Non-natural mortalities attributed to illegal poisoning have been the main mortality factor in other populations (Margalida Reference Maragalida2012). It must be determined whether poisoning, either direct (for traditional medicine purposes) and/or indirect (through ingesting carcasses containing harmful veterinary drugs or poisoned bait for predator control), is also still a major mortality factor for the population in southern Africa. Information on breeding success and survival of different age classes is also required to determine whether either may be a contributing factor to the species decline documented in this study.
Our findings have ensured a more accurate reassessment of the species conservation status and served to substantiate the regional uplisting of the species to ‘Critically Endangered’ (Reference Krüger and TaylorKrüger in press). We show patterns of decline consistent with other studies that have documented the collapse of several vulture populations throughout Africa in the past decade (Rondeau and Thiollay Reference Rondeau and Thiollay2004, Thiollay Reference Thiollay2007, Virani et al. Reference Virani, Kendall, Njoroge and Thomsett2011, Ogada et al. Reference Ogada, Keesing and Virani2012). Collectively, these results are suggestive of an “African Vulture Crisis”, and motivate for an urgent, informed and concerted conservation effort to ensure the continued survival of vultures across the African continent. A number of conservation measures, such as supplementary feeding, have been successfully implemented elsewhere to address food shortages, the effects of direct and indirect poisoning and to improve breeding success (Piper et al. Reference Piper, Boshoff and Scott1999, Margalida et al. Reference Margalida, García, Bertran and Heredia2003, Oro et al. Reference Oro, Margalida, Carrete, Heredia and Donázar2008). These measures must be investigated for the potential effectiveness of their implementation for this population.
Supplementary Material
The supplementary materials referred to in this article can be found at journals.cambridhge.org/bci
Acknowledgements
We are grateful to Ezemvelo KwaZulu-Natal Wildlife, the Wildlands Conservation Trust, the Maloti Drakensberg Transfrontier Programme, Sasol through the Endangered Wildlife Trust, Free State Economic Development, Tourism and Environmental Affairs, the South African Air Force and the Durban National Science Museum for their generous funding and assistance with the various surveys during the census period. We thank the many dedicated volunteers and individuals from various organisations who assisted with the surveys, in particular Ezemvelo KwaZulu-Natal Wildlife staff (Douglas van Zyl, Peter Chadwick, Alan Howell, John Crowson, Eduard Goosen and the Ecological Advice Staff, Field Rangers and Conservation Managers throughout the uKhahlamba Drakensberg Park World Heritage Site) and Richard Lechmere-Oertel. The following individuals are thanked for making their unpublished information available: David Ambrose, Robin Guy, Wigbert Vogeley, Brian Colahan and especially Christopher Brown. Rob Simmons is thanked for commenting on an earlier draft of this manuscript.


