


Introduction
Rudd’s Lark is a grassland bird endemic to the highlands of eastern South Africa (Hockey et al. Reference Hockey, Allan, Rabelo and Dean1988). It is one of only two members of the genus Heteromirafra, along with Liben Lark H. archeri of Ethiopia, and both are globally threatened (Donald et al. Reference Donald, Buchanan, Collar, Abebe, Gabremichael, Mwangi, Ndang’ang’a, Spottiswoode and Wondafrash2010, Spottiswoode et al. Reference Spottiswoode, Wondafrash, Gabremichael, Abebe, Mwangi, Collar and Dolman2009, Reference Spottiswoode, Olsson, Mills, Cohen, Francis, Toye, Hoddinott, Dagne, Wood, Donald and Collar2013). Its distribution is highly localised and patchy (Hockey et al. Reference Hockey, Allan, Rabelo and Dean1988, de Juana et al. Reference de Juana, Suárez, Ryan, Alström, Donald, del Hoyo, Elliott and Christie2004), and the grasslands around Wakkerstroom, Stormberg and Memel, in Mpumalanga, Eastern Cape and Free State Provinces respectively, appear to be its last remaining strongholds (Maphisa et al. Reference Maphisa, Donald, Buchanan and Ryan2009, Taylor et al. Reference Taylor, Peacock and Wanless2015). Its patchy and unpredictable distribution and its naturally cryptic nature (Hockey et al. Reference Hockey, Allan, Rabelo and Dean1988) mean that Rudd’s Lark has defied a confident or comprehensive assessment of its conservation status.
The species’ IUCN threat level has changed over the past few decades (it was down-listed from ‘Critically Endangered’ to ‘Vulnerable’ in 2005, then up-listed to ‘Endangered’ in 2017) and continues to be the result of crude estimations given the information available (Taylor et al. Reference Taylor, Peacock and Wanless2015, BirdLife International 2017). Its current ‘Endangered’ status in South Africa is justified in terms of the IUCN criteria by a suspected population size reduction of 50% over the last 10 years, and a similar projected reduction over the next 10 years in area of occupancy, extent of occurrence and/or quality of habitat (Taylor et al. Reference Taylor, Peacock and Wanless2015, BirdLife International 2017).
Rudd’s Lark is one of three globally threatened bird species endemic to eastern South Africa’s highland grasslands, along with Botha’s Lark Spizocorys fringillaris and Yellow-breasted Pipit Anthus choris (Marnewick et al. Reference Marnewick, Retief, Theron, Wright and Anderson2015). Almost a third of this habitat has already been lost, primarily through agricultural transformation (Huntley and Barnard Reference Huntley and Barnard2012), and less than 1% is statutorily conserved (Mucina and Rutherford Reference Mucina and Rutherford2006). Important populations of all three globally threatened grassland bird species, together with several other biome-restricted bird species, occur in an area of grassland centered on the towns of Wakkerstroom, Volksrust and Memel, which has therefore been identified as an Important Bird and Biodiversity Area (IBA) region called the Grasslands IBA (Marnewick et al. Reference Marnewick, Retief, Theron, Wright and Anderson2015).
Rudd’s Lark has long been suspected to be in decline (Maphisa et al. Reference Maphisa, Donald, Buchanan and Ryan2009). In Wakkerstroom, bird guides concur that they are finding far fewer Rudd’s Larks than a decade ago. However, this could be based in part on repeated visits to Fickland Pan (27°13’56"S, 30°2’27"E) which is communally owned and therefore easy to access compared to privately owned farms. If a decline at such key sites is real, large-scale relocation of larks is unlikely to be the explanation, given that their core habitat has declined in the area and the remaining strongholds are not well-connected spatially. The need to clarify Rudd’s Lark’s current status and distribution is also pressing in light of a recent modelling study that identified the birds of South Africa’s grassland and fynbos biomes as those predicted to be the most vulnerable to climate change (Huntley and Barnard Reference Huntley and Barnard2012). Rudd’s Lark and Botha’s Lark were predicted to be the worst-affected species, with both potentially losing all of their suitable climatic space by 2085 under two of the four future climate scenarios modelled (Huntley and Barnard Reference Huntley and Barnard2012).
In 2002–2004 (hereafter 2002), DHM carried out an intensive, transect-based survey of Rudd’s Lark in the greater Wakkerstroom area, a subset of the Grasslands IBA. This study revealed that Rudd’s Lark occurred at a low density within a locally fragmented distribution, and that it preferred annually burned and lightly grazed grassland, with shorter-than-average grass height (Maphisa et al. Reference Maphisa, Donald, Buchanan and Ryan2009). The main threats identified were late-season fires that shortened the breeding season and possibly exacerbated nest predation, suggesting that Rudd’s Lark survived best in habitat burned before the onset of the breeding season (Maphisa et al. Reference Maphisa, Donald, Buchanan and Ryan2009).
Here we report the results of a survey conducted in the immediate Wakkerstroom area in the early 2016 Rudd’s Lark breeding season, within the core area to which Rudd’s Lark was found to be confined by Maphisa et al. (Reference Maphisa, Donald, Buchanan and Ryan2009). In addition to exactly repeating transects carried out by DHM in 2004, we also added new transects within this core area. We used these data, first, to assess changes in the incidence (presence/absence) and abundance of Rudd’s Lark in this core area by comparing observations of the species between the two surveys. Second, we assessed which habitat variables were most closely associated with Rudd’s Lark incidence at two different spatial scales (transects and territories), and whether there had been changes in specific habitat variables over this 12-year period. Finally, we test for changes in the timing and extent of fires (using remotely sensed data available annually for 2002–2016), since these have been suggested to influence Rudd’s Lark breeding success.
Methods
Study area
The town of Wakkerstroom is located in Mpumalanga Province, in the highlands of eastern South Africa. The surrounding grassland is one of the best remaining representatives of the Wakkerstroom Montane Grassland unit, and is composed of Moist Sandy Highveld Grassland, North-Eastern Sandy Highveld and Wet Cold Highveld Grassland (Mucina and Rutherford Reference Mucina and Rutherford2006). Topographically these grasslands are characterised by “high altitude plateaus and undulating plains” (Little et al. Reference Little, Hockey and Jansen2015). Rainfall is 800–1,250 mm per year (Mucina and Rutherford Reference Mucina and Rutherford2006). Land-use is predominantly privately-owned large-scale livestock farming, particularly of beef cattle and sheep (Muchai Reference Muchai2002).
Transects
We selected a core range within the 2002–2004 study area based on extensive searches by DHM (Maphisa et al. 2004) to prioritize data collection in the field, given the time and resources available. This included 44 of the 103 original transects surveyed in 2002, and 12 of the 13 original transects where Rudd’s Lark was recorded. The core range of the 2016 study was approximately 380 km2 in size (compared with the original area of approximately 1,200 km2) and is located predominantly to the north-west of Wakkerstroom (Figure 1). The 44 selected transects were further reduced to 33 because seven transects had been ploughed and the grassland converted to agriculture in the interim, two were within a hunting reserve with restricted access, one was substantially covered with thickets, and one could not be re-located owing to GPS error. The original transects were positioned at 2-km intervals along public roads and were of variable lengths, depending on topography, and extended to a maximum of c.1 km perpendicular from the road into the grassland. The transect angle and length were adjusted where necessary to avoid unsuitable habitat such as waterbodies. Minor GPS inaccuracies were accounted for by starting next to the road and reproducing original transect length (mean = 769 m; median = 890 m).
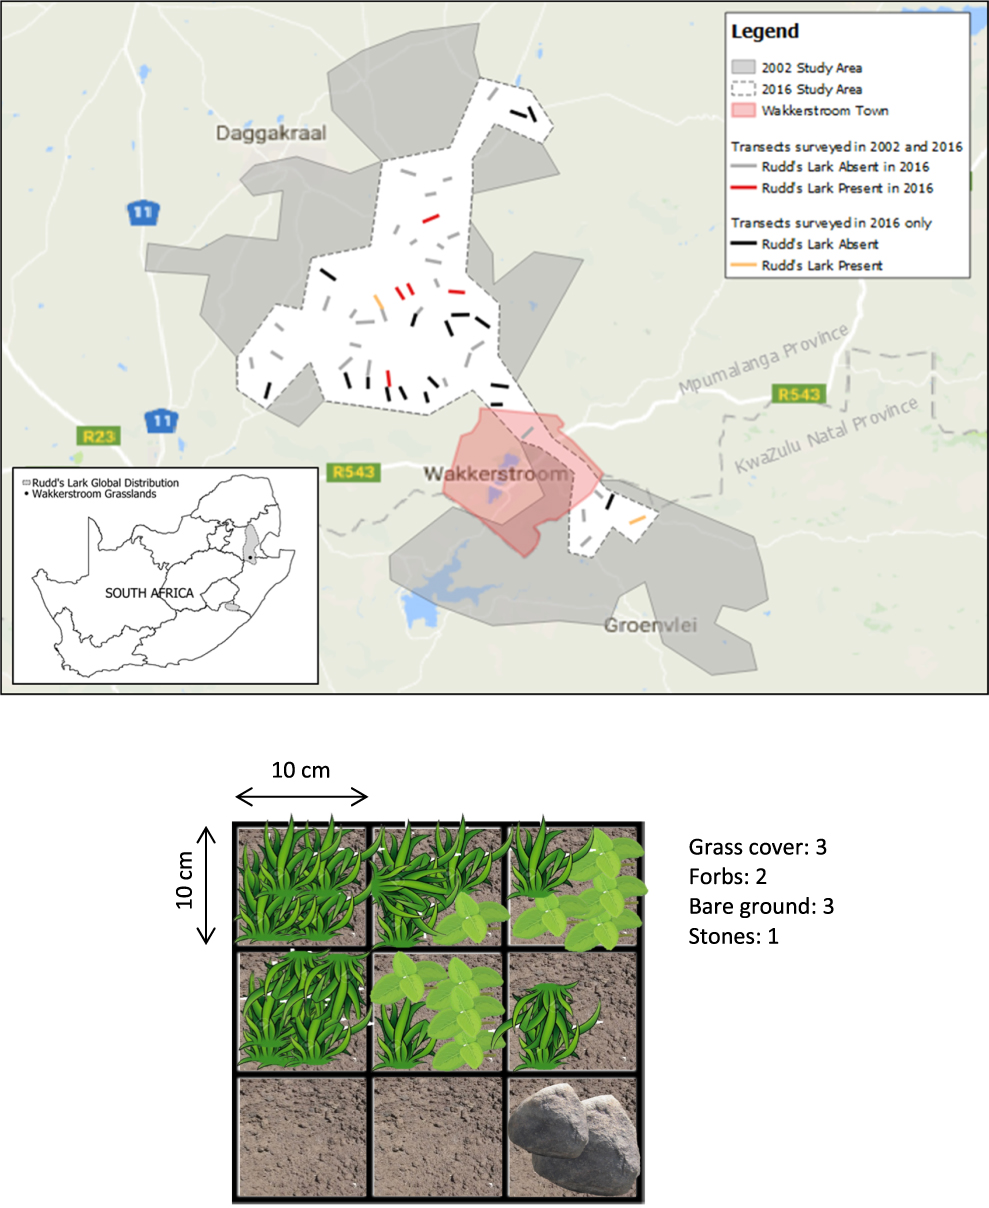
Figure 1. Map of the Wakkerstroom region, South Africa, showing the area surveyed by David Maphisa in 2002 and the reduced “core” area surveyed in 2016. 19 new transects were added to 33 of the original 2002 transects, resulting in a total of 52 transects in 2016. A diagram of the vegetation survey quadrat laid on each side of the transect at 100 m intervals during vegetation analysis is also shown (over an example of ground cover).
To assess whether declines in Rudd’s Lark in this core area could be explained by local re-distribution of birds, we defined a further 19 new transects within this core area, bringing the total number of transects surveyed to 52 for 2016. These new transects were located at least 1.5 km apart, or on opposite sides of the road to existing transects to ensure that there was no double-counting of individual birds.
Transect surveys were conducted on foot between 20 November 2016 and 17 December 2016, tracked by GPS, and totaled 37.55 km. This time period corresponded with the first survey conducted from 20 November 2002 to 10 January 2003, to coincide with the peak in territorial activity of male Rudd’s Larks (Maphisa et al. Reference Maphisa, Donald, Buchanan and Ryan2009). Transects were walked between 06h00 and 10h00 because males sing or display most actively during this period (Maphisa et al. Reference Maphisa, Donald, Buchanan and Ryan2009). Each transect was walked by a team of two and always included a local bird guide (either David Nkosi or Norman Ncube, both of whom have over 10 years’ field experience of Rudd’s Lark; David Nkosi also assisted with the 2002 survey). This differed slightly from the 2002 survey in which the principal observer, DHM, walked some transects alone. However, all of the 2002 and 2016 transect surveys were conducted with at least one observer present who had significant experience with the target species. Transects took an average of 18 minutes to complete from start to finish, including stops to identify and record birds.
When a Rudd’s Lark was detected, we estimated its location as precisely as possible and recorded its location with a GPS. This point was regarded as representative of the lark’s “territory”, for purposes of vegetation sampling (see Vegetation Surveys). In a few cases, we encountered additional singing or displaying birds not on pre-defined transects. These opportunistically surveyed individuals were included in the analysis of territory-scale habitat use, but only records of singing males encountered from transects were used in analyses of population change.
Estimating detection probability
The first round of transect surveys covered all 52 transects (20 November–7 December 2016). A subset of these transects (n = 23) was repeated in a second round of counts (7–14 December 2016) to assess the detection probability of Rudd’s Lark. Of this subset, 16 transects were from the 2002 survey and seven were new transects that had only been covered in 2016. We prioritised transects with apparently high habitat quality in which Rudd’s Larks were previously encountered, since the aim was to assess the likelihood of a bird being detected a second time if it were present during the first survey. For this subset of transects we used occupancy modelling to determine the detection probability of Rudd’s Lark for the survey. This is because detection error complicates the estimation of species occurrence, as it is difficult to separate the effects of ecological processes from detection processes in the analysis. Occupancy modelling uses repeated surveys to adjust for the detection process in estimates of occurrence (MacKenzie et al. Reference MacKenzie, Nichols, Royle, Pollock and Bailey2006). The overall detection was c.60%, which suggests that more repeated sampling is needed to better survey this species or that the collection of data on the parameters that affect detection is needed. We assume that detection was similar in the 2002 survey as DHM (in 2002), David Nkosi (2016) and Norman Ncube (2016) are all very familiar with Rudd’s Lark and one of these observers was present for all transect surveys. Thus, re-assessment of incidence between the two survey periods is likely to be comparable.
Vegetation surveys
Vegetation was sampled at 100-m intervals on the return walk of each transect, following the exact methods outlined in Maphisa et al. (Reference Maphisa, Donald, Buchanan and Ryan2009). A 0.3 x 0.3-m quadrat, divided into nine 10 x 10-cm squares, was randomly laid (c.5 m) on either side of the transect. Each 10cm2 square was scored based on its dominant cover (grass, forbs, bare ground, stones or moribund vegetation) and these squares were summed and recorded as a proportion out of the total 9 squares in the quadrat (Figure 1). The average grass height recorded based on the measured height at each corner of the quadrat. Moribund vegetation did not include burned vegetation. At each sampling point, one assessment of grazing (ordinal: heavy, light or none), fire (binary: burned or unburned within the past 12 months) and altitude were also recorded (Maphisa et al. Reference Maphisa, Donald, Buchanan and Ryan2009). At Rudd’s Lark territories, 10 quadrats were laid at random within c.20 m of where the bird had been recorded, and vegetation sampling conducted for each as above. Random re-sampling reduced this to two samples per territory for comparison with the 100-m transect samples. Immediately prior to 2016 data collection, DHM demonstrated in the field how birds and vegetation were recorded during the 2002 survey, to ensure methods were consistent.
Comparison of Rudd’s Lark incidence and abundance between 2002 and 2016
We used a Generalized Linear Mixed Effects Model (GLMM) with a binomial response variable and logit-link function to compare the probability of encountering a Rudd’s Lark on transects between the two survey periods (Bates et al. Reference Bates, Maechler, Bolker and Walker2015). Survey year (2002 or 2016) was included as the fixed effect and transect ID as a random effect. The model estimate was back-transformed from the logit scale to determine the change in probability of encounter. To test for a change in the abundance of Rudd’s Lark per transect we used a GLMM with a Poisson distribution and log-link function, and again fitted year and transect ID as the fixed and random effects respectively. For both models, 95% confidence intervals were determined to assess significance of the fixed effects. All GLMMs were performed in R statistical software v3.4.0 (R Core Team 2017) with functions from the lme4 package (Bates et al. Reference Bates, Maechler, Bolker and Walker2015).
Habitat use by Rudd’s Lark in 2016
To identify the habitat variables most associated with Rudd’s Lark incidence on transects in 2016, we modelled the presence or absence of Rudd’s Lark against the mean vegetation scores and modal value for grazing and fire per transect. Ideally a GLMM procedure should be used for this analysis as individual vegetation quadrats were nested within transects. Unfortunately, due to the zero-inflated nature of the data and very few recorded incidences of Rudd’s Lark, there was no convergence in the GLMMs. We thus used a generalized linear model (GLM) and calculated the mean vegetation values per transect as a predictor of Rudd’s Lark incidence, instead of using quadrat-level data nested within each transect.
Tests for collinearity between the five ground cover variables (proportion of grass, bare ground, forbs, stones, and moribund vegetation), the average grass height and the altitude showed mostly weak correlations between the variables (Rs < 0.6) (see Figure S1 in the online supplementary material). However, the proportion of grass per transect was negatively correlated with the proportions of bare ground, forbs and moribund vegetation (Rs > 0.6), and since grass was already accounted for through the measurement of grass height, this variable was excluded from the analysis. Fire and grazing were ordinal variables and not included in the correlation tests, but the variance inflation factors (VIF) were checked for all final models and these values were all well below 3.5, indicating that correlation amongst predictors was not an issue.
The habitat variables predicting the incidence of Rudd’s Lark on transects were modelled with a binomial error distribution and logit-link function. The significance of each habitat variable was assessed with likelihood ratio tests (LRT) between the model containing the predictor variables, and the null model. All statistical analyses were conducted with R statistical software using functions from base R V 3.4.0 (R Development Core Team 2017).
We also tested whether or not the variables describing lark incidence at the transect level were consistent at the territory scale. We used a principal component analysis (PCA) to test which of the habitat variables consistently co-varied together and described variance in territory choice (PC1 explained 37% and PC2 29% of the variance in habitat variables). Tests for spatial autocorrelation were conducted at both the transect and territory scale (see online supplementary materials).
Transect vegetation comparison between 2002 and 2016
To assess whether key habitat variables predicting Rudd’s Lark incidence in 2016 had changed significantly between the two sampling periods, we used a GLM to compare the change in mean vegetation values per transect between 2002 and 2016. Since previous studies suggested that grass cover and grass height are important suitability variables for grassland birds, including Rudd’s Lark (Maphisa et al. Reference Maphisa, Donald, Buchanan and Ryan2009, Reference Maphisa, Smit-Robinson, Underhill and Altwegg2016), these were selected as response variables, along with forb and bare ground cover, since inspection of the raw data suggested these variables had changed between surveys. For the grass, forb and bare ground cover, the GLMs were fitted with a binomial distribution and logit-link function. For average grass height, the normally distributed response variable was fitted with Gaussian distribution. To assess potential drivers of these vegetation changes, model sets also included fire and grazing as additional covariates.
Landscape data on fire incidence and land use
We assessed fire history in the 2016 core study area for the period 2002–2016 to determine whether fire regimes had changed since the 2002 survey. This was done using data from the Fire Information for Resource Management System (FIRMS) available through the Google Earth Engine (Google Earth Engine Team 2015). FIRMS delivers active fire data at a spatial resolution of 1 x 1 km and a temporal resolution of 1–2 days. If the timing of fires has shifted significantly during this period, it could help to explain changes found in the Rudd’s Lark population, since late burning has been suggested to be detrimental to lark breeding success (Maphisa et al. Reference Maphisa, Donald, Buchanan and Ryan2009).
For the annual timing of fires, two four-month periods were selected: early-season (July–October) and late-season (November–February). These corresponded with expected “non-harmful” and “harmful” effects on Rudd’s Lark nesting success respectively, following conclusions of the previous survey (Maphisa et al. Reference Maphisa, Donald, Buchanan and Ryan2009). Data were extracted from Google Earth Engine and clipped to our core area (380 km2) in ArcMap 10.2 (ESRI 2013), where the average number of early-season and late-season fires per km2 per year was calculated.
To test whether there had been an increase in crop production and a decrease in available grassland in the core area occupied by Rudd’s Lark, we analysed data from the 72-Class GTI South African National Land Cover Dataset (GEOTERRIMAGE 2015) for two point samples in 1990 and 2013 (the only years where these data were available at a suitably fine scale). Further information and analysis of these data can be found Table S1 and Figure S2.
Results
Change in Rudd’s Lark incidence and abundance between 2002 and 2016
In total, 17 territory-holding Rudd’s Larks (i.e. singing males) were recorded between 20 November and 17 December 2016. In the initial round of the 52 transects, Rudd’s Lark was recorded on only five transects, comprising a total of nine singing males. For the second round (a repetition of 28 out of the 52 transects), Rudd’s Lark was again present on five transects. These included two transects on which the species had not been detected in the first round (thus increasing the overall number of transects where Rudd’s Lark was present to seven), and two transects on which Rudd’s Lark had been detected in the first round but not the second. The number of individuals detected increased from nine to eighteen (i.e. nine additional birds were detected in the second survey). Pooling both rounds from the 2016 survey, the maximum numbers of larks simultaneously found per transect were as follows: three transects contained a single male, one transect had three males, two transects had four males and one transect had six males.
Of the 33 transects common to both the 2002 and 2016 surveys, Rudd’s Lark was found on nine transects in 2002 (comprising 32 individuals), and on five in 2016 (comprising 9 individuals). There was significantly lower probability of encountering Rudd’s Lark in 2016 compared to 2002 (Estimate β: -5.67; 95% Confidence Intervals CI [-11.18; -1.11]; probability = ∼ 0–27% lower). Similarly, there were significantly fewer Rudd’s Lark individuals in 2016 compared to 2002 (β: -1.27; CI [-2.06; -0.57]).
Rudd’s Lark habitat use in 2016
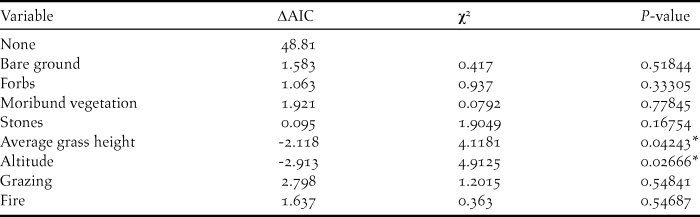
Two habitat variables were significant predictors of Rudd’s Lark presence on transects in 2016 (Table 1): Rudd’s Larks occurred more frequently on transects with short grass (β: -1.25, P = 0.04), and at higher altitudes (β: 1.69, P = 0.03).
Table 1. Likelihood ratio tests indicating habitat variables that had a significant effect on Rudd’s Lark habitat selection in 2016. Δ AIC represents the change in AIC upon removal of the variable from the model. χ2-values and P-values of likelihood ratio tests are given. * indicates significance in the effect of the variable (< 0.05).
Analysis of lark habitat use at the territory scale showed similar results to the transect scale (Figure 2). The first two principal components (PCs) explained 66% of the variance in Rudd’s Lark presence. The first principal component showed strong positive loadings of altitude (0.535) and forb cover (0.505), but negative loadings of moribund vegetation (-0.545), and explained 37% of the variance. The second principal component showed strong negative loadings of grass height (-0.609), but positive loadings of bare ground cover (0.576) and explained 29% of the variance. In summary, Rudd’s Lark territories were associated with higher altitude, higher cover of forbs, and shorter grass, compared to the surrounding grassland.
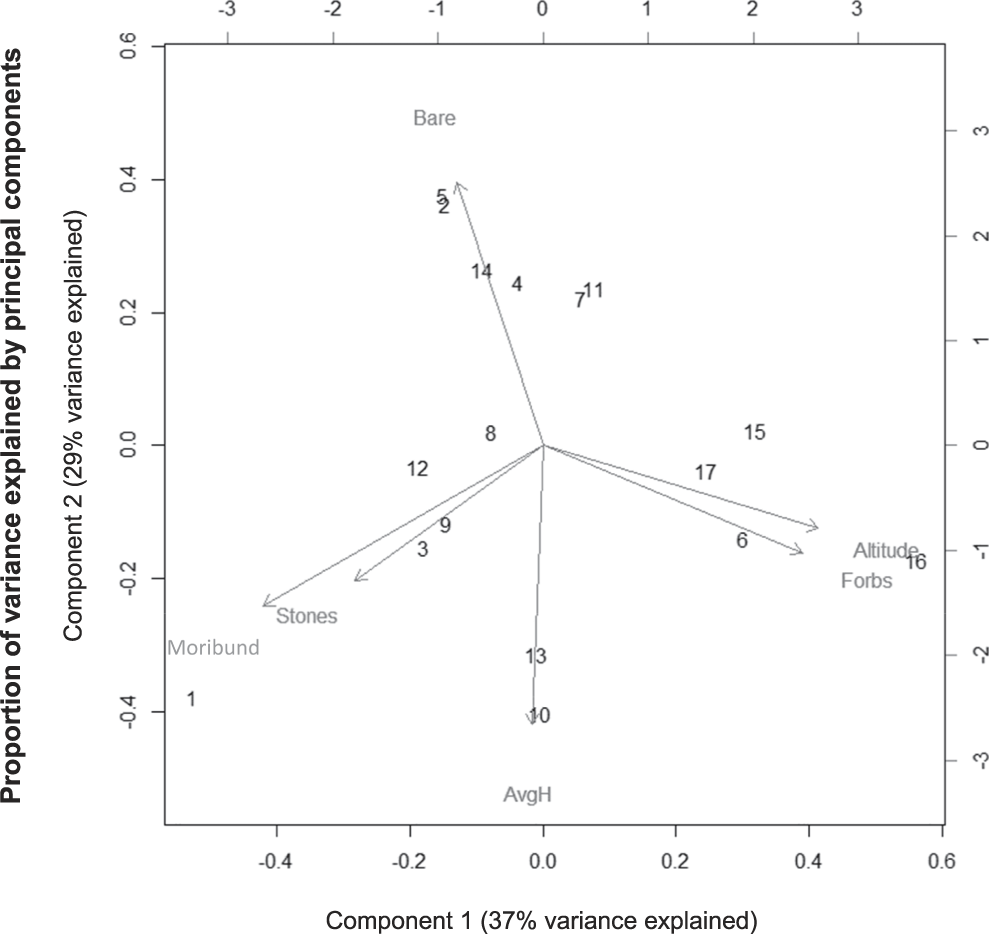
Figure 2. Analysis of lark habitat use at the territory scale using a principal component analysis. Input variables consisted of bare ground cover (“Bare”), forb cover (“Forbs”), stone cover (“Stones”) and moribund vegetation cover (“Moribund”), as well as average grass height (“AvgH”) and altitude. Numerical values on the graph represent individual Rudd’s Lark territories. The first principal component (“Component 1”; x-axis) explained 37% of the variance, while the second principal component (“Component 2”; y-axis) explained 29% of the variance.
Vegetation change between 2002 and 2016
Four environmental variables were assessed to determine whether habitat variables thought to be important predictors of Rudd’s Lark habitat use had significantly changed between the two survey periods. There was no significant difference between the height of the grass (β: -0.01, P = 0.98) or the proportion of grass cover (β: -0.04, P-value = 0.95), bare ground (β: -0.22, P = 0.78) or forbs (β: 0.45, P = 0.71) between surveys in 2002 and 2016.
Landscape data on fire incidence and land use
Early-season fires occurred at an annual average frequency of 0.361 per km2 between July and October over the past 12 years in the core study area (Figure 3A). The minimum was 0.136 (2015) and the maximum was 0.831 (2002). Late-season fires in the 2016 core study area occurred at an annual average frequency of 0.051 per km2 between November and February over the past 12 years (Figure 3B). The minimum was 0 (2006/2007, 2012/2013 and 2016/2017), and the maximum was 0.314 (2013/2014).

Figure 3. Annual average fires per km2 from 2002 to 2016 for (A) early-season fires and (B) late-season fires, deemed non-harmful and harmful respectively in terms of Rudd’s Lark nesting success.
Analysis of the National Land Cover Dataset showed a 6.61% increase of grassland in the core study area between 1990 and 2013 (from 75.71% to 80.72% of the total area), while rain-fed crops decreased by 29.67% (from 16.67% to 11.72% of the total area) (OSM Figure 1A). High-intensity irrigated crops, plantations and urban cover all increased between the two surveys, although these cover types occur at much smaller proportions of the total area than grassland and rain-fed crops (OSM Figure 1B). Orchards were absent in 1990, but represented 0.03% of the total area in 2013.
Discussion
Rudd’s Lark is subject to the classic “double jeopardy” of low abundance and narrow distribution, which equate to a high risk of extinction (Gaston Reference Gaston1998). Its persistence in the Wakkerstroom area is crucial to its conservation, given that this fragment appears to be one of few remaining strongholds (Maphisa et al. Reference Maphisa, Donald, Buchanan and Ryan2009, Taylor et al. Reference Taylor, Peacock and Wanless2015, N. Theron in litt 2016). Assessing the decline of a species both low in abundance and cryptic in nature is a significant challenge (McArdle Reference McArdle1990, Garza et al. Reference Garza, Suárez, Herranz, Traba, García de la Morena, Morales, González and Castañeda2005). Moreover, Rudd’s Lark occurs in a mosaic of farmland where different land-use, ownership and management strategies add to the complexity of conservation and research initiatives.
Change in population size
This study provides evidence that a decline has occurred in the Wakkerstroom area: Rudd’s Lark was recorded both in lower absolute numbers, and with a significantly lower probability of encounter in 2016 compared with 2002. Seven previously grassland transects, two of which formerly contained Rudd’s Larks, had been lost to intensive crop production by 2016. We could not obtain permission to resurvey these transformed sites, but they are highly unlikely still to be inhabited by Rudd’s Larks. Furthermore, surveys were carried out at the same time of year and where possible at similar times of the day. Both surveys were conducted with one observer who was very familiar with Rudd’s Lark present on all transect walks, so we are confident that any vocalizing or displaying birds on transects were detected. Finally, our findings support the results of the study by Lee et al. (Reference Lee, Altwegg and Barnard2017) that assessed the Rudd’s Lark population in the context of the first and second South African Bird Atlas Projects (1987–1992 and 2007–present, respectively), as well as the impression of decline held by many of the local guides familiar with the species. While we cannot exclude that other factors might have influenced propensity to display between study periods, taken together these considerations suggest that decline of Rudd’s Lark is likely to be real and of concern for a threatened species.
Nonetheless, other factors could have affected Rudd’s Lark incidence between the study periods. The season’s phenology may have differed between years, potentially introducing differences in timing of breeding. If birds did start breeding earlier in 2016 than in 2002, for example, as suggested by observations of nests at Fickland Pan, this could affect detectability if singing consistently declines after breeding commences. In this event, we would expect detectability of this species to also decline within the season (de Juana et al. Reference de Juana, Suárez, Ryan, Alström, Donald, del Hoyo, Elliott and Christie2004). However, when repeating a subset of the transects an average of 12 days after the first 2016 sample, we detected larks on the same number of transects (n = 5). This observation suggests that larks did not appear to be singing less as the season progressed, which implies that any difference in breeding phenology between 2002 and 2016 is unlikely to have affected detectability. Given the low sample encounter rate, further, consistent monitoring is needed for a more robust assessment of the influence of breeding and seasonality on detection.
Rudd’s Lark habitat use in 2016
Our limited data for 2016 suggest that transects where Rudd’s Lark were detected had significantly shorter average grass height and higher altitude, which agree with existing literature on the species (Hockey et al. Reference Hockey, Allan, Rabelo and Dean1988, Maphisa et al. Reference Maphisa, Donald, Buchanan and Ryan2009). Analyses at the scale of individual Rudd’s Lark territories concurred, and additionally suggested that Rudd’s Lark favours habitat with more forbs and less moribund vegetation and bare ground.
Landscape data on fire incidence and land use
Late burning (November onwards, when fires pose a threat to Rudd’s Lark nestling survival) has been suggested as a potential driver of the suspected decline in Rudd’s Lark numbers (Maphisa et al. Reference Maphisa, Donald, Buchanan and Ryan2009). The results of the remotely-sensed fire data analysis showed that non-harmful early-season fires between July and October occur seven times more frequently than the harmful late-season fires between November and December (0.361 per km2 per year compared to 0.051). Early-season fire frequency appears to have decreased over the past four years, but late-season fire frequency has been low and fairly stable over the past 12 years, except for one spike in 2013/2014. Therefore, the general trend is not towards more frequent and later fires that might be expected if fire were a significant driver of Rudd’s Lark decline or habitat degradation. However, the spike in 2013/2014 may have represented a catastrophic event for the Rudd’s Lark population in the Wakkerstroom area given its small population size.
Anecdotally, we note that the territories of six Rudd’s Larks (the highest number recorded for any single transect in 2016) were recorded in an area that for decades had been burned earlier in the year than the rest of the farm. While a single case is not conclusive, this could merit further investigation.
Although the land cover data intervals do not match the survey years, they still serve as a useful indicator of landscape-level changes in the Wakkerstroom grasslands over a time period relevant to the plight of Rudd’s Lark. High intensity irrigated crops have increased by 127% across the lark’s core range around Wakkerstroom between 1990 and 2013 (albeit still comprising less than 1% of the landscape). Conversely, they showed a 7% increase in grassland and a 30% decrease in rain-fed crops. This suggests that the remaining grassland habitat may either be unsuitable at a finer scale or not fully occupied by the current Rudd’s Lark population in the area, consistent with our only partial ability to predict Rudd’s Lark incidence based on variation in vegetation structure within grassland habitat.
Recommendations and threat status
Rudd’s Lark has already disappeared from sections of its former range (N. Theron and R. Colyn in litt. 2016); Wakkerstroom is one of the key remaining areas where conservationists and landowners must collaborate if this species is to survive. The observed conversion of grassland to croplands (including two transects that previously held Rudd’s Lark) is of serious concern given the species’ patchy distribution and small population size. Within the remaining grassland habitat, during our 2016 survey three or more Rudd’s Lark males with territories were detected along four of the seven transects where the species was recorded, and these locations could offer critical habitat patches for the species. Long-term monitoring of these micro-populations and their vegetation would be prudent for early detection of further declines. Our findings are consistent with current management recommendations that optimal Rudd’s Lark breeding habitat can be either burned or unburned, so long as burning is not carried out late in the season (BirdLife South Africa 2015).
Birdlife South Africa is currently liaising with landowners in southern Mpumalanga and the eastern Free State and has provided documents on “bird-friendly burning and grazing best-practice for grasslands” within its remaining habitat (R. Colyn in litt 2018, BirdLife South Africa 2016). The paucity of incidence data means that it is difficult to offer strong conclusions on Rudd’s Lark habitat preference, which limits the scope for more nuanced management recommendations. Future studies might need to consider a potential role for finer-scale floristic composition, such as specific grass and forb assemblages and their susceptibility to grazing regimes, as determinants of habitat suitability. In particular, the herbaceous shrub Hilliardiella aristata merits further attention, since it was anecdotally noted by farmers and bird guides to have increased in the area, and we never recorded it within Rudd’s Lark territories.
Our data provide localised support for the recent uplisting of the IUCN threat category for Rudd’s Lark from ‘Vulnerable’ to ‘Endangered’ (BirdLife International 2017). Although the IUCN assesses the global population of a species, the Wakkerstroom area is representative of its high-altitude grassland habitat. Three of our findings in the Wakkerstroom area in 2016 correspond to IUCN criterion A2 defining a species as ‘Endangered’ (IUCN SSC 2001): first, a 72% decline in detected individuals along transects between the 2002 and 2016 surveys, and second, a failure to detect the species at sites where it was previously present (corresponding to “an observed population size reduction of > 50% over the last 10 years … based on direct observation”). Third, an irreversible loss to cultivation of previously occupied sites (corresponding to “the reduction and its causes may not have ceased OR may not be understood OR may not be reversible, based on (a) direct observation and (c) a decline in area of occupancy and extent of occurrence”). If the drivers of the decline at Wakkerstroom are also operational in other Rudd’s Lark populations, then the species may be in serious difficulty.
Supplementary Material
To view supplementary material for this article, please visit https://doi.org/10.1017/S095927091900011X
Acknowledgements
We thank Julian Francis for kindly funding the fieldwork in 2016; David Nkosi and Norman Ncube for expert assistance in the field; the farmers of Wakkerstroom for permission to survey their land; Nicholas Theron and Robin Colyn (BirdLife South Africa) for helpful advice and discussion; Kristi Garland for support at BirdLife South Africa Wakkerstroom Centre; Nigel Collar for encouragement; and Derek Engelbrecht, Paul Dolman and three anonymous referees for helpful comments. WGG was supported by the National Research Foundation, and the University of Cape Town. CS was part supported by a BBSRC David Phillips Research Fellowship (BB/J014109/1).


