Introduction
Commercial high-resolution satellite imagery has become a powerful tool in the field of cultural heritage. This imagery allows researchers to confirm the location of published sites, as well as to locate and document new sites. Many collaborative projects documenting looting and other forms of destruction to archaeological sites in areas of Syria and Iraq controlled by the so-called Islamic State, and in other zones of conflict across North Africa and the Middle East, employ visual analysis of such imagery (e.g. Cunliffe Reference Cunliffe2013; Bjørgo et al. Reference Bjørgo, Boccardi, Cunliffe, Fiol, Jellison, Pedersen and Saslow2014; Wolfinbarger et al. Reference Wolfinbarger, Drake, Ashcroft and Hanson2014; Al Quntar et al. Reference Al Quntar, Hanson, Daniels and Wegener2015; Casana 2015; Stein Reference Stein2015; Parcak et al. Reference Parcak, Gathings, Childs, Mumford and Cline2016). Quantitative data on looting coverage and changes in looting over time remain difficult to collect, however, because individuals need training to examine imagery and trace disturbances in the surface of a site. Here we present a methodology that significantly improves the speed and accuracy of the analysis of remote sensing data for heritage documentation. This is achieved through the semi-automated detection of looters’ pits using multispectral satellite imagery.
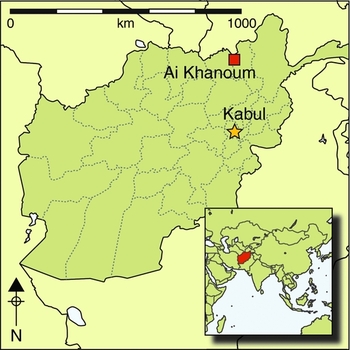
Our method consists of a two-step process, carried out using GIS software, and tested on the site of Ai Khanoum in Afghanistan (Figure 1). First, principal component analysis (PCA) was used to isolate areas of an image that have a spectral signature similar to that of looters’ pits that have already been identified on pansharpened imagery. This first step produces many false positives that correspond to other types of depressions in the surfaces of the sites. The second step excludes these false positives by using empirically established geometric properties of looters’ pits to exclude these false positives. The final results give an image of the site with polygons marking individual looting pits. From these, the number of pits and the spatial extent of looting can be calculated. The power of our method lies in its ability to facilitate quick, quantitative measures of looting over time while keeping in step with any new release of satellite imagery.

Figure 1. The archaeological site of Ai Khanoum, in Takhar Province, north-eastern Afghanistan. (WorldView-2 imagery, dated 8 November 2010.)
Use of remote sensing to monitor looting patterns
Satellite imagery and GIS technology have transformed our ability to monitor and prevent the destruction of archaeological sites (Contreras Reference Contreras2010; Contreras & Brodie Reference Contreras and Brodie2010; for a recent review, see Hritz 2014: 252–55). The correlation between conflict, weak governmental infrastructure and looting makes it, in many cases, nearly impossible for archaeologists or cultural heritage professionals to monitor threatened sites on the ground. Satellite imagery has offered an important solution to this problem, particularly as it has increased in spatial and temporal coverage. Images are taken with increasing frequency, sometimes only hours or days apart, allowing archaeologists to observe some types of ongoing or potential future damage, and even assess the level of group organisation behind this damage. In southern Iraq, a time-series of high-resolution imagery has enabled cumulative quantification of looting holes at individual sites since the 2003 invasion, as well as analysis of regional spatial patterns in the sites that have been targeted for looting (Hritz Reference Hritz2008; Stone Reference Stone2008; Hanson Reference Hanson and Stone2011, Reference Hanson2012: 150–80). A team led by Van Ess focusing on the site of Uruk has attempted to automate the process of identifying looting events in satellite imagery, but using different data, software and modelling approaches to those we employ. This team used panchromatic IKONOS satellite imagery and object-oriented image analysis software (Definiens Developer) to identify archaeological sites, architecture and looting pit clusters through similarity to previously identified objects, or through a list of parameters determined by the developers (Van Ess et al. Reference Van Ess, Becker, Fassbinder, Kiefl, Lingenfelder, Schreier, Zevenbergen, Strobl, Blaschkle and Griesebner2006: 671, 673–74). Researchers have also used combinations of high-resolution imagery and spatial autocorrelation statistics to monitor sites in Peru (Lasaponara & Masini 2010; Lasaponara et al. Reference Lasaponara, Leucci, Masini and Persico2014).
Drones and photogrammetric methods now provide an alternative method for identifying looting at sites that are outside conflict zones and may be accessed. Images captured from drones can be used to produce 3D models of archaeological sites with a resolution of 10–20mm per pixel (e.g. Hill et al. Reference Hill, Rowan and Kersel2014; Kersel & Hill Reference Kersel and Hill2015). Aerial mapping at the site of Fifa in Jordan allowed the excavators to document looting pits that targeted individual burials, and this method, in the future, could even allow the volume of these pits to be measured (Salopek Reference Salopek2014). Similarly, a combination of high- and medium-resolution imagery was used in conjunction with 3D structure-from-motion images generated from pole-mounted ground photography to monitor damage to geoglyphs in coastal Peru (Hesse Reference Hesse2015).
The above case studies, as well as recent collaborative projects tracking looting in Syria and Iraq, have relied on panchromatic imagery and manual methods for counting and measuring looters’ pits. Some of the studies mapped thousands of individual pits via these time-consuming methods, and some of the collaborative projects have had to reassess looting on a monthly basis. It is useful to automate the process of identifying looters’ pits, especially given the large number of sites continuously targeted for looting in some conflict zones and the increasing availability of satellite imagery taken over shorter time intervals.
Multispectral imagery has not yet been employed for monitoring looting patterns, but provides an avenue for semi-automated detection. Additional bands measuring reflectance of non-visible wavelengths of light allow for analyses that can highlight particular landscape features or characteristics such as vegetation and soil type. The availability of such datasets has led archaeologists to pursue spectral-based (as opposed to object-based) automated methods for detecting archaeological sites (e.g. Altaweel Reference Altaweel2005; Saturno et al. Reference Saturno, Sever, Irwin, Howell, Garrison, Wiseman and El-Baz2007; Menze & Ur Reference Menze and Ur2012). The choice to replace trained human analysts has been critiqued (Casana Reference Casana2014), but manual methods cannot keep pace with the rapid accumulation of imagery, and automated detection systems will become increasingly essential. Furthermore, the inclusion of search parameters based on human-generated observations will help to overcome some of the pitfalls of automated detection.
A semi-automated method for detecting looters’ pits
While archaeological sites are constantly subject to a variety of threats, both natural and anthropogenic, looting is one of the more destructive types, as it endangers the physical integrity of the site and inhibits future scientific investigation. Furthermore, unlike other forms of damage, looting helps to support illicit markets built upon detrimental attitudes towards heritage conservation. Cultural heritage scholars and archaeologists must be able to identify threatened sites in order to prioritise resources for preservation and damage mitigation. We employed high-resolution multispectral imagery from the WorldView-2 satellite for the automated detection and mapping of looters’ pits. Launched in 2009, this is the first satellite to collect high-resolution multispectral data (with an optimal resolution of 1.85–2.07m per pixel, and eight total bands) (DigitalGlobe Corporation 2013). While panchromatic images from some DigitalGlobe satellites including WorldView-2 have been made freely available through Google Earth, Bing Maps and other platforms, multispectral versions of WorldView-2 images must be purchased.
Individual pits and disturbances are clearly visible on panchromatic WorldView-2 images, especially after pansharpening. The process of pansharpening is a common data-fusion technique that upsamples the spectral bands to the higher resolution of the panchromatic image. We used the Hyperspherical Color Transform preset in the ERDAS Imagine software, which is recommended for WorldView-2 imagery, but it is also possible to pansharpen imagery using different methods in ArcGIS and other software. Conversion to Top of Atmosphere Reflectance following the method described by DigitalGlobe ensured that pixel values more accurately represent the spectral radiation received by the satellite (DigitalGlobe Corporation 2010), rather than the original digital number. This process was carried out using the ArcGIS Raster Calculator.
Step 1. Isolating features with certain spectral properties
To isolate features in the image with spectral properties similar to those of looters’ pits, we applied PCA to multispectral imagery. PCA is a statistical method used in the analysis of multivariate datasets. Given an input with x number of dimensions, PCA reorders the dataset into x new outputs that account for the most variance within the whole dataset. In the case of multispectral satellite imagery, PCA can recombine data collected on the reflectance of visible and non-visible spectra of light, highlighting patterns in the landscape (Lillesand et al. Reference Lillesand, Kiefer and Chipman2004: 536–40). When the PCA input is an eight-band multispectral satellite image, the output consists of eight raster images that express decreasing amounts of variability in the dataset.
Experimentation with multispectral images for several archaeological sites in Afghanistan and Jordan showed that the fourth principal component displays looting pits most distinctively. While pit features are visible on all bands and components, they are particularly well contrasted from their surroundings in the fourth component raster (Figure 2). The fourth component raster appears well suited to large mounded sites lacking significant foliage cover. This fits many sites in the Near East, although other landscapes may be better described by different components. Using the Interactive Supervised Classification tool in ArcGIS, we defined training polygons on a pit, a spoil heap and an area of bare earth within the fourth principal component raster to specify pixel values of different classes. This classification isolates pixels corresponding to pits, which can be converted into polygons representing their location and extent. Inspection of PCA rasters produced from images taken in different seasons (wet and dry) suggests that the method is not greatly affected by moisture content, although data in the multispectral bands may be affected by other environmental or atmospheric variables. As with most detection methods, ours benefits from a clear contrast between the site and its surrounding landscape.

Figure 2. Satellite imagery showing part of the site of Ai Khanoum in Afghanistan. The six boxes show different features highlighted by each component of the principal components analysis. Note that looters’ pits are most clearly contrasted with their surroundings in component 4. Higher components have diminishing clarity. (WorldView-2 imagery, dated 8 November 2010.)
Not every pixel or group of pixels flagged by this process corresponds to a looting pit. Other features with negative topography in the landscape, such as irrigation canals and large pits created by mining, construction or other earth-working activities, often have spectral properties similar to looters’ pits, and are also highlighted by the analysis. These constitute the false positives mentioned in the introduction.
Step 2. Excluding false positives using geometric properties
We excluded false positives produced by the PCA and supervised classification using geometric properties (size and shape) common to most looters’ pits. Many false positives are too small or too large to correspond to a pit dug by hand, and can easily be eliminated. Other false positives do not take a shape common to most looting pits and can be excluded on the basis of their geometry. An index of circularity equal to 4π*area/perimeter2 allows the removal of improbable shapes, particularly long, linear features such as ditches or canals that do not usually represent looting.
Reasonable thresholds for excluding false positives were established using measurements from known looted sites across the Middle East and farther afield as a reference. Polygons were manually drawn around thousands of looters’ pits visible on high-resolution satellite imagery, and we then examined patterns in the geometric properties of these polygons in order to investigate pit size and the characteristics of these intrusions. The sample of sites was chosen to include a variety of landscapes, periods and patterns of looting, so that the observations would not be restricted to the specifics of a particular time or location. At the sites in our sample, Ai Khanoum (Afghanistan), Qarawal Tepe (Afghanistan), Isin (Iraq), Umma (Iraq), Fifa (Jordan) and Cahuachi (Peru), the area of the pits ranges from 2.9–10.49m2. Average pit perimeters range from 6.79–12.1m, while circularity indices range from 0.60010–0.835796. These observations (Table 1) could serve as a starting point for future analyses.
Table 1. Geometric properties of looters’ pits at six archaeological sites.
Application of the method to Ai Khanoum, Afghanistan
The history of looting in Afghanistan has remained understudied in comparison to other conflict zones in Syria, Iraq and Egypt. Since 2012, the Oriental Institute of the University of Chicago has collaborated with Afghan partners to carry out cultural heritage projects in Afghanistan (Stein Reference Stein2015). The Afghan Heritage Mapping Partnership focuses on documenting patterns of looting across the country, and requires quantification of the intensity of looting at individual sites. The scale of this endeavour inspired the development of a semi-automatic methodology for detecting looters' pits. The possibilities and success of the semi-automated methodology are illustrated by the results of our analysis of the site of Ai Khanoum in Takhar Province, Afghanistan (Figure 1). This 205ha site was probably the location for the city of Alexandria-on-the-Oxus, one of the primary cities of the Graeco-Bactrian kingdom, and was excavated in the 1960s and 1970s (Bernard Reference Bernard1967; Martinez-Seve Reference Martinez-Seve2014). The size of the site, its clear boundaries and its history of looting made it an ideal first candidate for analysis.
Following the PCA and supervised classification, the empirically established geometric ranges from Ai Khanoum were applied to restrict the polygon file to a group of features most likely to represent looters’ pits. We excluded features whose surface area was more than one standard deviation above and below the mean, as well as features whose circularity index was more than one standard deviation below the mean.
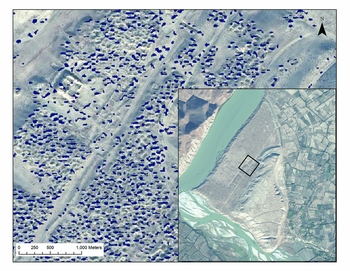
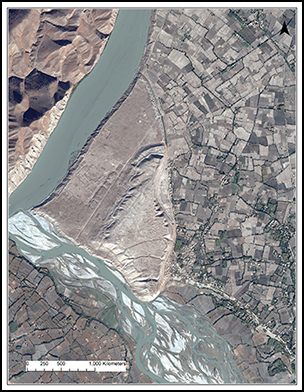
A comparison of the number of hand-drawn pits and computer-generated polygons shows that the semi-automated method registers 2364 pits as opposed to 2156 hand-drawn pits in test areas (Figures 3 & 4). The larger number of polygons comes not only from some remaining false positives, but also from some singular pits appearing as multiple polygons in the analysis raster. The total area of the pits identified by the automated method was 16801m2 in comparison to a manually calculated total area of 22306m2. The method also produces false negatives. Results show that at Ai Khanoum the automated method is less likely to detect shallow pits and pits located on the slopes between the different levels of the site. This means that older pits may have a higher chance of escaping detection, although at Ai Khanoum, the majority of pits appear to be quite deep. While some looting pits are not highlighted, and some legitimate polygons are removed in the exclusion process, the results, in aggregate, give a reasonable metric for looting at the site.

Figure 3. Pit polygons modelled with interactive, supervised classification of principal component raster at the site of Ai Khanoum, Afghanistan. Inset: the location of the area of the site shown in the figure. (WorldView-2 imagery, dated 8 November 2010.)

Figure 4. Pit polygons modelled with interactive, supervised classification of principal component raster at the site of Ai Khanoum, Afghanistan. Inset: the location of the area of the site shown in the figure. (WorldView-2, dated 8 November 2010.)
The method allows us to quantify the amount and intensity of looting at Ai Khanoum to an extent that would be impossible using manual methods (Figures 3 & 4). Using the procedures described above, we conclude that the number of looting pits at Ai Khanoum was 21095 in November 2010. The total surface area of the pits is estimated at 149041m2, representing approximately 17 per cent of the surface area of the site. This study is the first quantitative characterisation of the extent of looting at Ai Khanoum, and provides a baseline for determining whether looting has continued at the site since 2010.
Discussion and conclusions
We have explained and demonstrated the success of a semi-automated methodology that uses multispectral satellite imagery to automate the detection of looters’ pits on the surface of sites in Afghanistan. The method uses PCA and empirically established geometric properties to identify and measure individual pits. It allows for a much more rapid quantification of looting patterns than visual inspection, and uses pre-built functions found in commonly available GIS software. PCA outputs can be generated easily in ArcGIS or open-source equivalents, and the geometric calculations are very basic. PCA has been used previously at a regional scale to identify archaeological sites (Campana Reference Campana, Doerr and Sarris2003; Lasaponara & Masini Reference Lasaponara and Masini2007; Parcak Reference Parcak2009: 97–99; Agapiou et al. Reference Agapiou, Alexakis, Sarris and Hadjimitsis2013). In the case of large sites where high-resolution, multispectral imagery is available, PCA may be a viable method for analyses at the intra-site scale.
Access to a frequently updated repository of high-resolution imagery is essential for monitoring archaeological sites (Casana 2015), but such repositories currently only provide access to panchromatic imagery. A disadvantage to our approach lies in the cost of multispectral WorldView-2 imagery. DigitalGlobe insists on minimum purchases of 25km2, covering an area much larger than the size of any one archaeological site. Large portions of the purchased image will therefore not be of interest to the researcher focused on specific sites. If the cost and minimum purchase size decrease, or if multispectral products are added to high-resolution repositories, our semi-automated method could be quickly applied to multiple images of different dates in order to track changes in looting patterns over time. A record of these changes and patterns can provide an insight into the scale and nature of organised looting.
The methodology presented here has allowed us to quantify successfully the scale of looting at sites in Afghanistan, but it must be used in tandem with other archaeological and cultural heritage tools. Looting is only one type of damage to sites. Damage to standing architecture and encroachment by agriculture and other harmful activities require other types of assessment. Where possible, it is essential that ground-truthing accompanies remote efforts to analyse looting.
The rapid, rigorous quantification of the extent of looting at Ai Khanoum presented here provides a model that can be applied at a broad regional scale and that can make a major contribution to the documentation of heritage destruction in Afghanistan and other countries. Manual tallies of pit numbers and the area that they cover would take countless hours and be subject to various types of human error. The ability to document and quantify quickly and accurately the numbers and areas of looting pits allows cultural heritage stakeholders and authorities to lobby more effectively for resources and intervention. Our semi-automated method is both feasible and efficient, a useful addition to the cultural heritage toolkit that provides future avenues for both tracking damage to archaeological sites over time, and for communicating the massive scale and effects of looting across the Middle East to the public in quantitative terms.
Acknowledgements
The work presented in this paper was carried out in the Center for Ancient Middle Eastern Landscapes (CAMEL) at the Oriental Institute of the University of Chicago. Funds provided by the Afghan Heritage Mapping Partnership Grant from the US Department of State have supported the application of the method to archaeological sites in Afghanistan. We thank the Director of the Oriental Institute, Gil Stein, for his support and encouragement. We also thank Morag Kersel for helpful methodological discussions.
Author contributions: AL and JC designed the research and developed the methodology within the context of a broader project directed in 2014 by SB, and in 2014–2016 by EH. AL, JC and EH wrote the article.