


Introduction
Quantification of the physical forces that control Greenland ice velocities is an important step to refine modeled massloss predictions (Reference Alley and JoughinAlley and Joughin, 2012) and relies on continued monitoring and measurements within the Greenland ice sheet (GrIS) ablation region. Particularly lacking are measurements of ice temperature, which governs both basal sliding and internal deformation. Fast basal sliding requires a temperate bed (Reference Cuffey and PatersonCuffey and Paterson, 2010). Numerical simulations of frozen/melted bed conditions for the GrIS (Reference GreveGreve, 2005; Reference Brinkerhoff, Meierbachtol, Johnson and HarperBrinkerhoff and others, 2011) approximate basal sliding prevalence, but have only seldom been measured through ground-based observation. Deformation rates rapidly and nonlinearly increase with increased ice temperature, represented in the creep parameter, A, of the Nye–Glen flow law. This parameter is most sensitive to ice temperature, although it also varies with water content, grain size and impurities within the ice. Higher temperatures can soften the ice by an order of magnitude or more, where A increases by a factor of five to ten from –10°C to the melting point (Reference Cuffey and PatersonCuffey and Paterson, 2010). Deformational heating can create an important positive feedback on ice flow (Reference RobinRobin, 1955; Reference Ren and LeslieRen and Leslie, 2011), where ice deformation creates strain heating, and the warmed ice deforms more quickly, producing even more heating. This feedback is the most important near the base of the ice sheet, where stresses are at their largest.
Though ice-core temperature measurements near the ice divide of the GrIS exist (Reference WeertmanWeertman, 1968; Reference Gundestrup and HansenGundestrup and Hansen, 1984; Reference Alley and KociAlley and Koci, 1990; Reference Gundestrup, Dahl-Jensen, Johnsen and RossiGundestrup and others, 1993), direct measurements of englacial temperatures in the ablation zone are limited to several borehole measurements within and adjacent to Jakobshavn Isbræ (Reference Iken, Echelmeyer, Harrison and FunkIken and others, 1993; Reference Lüthi, Funk, Iken, Gogineni and TrufferLüthi and others, 2002) and along the adjoining Sermeq Avannarleq outlet glacier (Reference ThomsenThomsen, 1988; Reference Thomsen, Olesen, Braithwaite and BøggildThomsen and others, 1991). However, these profiles do not provide a consistent picture of the thermal structure of ice in the ablation zone. Jakobshavn Isbræ temperature data, while important, are not representative of typical ice-sheet conditions. No Sermeq Avannarleq profiles exhibit a temperate bed, limiting basal sliding as a mechanism for ice velocity and contrasting with typical model assumptions of sliding within the ablation zone. Additional full-depth temperature measurements for the GrIS within the ablation zone are required to further develop our understanding of its thermal state and will prove useful for input and comparison with numerical models.
Ice temperatures are indicative of controlling englacial and subglacial heat sources. Geothermal heat flux has been inferred from temperature gradients near a cold bed (Reference Hansen and LangwayHansen and Langway, 1966), and enhanced vertical stretching has been suggested as a mechanism for unexpected temperate basal thicknesses within the Jakobshavn Isbræ channel (Reference Funk, Echelmeyer and IkenFunk and others, 1994). Recent work investigating heating from the presence and refreezing of meltwater within the englacial hydrologic system suggests that this heating mechanism may greatly reduce the time required to warm the ice within the ablation zone of the GrIS (Reference Phillips, Rajaram and SteffenPhillips and others, 2010; Reference ColganColgan and others, 2011). Direct measurement of this phenomenon is so far absent but is crucial for validation of that theory.
Here we present 11 temperature profiles, collected at five sites along a 34 km east–west transect extending inland from the margin of Isunnguata Sermia, an outlet glacier on the western GrIS. Horizontal borehole spacing of 20–35 m at several sites along an ice flowline allows for the study of both local heat effects and the broader thermal structure within the ablation zone. We also discuss the implications of three specific regions of anomalous warming in the temperature profile data.
Field Sites and Methods
Isunnguata Sermia is a land-terminating outlet glacier of the western GrIS, located ~25 km northeast of Kangerlussuaq, Greenland. It terminates in a deep bedrock trough, which extends under the ice sheet up-glacier for ~20 km before deviating south and transverse to ice flow. Subglacial topography is dominated up-glacier by both troughs and ridges. Many of these features are not aligned with ice flow but apparently do not exert significant control on flow direction (Reference Jezek, Wu, Paden and LeuschenJezek, 2013). Boreholes were drilled during the 2010–12 field seasons using hot-water methods at five sites (Fig. 1), where each site is characteristic of a different glaciological setting. Site names, S#, are ordered by distance from the terminus (Table 1). Specific boreholes at a site are labeled alphabetically.
Table 1. Number of profiles, ice thickness, surface elevation and distance from terminus at five sites
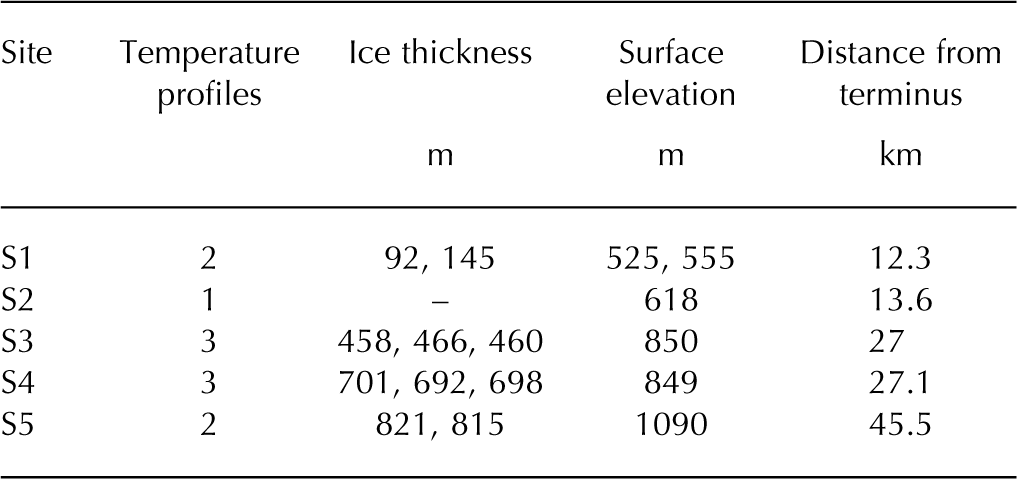

Fig. 1. Location of five drilling sites. Inset boxes show spacing of temperature profiles at each site. Flow directions for this region available in Jezek and others (2013).
S1 is located directly adjacent to the margin (300–830 m) and composed of shallow ice depths less than 150 m. This region is heavily crevassed and surface streams quickly enter the englacial system through moulins or crevasses. S2 is drilled within the deepest bedrock trough, ∼4 km from the margin. Here drilling did not penetrate the full ice thickness, reaching 700 m depth. S3 and S4 are 15 km inland, where S4 is ∼1 km north of S3 and along a parallel flowline (Reference Jezek, Wu, Paden and LeuschenJezek, 2013). S4 is drilled within a subglacial trough, so ice thickness here (∼700 m) is much greater than at S3 (∼460 m). Large supraglacial streams cross this area, and numerous moulins and crevasses have been observed up-glacier. Furthest inland, S5 is 45.5 km from the terminus and 815 m thick. No crevasses and one large moulin 1 km north have been observed. S3, S4 and S5 are all located in the region of draining supraglacial lakes.
Following drilling, boreholes were immediately instrumented with sensor strings. Temperature data were collected from dedicated temperature-sensing semiconductor chips. Sensor resolution is ∼0.062°C, calibrated to ∼0.1°C, and typically spaced at 20 m intervals. Data collection occurred during the September subsequent to the summer field season, and then a second time the following summer. Table 1 documents the number of boreholes with temperature profiles, ice thickness, surface elevation and distance from terminus.
Neighboring borehole profiles at S3, S4 and S5 are spaced 20–35 m apart. Unexpected ice thickness at the time of drilling for S2 hindered drilling to the bed and left insufficient sensor string lengths for the borehole depth. The S2 profile was only instrumented to 577 m depth. Data capture from S3-A did not yield the upper half of the profile.
Results
Temperature measurements collected 1 year after installation are shown in Figure 2. Temperature profiles exhibit higher temperatures with shorter distance to the margin. Cold interior ice warms from a minimum of –13.9°C at S5 to –5.9°C at S4 and –3.8°C at S3. The minimum temperature, at 400 m depth, at S2 is –4.2°C. S1 measurements, 300 and 830 m from the margin, are entirely temperate aside from evidence of the winter surface cold wave at 15 m depth in S1-B.
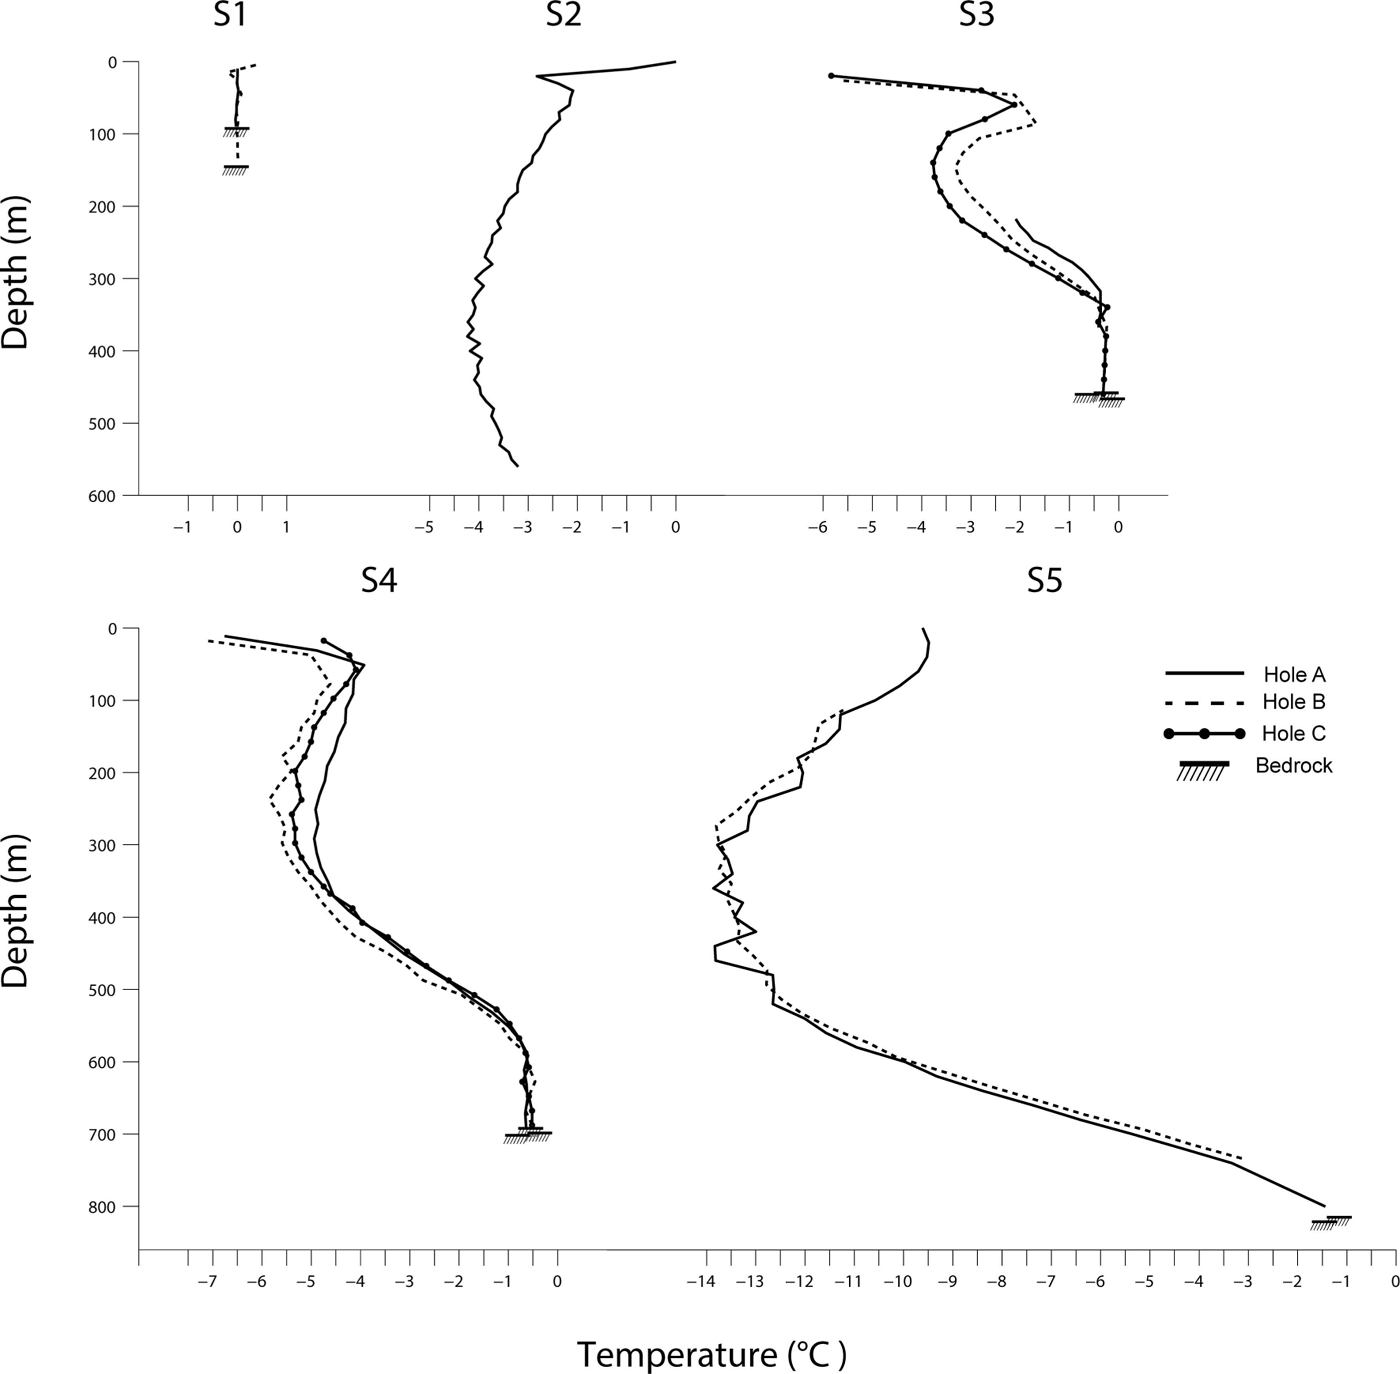
Fig. 2. Temperature profiles at each site. S2 did not reach the bed. S3 did not yield the upper half of the profile.
A basal temperate layer is observed in all profiles reaching the bed (Fig. 2). Furthest up-glacier, at S5, temperate ice thicknesses are ∼20 m. S3 profiles exhibit temperate thicknesses ∼100 m, >20% of the total ice height. At S4, 1 km north, temperate thicknesses are also ~100 m despite the dissimilarity in total ice thicknesses between S3 and S4 (S4 is >50% thicker).
A high-temperature kink is present at shallow depths in all profiles at S2, S3 and S4. Sensor spacing of 20 m restricts identifying the exact shape and temperature minimum of this feature, though it persists below the influence of the seasonal temperature wave in all profiles. This disparity is best exemplified at S2, where the seasonal temperature wave effect is evident in the upper 20 m and the kink persists at 60 m depth at –2.1°C. At S3, warm kinks are present at depths of 60 and 85 m. S4 profiles A, B and C show similar features at 51, 78 and 58 m respectively, where the depths indicate the warmest sensor locations and may not be the location of the temperature maximum due to the 20 m sensor spacing.
Closely spaced boreholes (20–35 m) at both S3 and S4 show notable temperature differences from the surface down to 100 m from the bed, where the ice becomes temperate. The exception to this is S4-A and S4-C, which contain near-identical temperatures for the lower 300 m and then diverge in temperature up to the surface. Temperature differences of >1°C are observed between S3-A and S3-C, as well as S4-A and S4-B, at large depths within the ice. These steep horizontal temperature gradients are generally not expected within ice sheets (Reference Cuffey and PatersonCuffey and Paterson, 2010).
Analysis and Discussion
Basal temperate ice
Temperate ice at the bed up to 45.5 km inland from the terminus, along with observed surface velocity variations (Reference SoleSole and others, 2013), implies that basal sliding is an active contributor to overall glacier flow in this region. The only other full-depth temperature measurements in the ablation region of the GrIS, outside of an ice stream, suggest the opposite. Basal temperatures collected along Sermeq Avannarleq show ice to be below the melting point (Reference ThomsenThomsen, 1988; Reference Thomsen, Olesen, Braithwaite and BøggildThomsen and others, 1991). Our data provide an alternative depiction of the thermal state of the bed within the ablation zone of the GrIS, and confirm the assumed thermal state in this region (Reference DoyleDoyle and others, 2014).
In addition to the basal temperate layers observed in S3, S4 and S5 profiles, we suspect a large temperate layer is also present at S2. Although the borehole was only instrumented to 577 m, subsequent airborne radar (Reference AllenAllen, 2010) has indicated that depths in this region are likely >900 m. The S2 profile shows significant warming at depth, and comparison with the shapes of the other profiles up-glacier suggests that the temperature in the ice reaches the melting temperature well above the inferred bed at >900 m.
Temperate ice thicknesses 22% (S3) and 14% (S4) of total ice height are observed in profiles 27 km from the terminus. To investigate the development of these 100 m thick temperate layers, we apply one-dimensional (1-D) thermal modeling to estimate englacial heat source contributions to ice temperature along the flowline from S5 to S3. Because data are only available at two sites in the region, we make the basic assumption that various parameters (e.g. ice velocity) vary smoothly between the two sites. Subglacial heat sources, including geothermal heat flux and heat of sliding friction, will contribute entirely to melting at the bed between study sites. This is because the temperature structure in the temperate layer cools slightly towards the bed, as a result of the Clausius–Clapeyron slope. This adverse temperature gradient prevents any basal heat sources from conducting into the ice.
To model relevant heat sources, we use the 1-D transient vertical heat equation
where Tz is the ice temperature at some depth, z, t is time, k is thermal conductivity of ice, ρ is the density of ice, c is the heat capacity and φ is the heat production from strain heating. In the first term, the cold ice above the temperate layer creates a thermal gradient that extracts heat from the top of the temperate layer.
In the second term, heat production from strain heating will regionally add heat to the ice, changing the ice temperature field. This heat production, φ, is given by
where A is the temperature-dependent creep parameter, τeff is the effective deviatoric stress, accounting for the additional longitudinal and vertical stresses, and τ xz is the shear stress (Reference HookeHooke, 1998). Measured surface slopes averaging <1° over 1 km are used for stress calculations. Strain heating from longitudinal compression and vertical extension are an order of magnitude less than the shear strain heating and thus are ignored. Creep parameter values, A, are assigned by
where A 0, the constant prefactor, is 3.5 × 10⁻²⁵ s–1 Pa–3, Q is the temperature-dependent activation energy, R is the gas constant and T * is the pressure-dependent temperature ∼–10°C (Reference Cuffey and PatersonCuffey and Paterson, 2010). This reference relationship contains large uncertainties; however, it remains the best estimate of the effect of ice temperature on deformation rates. The feedback loop between ice temperature and deformation rates necessitates the creep parameter be recalculated for each time step. Within the existing temperate layer, strain heating does not produce any temperature change, contributing only to melting of the ice. However, this model does not calculate any phase changes and solely considers the temperature change in the ice itself.
Comparing the annual change in site position from 2011 to 2012 for multiple dates between 1 August and 1 September from GPS stations emplaced at S3 and S5 yields annual surface velocities of ∼100 m a–1 and ∼117 m a–1 respectively. The ice velocity reduction from S5 to S3 prompts longitudinal compression of the ice. Under assumptions of incompressibility and negligible lateral extension/compression, all longitudinal compression must be balanced by vertical extension
where ∊′ zz is the vertical strain rate, ΔVx is the change in velocity between the upper and lower sites, and ΔX is the flow distance (∼18.6 km). This will expand the full ice thickness, including any pre-existing temperate layer. As we have no knowledge of the variation of extension rate with depth, we apply vertical extension homogeneously throughout the full ice thickness. The new ice thickness, H n, follows:
where H 0 is the initial ice thickness. This vertical stretching plays a minimal role in temperate thickness growth, where a 10 m temperate layer at S5 will grow by ∼1.5 m by the time it reaches the location of S3. Implementing measured surface ablation rates (2.5 m a–1) at S5 and S3, along with the estimated vertical stretching over the total flow distance, produces the approximate ice thickness observed at S3. We run this model for ∼171 years, corresponding to the time required for the ice to travel from S5 to S3, based on present-day flow rates. Initial conditions are set using S5 temperature data.
Model results indicate that strain heating (∼10–6 Wm–3) and stretching of the temperate layer from longitudinal compression are unable to counteract the conduction of heat into the colder ice above (∼10–4 Wm–3), removing the initial 20 m S5 temperate thickness before reaching S3. A substantial difference, then, persists between modeled temperate thickness evolution using a simplified thermomechanically coupled model and the temperature records. For this reason, unexpected heat sources must be considered. We propose that heat from the storage and refreezing of water within basal crevasses is a reasonable mechanism for this growth.
Basal crevassing requires abundant basal water, sufficiently high water pressures and a tensile longitudinal stress to balance the weight-induced lithostatic stress (Reference Van der VeenVan der Veen, 1998a). In this region of the ablation zone, numerous surface-to-bed connections have been observed and modeled (C.M. Clason and others, unpublished information), indicating efficient routing of meltwater to the bed. In situ water-pressure records in S3, S4 and S5 boreholes demonstrate high water pressures, between 82% and >100% of ice overburden with an average water pressure close to overburden (Reference Meierbachtol, Harper and HumphreyMeierbachtol and others, 2013). Finally, despite overall longitudinal compression between S5 and S3/S4, segments of extensional stresses due to the undulating bed are likely and are ideal sites for basal crevassing. Surface crevassing is observed between the upper and lower sites, indicating regions of extension.
Grounded basal crevasses have been observed within temperate Bench Glacier, Alaska, extending up to 70 m above the bed (Reference Huzurbazar and HumphreyHuzurbazar and Humphrey, 2008; Reference Harper, Bradford, Humphrey and MeierbachtolHarper and others, 2010), and inferred elsewhere (Reference Ensminger, Alley, Evenson, Lawson and LarsonEnsminger and others, 2001; Reference Woodward, Murray and McCaigWoodward and others, 2002). To create the temperature change observed in the lower 100 m from S5 to S3, purely by phase change of water, only requires on the order of 1% of the volume to be refrozen water. The storage and refreezing of meltwater creates a strong thermal gradient between the basal crevasses and the colder surrounding ice, allowing for substantial heat transfer into this ice. Simultaneously, strong deformational gradients present near the bed will deform these features as the ice flows down-glacier, increasing the extent of the ice thermally altered by the basal crevassing. This, along with strain heating and the vertical extension of this temperate layer, may allow for the temperate thicknesses observed at S3 and S4. Additionally, the similar temperate layer thickness at S3 and S4, despite the >235 m thickness disparity, is best explained by a mechanism such as basal crevassing.
Basal crevasses under the GrIS may dampen the effect of abrupt connections to the bed, such as supraglacial lake drainage. It may also act as a storage system for meltwater over winter. Intersection of these features while drilling is unlikely; however, GPR surveys and seismic analysis have proven useful for basal fracture identification (Reference Bradford, Nichols, Harper and MeierbachtolBradford and others, 2013).
Shallow temperature kinks
Steep vertical temperature gradients in the shallow, high-temperature kinks present in S2, S3 and S4 profiles, ranging from 51 to 85 m depths, suggest that these features are temporally recent and rapidly diffusing. The kinks persist below depths affected by the seasonal temperature wave (Reference Cuffey and PatersonCuffey and Paterson, 2010), and strain heating in the upper half of ice sheets is negligible. We suggest that these features are remnants of the thermal influence from partially water-filled surface crevasses up-glacier.
A similar shallow anomalous warm layer between 30 and 50 m depth was observed on Steele Glacier, Canada (Reference Jarvis and ClarkeJarvis and Clarke, 1974). Infilling and refreezing of meltwater within deep crevasses initiated during a 1966 surge of Steele Glacier were identified as the source of this high-temperature kink. Meltwater within a crevasse facilitates further propagation of the crevasse towards the bed (Reference Van der VeenVan der Veen, 1998b) while simultaneously providing heat to the surrounding ice (Reference Boon and SharpBoon and Sharp, 2003). East–west directional flow (Reference Joughin, Smith, Howat, Scambos and MoonJoughin and others, 2010; Reference Jezek, Wu, Paden and LeuschenJezek, 2013) and ice velocity measurements (100 m a–1) suggest S3 occupied a southwest–northeast-trending crevasse field for ∼20 years and has since been removed for ∼20 years. S4 occupied the same crevasse field for ∼11 years and has been removed ∼29 years. Lack of high-resolution surface imagery and necessary site data inhibits investigation of the S2 temperature kink.
Here we use a 1-D, transient vertical heat conduction model to simulate S3 and S4 borehole occupation of the crevasse field and post-crevasse field. This first-order approach is used because numerous uncertainties (e.g. the presence and number of surface-to-bed connections through moulins/crevasses) pose a problem with poorly defined initial boundary conditions; we are most concerned with whether water-filled crevasses can create temperature kinks similar to those observed, not the exact conditions under which this occurred. To simulate an initial temperature profile, we re-scale and shift an S5 profile, which is devoid of this shallow thermal kink. Crevasse depths (20–120 m) are assigned, under the assumption that crevasses are able to penetrate to great depths when water-inundated (Reference Van der VeenVan der Veen, 1998b, Reference Van der Veen2007), and set to the pressure-melting point temperature while in the crevasse field. Measured and modeled ablation rates in this region of the western GrIS highlight the vast amount of available meltwater at the surface (Reference Van As, Hubbard, Hasholt, Mikkelsen, Van den Broeke and FaustoVan As and others, 2012). Once the ice exits the crevasse field, the pressure-melting point boundary is removed. A seasonal temperature wave surface boundary condition is then implemented as a sinusoidally varying average surface temperature of –10°C with 10° amplitude (Reference HarperHarper and others, 2012). A total of 2.5 m of ice ablates at the end of each melt season.
Model results for sites S3 and S4 exhibit shallow temperature kinks similar to those observed. Figure 3 depicts the S3-C profile against the modeled final temperature from a crevasse depth of 80 m. Crevasse depths that best fit our model to the profiles may not be indicative of true depths because of the potential thermal influence of more recent surface-to-bed connections, which warm the full depth profile. However, thermal effects from water-filled crevasses are the most probable source for these anomalous features. This is best exemplified by profiles S4-A and S4-C, where temperatures are nearly identical for the lower 300 m but then deviate, with higher temperatures for S4-A persisting to near the surface. This distinct shallow temperature difference between the S4-A temperature profile and the S4-C, located 34 m adjacent, suggests a stronger thermal source from the up-glacier crevasse field, which has since conducted down through the ice.
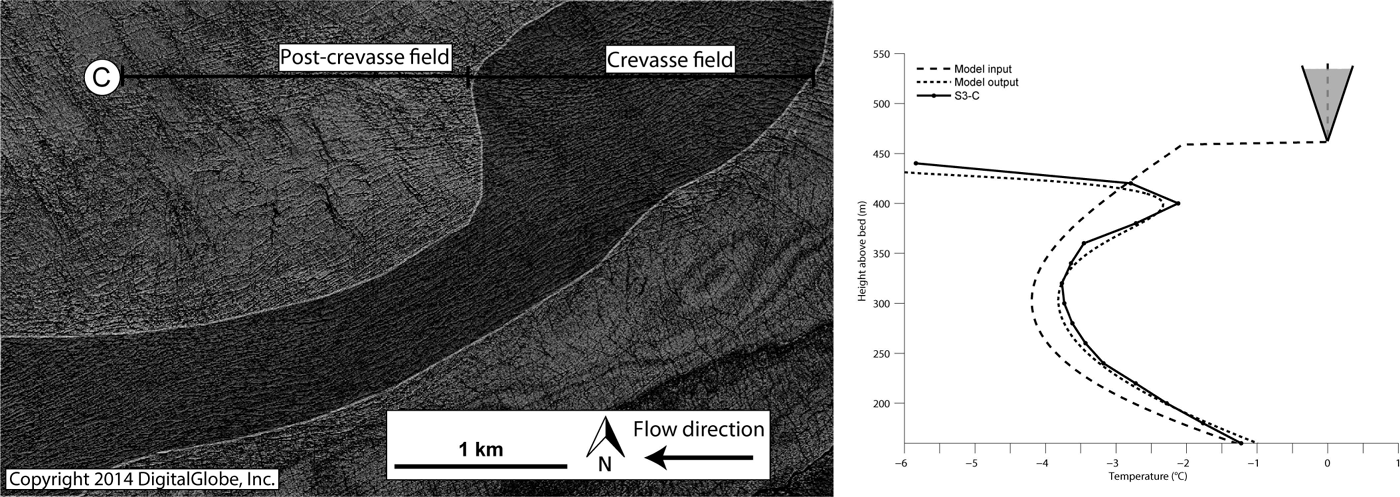
Fig. 3. Left: Crevasse field is shaded with white outline. Location of S3-C is a circled C. Right: Initial model profile (rescaled S5) with 80 m crevasse depth, model output and S3-C profile.
Closely spaced temperature profile offsets
Full-depth temperature offsets, aside from the basal temperate layer, within closely grouped boreholes (20–35 m) at S3 and S4 demonstrate steep horizontal thermal gradients present within the ice (Fig. 2). Englacial temperature differences >1°C from profiles <30 m apart suggest the heat source must be a recent thermal feature. Simple thermal models show that the presence and refreezing of meltwater within one or multiple moulins is capable of creating this offset. Water pressures near ice overburden (Reference Meierbachtol, Harper and HumphreyMeierbachtol and others, 2013) allow the moulin to close by inward freezing, radially releasing latent heat into the surrounding ice. Assuming vertically oriented moulins (Reference Catania, Neumann and PriceCatania and others, 2008), this process will locally affect ice temperatures at all depths. Active moulins, up to 3 m in diameter, have been mapped within this region. Data are insufficient to isolate the exact parameters of the scenario; however, moulins remain the only vertically uniform heat source able to provide observed full-depth temperature offset.
Conclusions
We see the thermal influence of meltwater manifest itself in three ways within our temperature profiles. Basal crevassing enables thick temperate layers of ice near the bed, softening the ice and potentially increasing deformation rates. Shallow temperature kinks were caused by heat released from meltwater within crevasses up-glacier. Temperature offsets between closely spaced boreholes are thermal remnants of both nearby moulin occupation and these meltwater-filled crevasses. Though the exact conditions under which these scenarios occurred remain uncertain, the ability of meltwater to rapidly alter ice temperatures at all depths within the ablation zone of the GrIS is evident. Rising GrIS melt rates (Reference MoteMote, 2007; Reference Fettweis, Mabille, Erpicum, Nicolay and Van den BroekeFettweis and others, 2011), along with a rising equilibrium-line altitude (Reference Howat, De la Peña, Van Angelen, Lenaerts and Van den BroekeHowat and others, 2013), increase the amount and spatial extent of meltwater available for supraglacial, englacial and subglacial heating. Additionally, increased crevasse extents as the ice sheet thins could increase the extent to which englacial warming from meltwater occurs (Reference ColganColgan and others, 2011). Rapid discharge accelerations observed at Jakobshavn Isbræ caused by thermal weakening of the ice in the lateral shear margins from meltwater warming (Reference Van der Veen, Plummer and StearnsVan der Veen and others, 2011) represent one of numerous potential effects on flow dynamics from this heat source. Particularly important aspects of this temperature profile analysis are the indication of the importance of surface crevassing in creating a temperature structure in the upper ice, and the strong implication that basal crevasses may be an under-appreciated part of the basal and englacial hydrologic system in the ablation region of the GrIS. Further ground-based measurements of englacial temperatures will elucidate both the significant heat sources within the ablation zone of the GrIS, as well as the thermal state of the ice.
Acknowledgements
This study is supported by SKB-Posiva-NWMO through the Greenland Analogue Project and the US National Science Foundation (Office of Polar Programs – Arctic Natural Sciences grant No. 0909495 and 0909122).


