Introduction
The state of equilibrium of the ice-cliffed glaciers of the Dry-Valleys area of McMurdo Sound, Antarctica, has heen a subject of speculation since they were first seen and photographed by Griffith Galore in 1910-11 (Reference TaylorTaylor, 1922) on Scott's last expedition. Most observers have compared their activity with that of the far more dynamic temperate glaciers oflowcr latitudes. The absence of any obvious movement by flow or of fluctuations of the frontal positions has led the glaciers to be described summarily as “stagnant” or static “remnants” (Reference Gunn and WarrenGunn and Warren, 1962; Reference DortDort, 1970).
The earliest known attempt to assess the equilibrium of the glaciers was made during the 1957-58 summer when Reference PéwéPéwé (1958) repeated ten photographs (and one drawing) of glaciers taken in 1910-11 (Taylor, 1922) at the same positions from which the earlier photographs were taken. Comparison of the photographs “showed no appreciable fluctuation of glacier margins” over the 47 year interval (Péwé, 1958; Reference Péwé and ChurchPéwé and Church, 1962). Péwé concluded that the glaciers were close to equilibrium.
After examining the glaciers and their nearby moraines, Dort (1970) declared that retreat was the last major event. Because of their apparent ly excessive areas of bare ice, Dort felt that the Dry Valleys glaciers had negative balances. He concluded that most, if not all, of the glaciers were “stagnant” or nearly so at the present.
Regimen OF Polar Glaciers
The margins of the Dry Valleys glaciers show a continuum from low-angled ramps, through gibbous-shaped to calving ice cliffs (Chinn, 1985,1991), and the margin processes of expansion (Chinn, 1989) and ablation (Chinn, 1987) hav e been described. All margin forms normally have an apron of ice talus or accumulated snow and regelation ice. Mass-balance studies of Meserve Glacier (Reference Bull and CarneinBull and Carnein, 1970) and of three other glaciers in the Asgaard Range (Chinn, 19801 show that balance changes on these glaciers are very small, and annual balances are close to zero, so the glaciers are generally in equilibrium with the present climate.
The Dry Valleys glaciers are typical polar or dry-based glaciers, with ice movement 1-2 orders of magnitude slower than comparable temperate glaciers. The large, deep valley glaciers exhibit the fastest flows, with movement rates for the Taylor Glacier of up to 14 m a−1 at a narrow section of the trunk, and 2-4.8 m a−1 near the snout (Reference RobinsonRobinson, 1984). The fastest movement on the steep trunk of Meserve Glacier reaches 3 ma−1 at the centre, slowing to 1 ma−1 at the margins (Bull and Carnein, 1970), while Heimdall Glacier has a mean velocity of 1.0 m a−1 across the centre. The small cirque glaciers have the lowest activ ity, with movements of only 0.1-0.5 ma−1 measured on Jeremy Sykes and Albericht Glaciers (Chinn 1981,1985).
To maintain equilibrium of margin position, glacier movement must be matched by ablation loss. Mean ablation losses decrease substantially with altitude, from approximately 200 mm a−1 at 500 m elevation to 50 mm a−1 at 1500 m (Chinn, 1981). These rates are considerably less than the 15 000 mm a−1 lost from the tongue of the comparable temperate Ivory Glacier in New Zealand (Anderton and Chinn, 1973). Loss rates (predominantly by sublimation) vary with aspect, and increase with exposure to wind and solar radiation. Ablation on the vertical ice cliffs is 3- 7 times that of the upper glacier surface (Chinn, 1987).
Margin equilibrium is maintained by flow and ablation, so glaciers can neither advance at greater than their flow rate nor recede at greater than the ablation rale. At the margins of the polar glaciers of the Dry Valleys, both of these rates are of the order of 1 m a−1 , SO the maximum advance or recession rates are around ±1 m a−1. Larger recorded fluctuations cither mark extreme cases of advance or recession, or result from observation errors. Changes of 1 ma−1 are almost undetectable in comparative photographs taken al distances of 0.5 km or more from the glacier. Even when analyzing cumulative changes over a 47 year period, Péwé (1958) found “no detectable changes”, lb assess fluctuations of these glaciers, one must use methods which can detect changes of as little as 0.1 m.
At a glacier margin in equilibrium, ice flow equals ablation losses, allowing ice-flow rates to be estimated from knowledge of ablation rates. The more actively calving ice cliffs give a visual impression that the glacier is advancing. Calving, however, is related to the balance between flow and ablation, and not to the equilibrium of the frontal position. Where ice flow exceeds sublimation and melt losses on a vertical ice face, dry calving occurs, and the surplus ice is lost to accelerated ablation oftlie ice talus on the darker surrounding rocks at the foot of the cliff. This may occur on either advancing or receding glaciers.
Past Observations
The earliest reliable measurements of glacier margin fluctuations were made at Meserve Glacier by Reference McSaveneyMcSaveney (1973, Reference McSaveney1974), who measured a retreat at Mcscrvc Hut (opposite the mid-right of the trunk) of 3.12 m during the period January 1966-January 1974. He also noted that “where ice motion is about a meter each year, a rate of retreat of 0.4 ma−1 is of major significance — averaged, ablation exceeds flow by 150%". An equivalent annual recession of the New Zealand Ivory Glacier, where the terminus flow rate is some 8 m a−1 , would be near 12 m a−1 (Anderton and Chinn 1973).

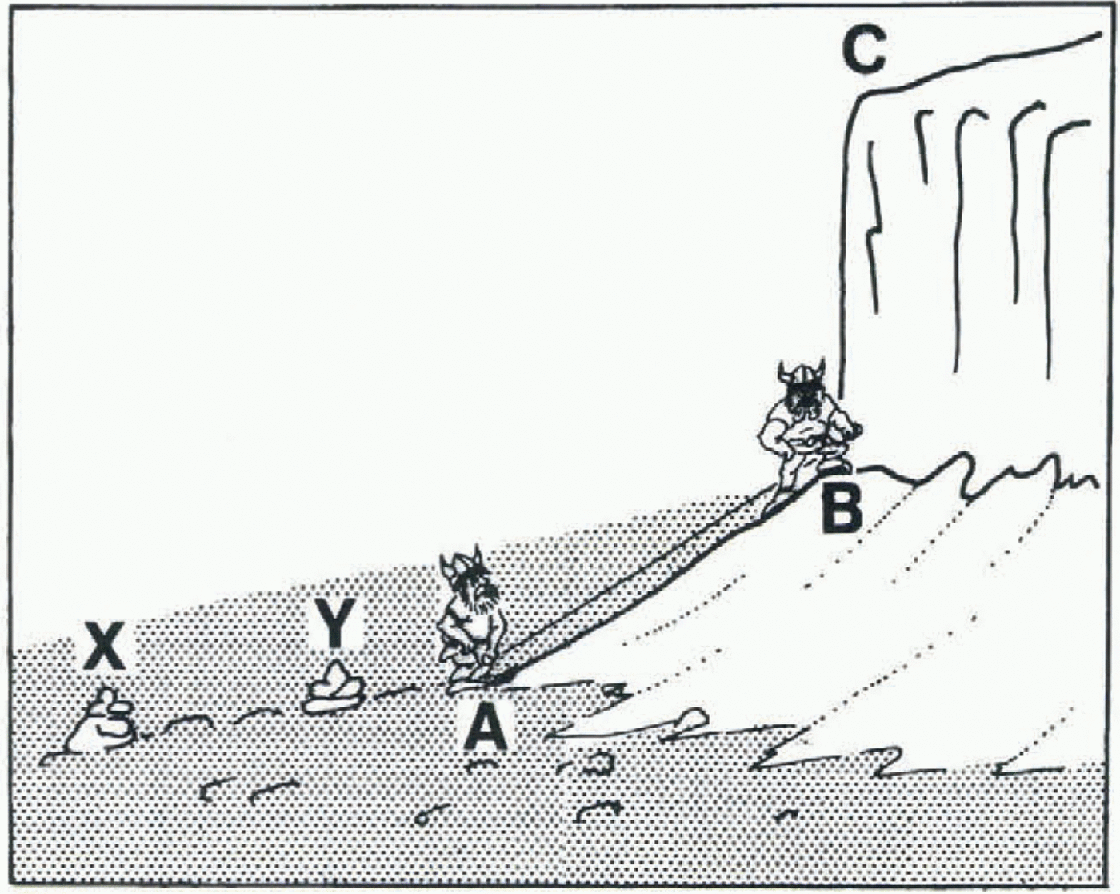
Fig. 1. Measurements taken at the ice-cliff margins. X, γ, cairns; A, lower edge of apron: B, apron-top-cliff-face junction; C, cliff top.
Miagakov (1976) made repeated photo-theodolite surveys at a number of glaciers over the 5 year interval 1970-71 to 1975-76; plots of the results showed movement, but found “no significant changes to the positions of the low-anglcd margins”, i.e. any changes were less than 0.5-1 m. Miagakov also noted that Meserve Glacier at the hut had probably undergone a 1-3 m retreat.
A separate attempt to assess the equilibrium of glaciers by using photo-theodolite methods was begun in 1972, and over the next few years up to 14 glaciers were photographed (Chinn and Gumming, 1983; Chinn, 1985). The observations were repeated after 5-7 years, when the results demonstrated that, unless an accurate plotter was used, the method was not precise enough to make other than subjective estimates of changes. However, from analyses of prints of overlain negatives, it was concluded that of 14 glaciers analyzed. 7 were advancing, 3 were receding and 4 were stationary or had an undefined change.
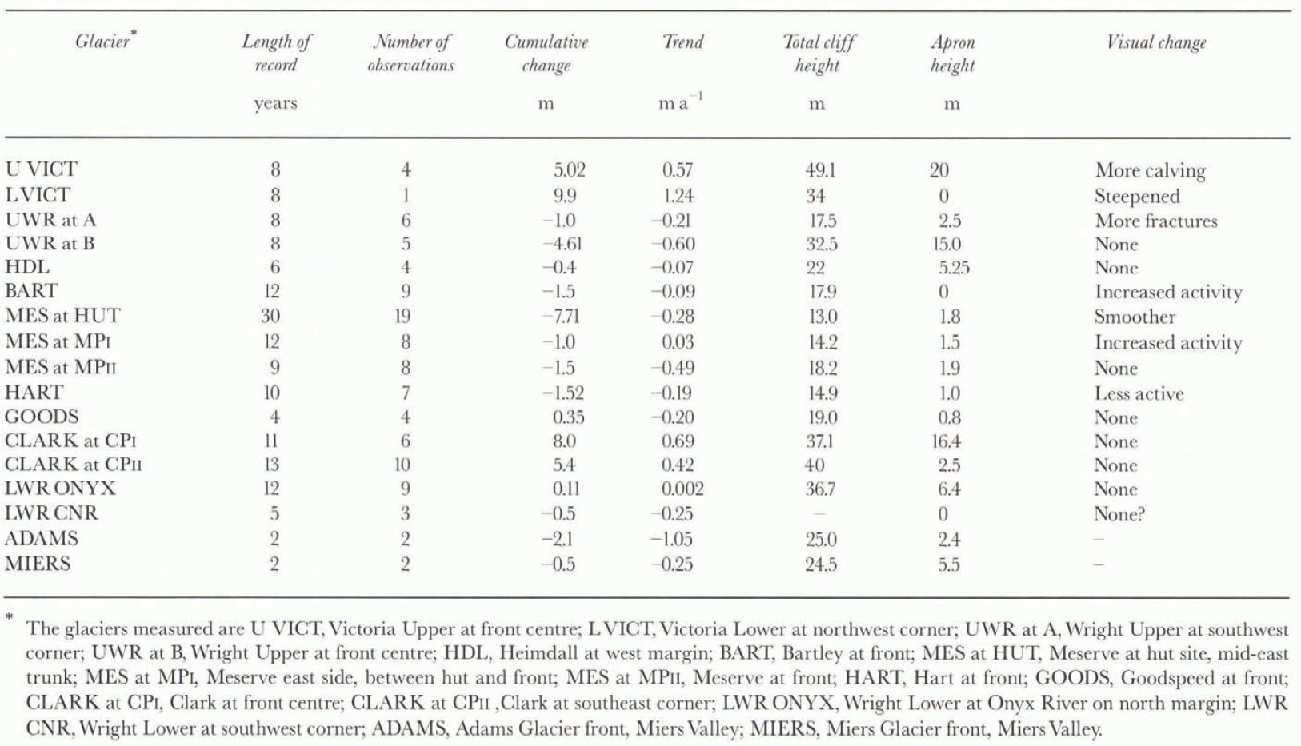
Table 1. Changes in position of margins of Dry Valleys glaciers


Fig. 2. Measured fluctuations at individual glaciers, (a) Victoria Upper Glacier at front; (b) Victoria Lower Glacier at northwest corner; (c) Wright Upper Glacier at A, southeast corner; (d) Wright Upper Glacier at B, centre.
Ice-cliff heights were analyzed by Chinn and Gumming (1983). Chinn (1991) noted that advancing glaciers tend to have higher cliffs with a greater proportion occupied by the apron: “advancing glaciers are characterised by a cliff height of over 20 m and an apron that occupies 20% or more ofthat height; receding glaciers have lower cliff heights with less than 20% occupied by the apron".
Method
1. Glacier front positions
The inability of photo-theodolite observations to provide values for glacier terminus fluctuations prompted a change to simple measurement from fixed points. Mosi of the following glacier observations were made on an opportunistic basis while other work was being undertaken nearby, necessitating a simple concise method to ensure the points were readily relocatable and measurements repcalable by various observers.
Only cliffed glaciers were included in the programme. Two cairns were built, aligned normal to the front of each glacier, and three simple taped distances, measured along the ground surface to reduce sag errors, were measured at each site (Fig. 1), viz. (1) the distance between the cairns X and Y (to verify that the correct markers have been used); (2) the distance from the proximal cairn to the apron edge, Y to A; and (3: the slope distance up the apron to the cliff face, A to B.
10 locale the sile and to record changes at the ice cliff, a photograph was taken from the disiai cairn along the line of measurement on each visit. Where possible, a person holding a survey staff againsi the cliff was included in the pic-lure, to enable cliff height to be estimated.
Taking slope distances introduces little error because the vital factor is the change in the glacier posilion, found under uniformly repeated measurements, rallier than the absolute distance from the cairn to the ice front. Despite the simplicity of the procedure, a number of measurement errors have occurred.
An obvious source of error is the irregularity of the cliff face where, for example, a single small icefall at the point of measurement might be interpreted as a significant recession. This problem might be eliminated by taking the mean of a number of measurements to différent points along the glacier margin, but it would then be difficult to ensure that all repeal measurements were made along the same bearings. This error is effectively eliminated by continuing the programme Over a sufficient number of years to give mean changes averaged over time.
2. Cliff height measurements
Direct measurement of the height of the 20-30 m Itigli cliffs is not generally feasible, because access to the upper surfaces of these glaciers is difficult. Instead, cliff heights were computed from vertical angles measured by a hand-held Abney level from cairns, X and Y, to the three points A, Β and C of the glacier (Fig. 1), The total cliff height may then be calculated by trigonometry. in practice, the steep slope for X-Y and the backward inclination of B-C combined to give very small measured angles at many cliffs. When measured with a precision of ±0.5°, many of the solutions were found to be unreliable. Cliff height was also scaled from photographs which included a person holding a 5 m staff against the cliff face. Generally, an average of the values from both methods has been used in this study. The overall accuracy of cliff-height measurements is estimated to be ± 2 m, so the measurements do not have the precision required to detect any trend in cliff height.

Fig. 3. Measured fluctuations at individual glaciers, (a) Heimdall Glacierat side; (b) Bartley Glacier at front; (c) Meserve Glacier at MP1, east side; (d) Meserve Glacier at MP11, front; (e) Hart Glacier at front; (f) Goodspeed G lacier at front; (g) Clark Glacier at CP1, front; (h) Clark Glacier at CP11, southeast corner; (i) Wright Lower Glacier at Onyx River, north margin; (j) Wright Lower Glacier at southwest corner; (k) Adams Glacier at front; (l) Miers Glacier at front.
3. Cliff-morphology changes
Repeat photographs of cliff fronts show only minor changes in cliff form over time. Seasonal changes, as summer melt progresses, are more apparent than annual changes. At a few sites, additional cairns have been built to mark sites for repeat photos across the glacier snout to assess shape changes.
4. Results
Results of the measured changes in position of the margins of Dry Valleys glaciers are listed in Table 1.
a. Changes at individual glaciers
Measured changes on 12 glaciers since the 1982-83 summer (Figs 2-4) show that the glaciers are not stationary. Some are advancing at speeds close to their flow rates, while others are retreating at a significant fraction of maximum ablation rates. Most, however, have remained close to equilibrium.

Fig. 4. Fluctuations of Meserve Glacier at hut {MES at HUT).

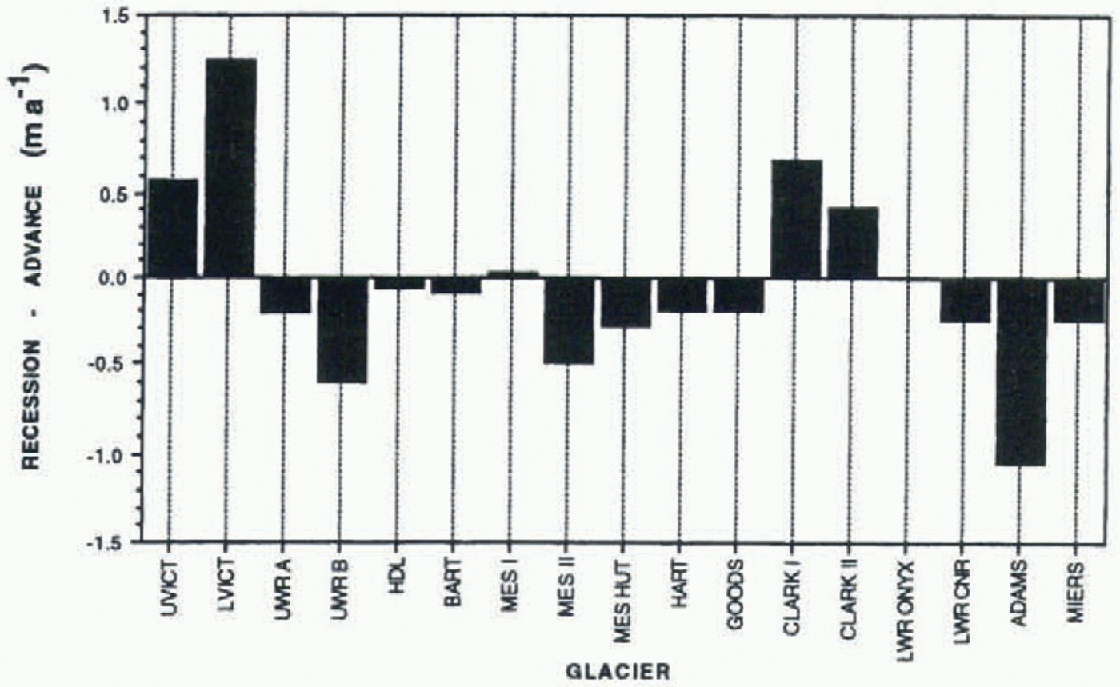
Fig. 5. Mean fluctuation trends of glacier margin positions for allyears recorded.
The long record from Meserve Glacier, taken along two lines at Meserve Hut (Fig. 4) commenced in 1965-66 (McSaveney 1974), shows the value of annual monitoring over long periods. Ice flux can change only slowly with mass-balance changes accumulated over hundreds of years, and any variations will be undetectable over the period of this study. Here a clear long-term recessional trend has superimposed short-term variations from annual variations in ablation including calving events.
b. Mean fluctuation trends
The mean trends of Figure 5 are from a linear fit to the cumulative data records for each glacier. Recession is the dominant trend, with the range of variations lying within ±1 m a−1. The occurrence of both retreating and advancing glaciers over the period of study is similar to that found by Frczzotti (1997) for the floating glacier tongues along the nearby Victoria Land coast. in contrast to the dominance of retreat found in this study, Frezzotti found advance to be the dominant trend over the period 1973-91 for floating glaciers.

Fig. 6. Percentage of the total of measured glaciers advancing, receding and stationary eachyear. 1993 data for 2 year period; 1996 data for 3 year period.
C. Interannual changes
The proportions of glaciers advancing and receding each year show annual variations (Fig. 6). Mean flow rates of 1-3 m a−1 (Bull and Carnein 1970; Chinn, 1985) indicate that the response times of the glacier fronts to mass-balance changes are of the order of hundreds to even thousands of years, so annual fluctuations must reflect changes in loss rates, i.e. interannular variations in ablation. The austral summers ending 1984-85 and 1988-89 exhibited high ablation (Fig. 6), with most glaciers receding, while a higher proportion of the glaciers were advancing during 1986-87 and the 1990s. These annual fluctuations might be expected to correlate with the level fluctuations of the enclosed lakes of the Dry Valleys, which are extremely sensitive to summer climates (Chinn, 1993). No correlation was found between the glacier fluctuations and lake-level changes over the period of the study.
Correlations
Chinn and Cumming (1983) concluded that advancing glaciers have higher cliffs and more extensive aprons than those in stationary or receding states. A reinvestigation of the relationship between cliff height and margin equilibrium as a ready indicator of glacier equilibrium was made, and for this analysis a number of glaciers were removed from the dataset. The Victoria Lower (LVICT), Clark at southeast corner (CLARK II) and Wright Lower Glaciers (LWR CNR) were removed because they have very high cliffs with little to no apron, presumably caused by curved flow where ice flows round a bend. Wright Upper Glacier centre (UWR B) spills its apron over an escarpment, giving a false value for apron height, and Adams and Miers Glaciers have too short a record to give reliable trends.
The data show a relationship between cliff height and glacier frontal equilibrium, where advancing glaciers have higher than average cliffs. The relationships between dimensions of the glacier front and state of equilibrium were investigated to see whether cliff parameters might provide a ready assessment of glacier equilibrium noted by Chinn and Gumming (1983). The apron height was seen to increase with total cliff height with a reasonably good correlation (r2 = 0.850).
This is to be expected as an advancing glacier must override ils apron to move forward (Reference HudlestonHudleston 1976), and a receding glacier will retreat behind any overridden ice and snow.

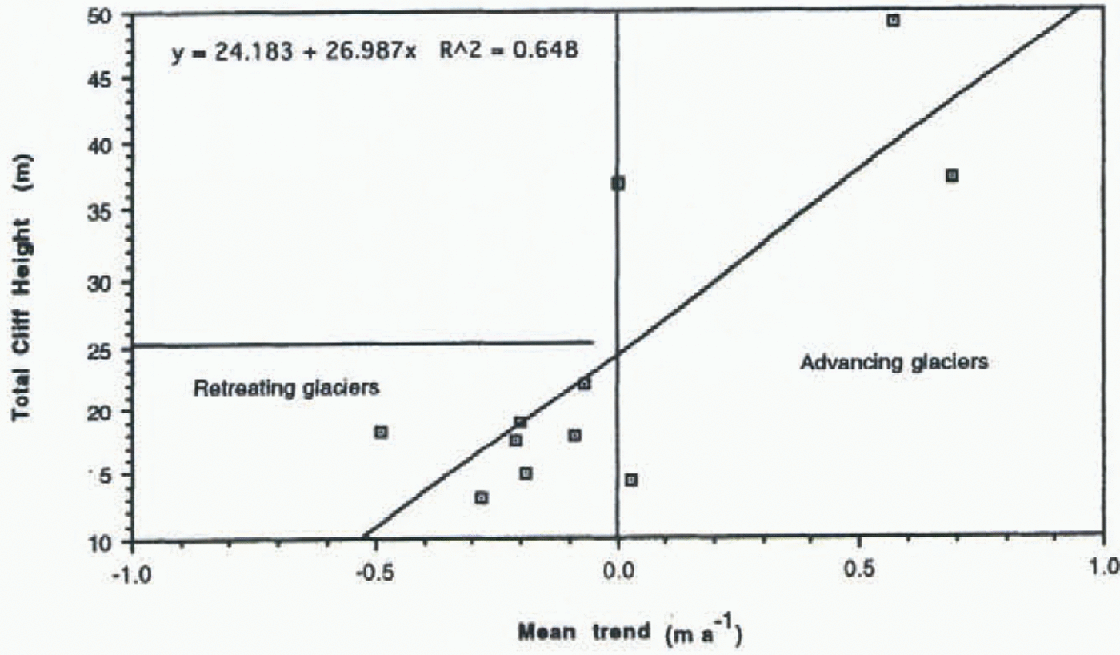
Fig. 7. Relationship between mean annual fluctuations and total cliff height.
Correlations of cliff geometry with mean change trends of frontal position of each glacier show that apron height is the most significant dimension for indicating equilibrium (r2 = 0.806) (Fig. 7). Correlations of total cliff height with annual changes was marginally less sig nificant (r = 0.648).
No attempt has been made here to correlate the frontal trends with glacier size, gradient and other measurements of glacier geometry, although relationships no doubt exist. These parameters contribute to the response times and sensitivity of glaciers to climate. Examination of this is a complex undertaking (Reference Jóhannesson, Raymond and WaddingtonJóhannesson and others, 1989) constituting a separate study.
Figure 7 also demonstrates that, as a rule of thumb, glaciers with cliffs below 25 m are most likely to be receding, and those cliffs over 30 m in height (including apron) occur on glaciers that are advancing.
Conclusion
Measurements of the frontal positions of glaciers in the Dry Valleys show that they are neither static nor “stagnant” as frequently reported, but, in proportion to their flow and ablation regimes, are fluctuating as dynamically as do temperate glaciers. Movement rates of the polar glaciers are two orders of magnitude slower than those of temperate glaciers, and so are the changes. Both advances and recessions occur at significant rates of up to 50% of estimated ice velocities.
Heights of ice cliffs enable a ready and useful estimation of equilibrium, with advancing glaciers having the highest cliffs and receding glaciers the lowest cliffs with proportionally small aprons. The separation between advancing and receding glaciers is at a cliff height of 25 m.


