


1. Introduction
The rupture of layers of faceted crystals or depth hoar that have low shear strength is one of the causes of dry slab avalanche release. Thus, evaluation of the shear strength of faceted crystals is important for estimating slope instability.
The numerical snowpack model SNOWPACK is useful for such evaluation. SNOWPACK simulates vertical profiles of snow temperature, density and grain type using meteorological input data (Reference Lehning, Bartelt, Brown, Fierz and SatyawaliLehning and others, 2002; Reference Lehning and FierzLehning and Fierz, 2008) and estimates the stability index by dividing shear strength by shear stress (Reference Lehning, Fierz, Brown and JamiesonLehning and others, 2004). Shear strength is estimated in the model as a function of snow density and grain type, using expressions from Reference Jamieson and JohnstonJamieson and Johnston (2001). However, the equations of Reference Jamieson and JohnstonJamieson and Johnston (2001) focus on weak layers and are not appropriate for estimating the strength of a slab with a high shear strength. Reference Hirashima, Nishimura, Yamaguchi, Sato and LehningHirashima and others (2008) introduced an empirical relationship for the shear strength of dense, rounded grains, as measured by Reference Yamanoi and EndoYamanoi and Endo (2002). Using this calculation, the shear strength of rounded grains is three to seven times higher than that of depth hoar with the same density. In the SNOWPACK model, when the sphericity exceeds the threshold value for a particular grain type, the equation for shear strength is altered, causing a discontinuous change in the stability index. To eliminate this discontinuity, parameterization of shear strength during the development of faceted grains or depth hoar was implemented using the dry snow metamorphism factor (DSM factor) of Reference Hirashima, Abe, Sato and LehningHirashima and others (2009). The DSM factor is related to the shear strength of snow layers undergoing kinetic growth metamorphism. It increases as shear strength decreases with the formation of facets when temperature gradients are high. Conversely, it decreases as snow strengthens under equi-temperature conditions. The increase in the DSM factor during high temperature gradient conditions was obtained based on laboratory experiments using various temperature gradients and snow density conditions, and was parameterized as a function of estimated water vapor flux and snow density. The SNOW-PACK model with the DSM factor reproduced the shear strength of developing faceted crystals both in the experiment and the field. However, the decrease in the DSM factor with equi-temperature metamorphism was based not on measurements, but on an equation that addresses sphericity increase (Reference Lehning, Bartelt, Brown, Fierz and SatyawaliLehning and others, 2002). This equation was not supported by theoretical considerations or observational data and should be improved.
An increase in the shear strength of faceted crystals during equi-temperature conditions is important in estimating slope stability after faceted crystals have been buried under new snowfall. The low shear strength of depth hoar is generally considered to persist for a long time (Reference McClung and SchaererMcClung and Schaerer, 2006). However, despite its importance for estimating slope stability, the increase in the shear strength of faceted crystals under equi-temperature conditions has not been studied.
In this study, temporal variation in the shear strength of faceted crystals under equi-temperature conditions was measured experimentally in the laboratory. The measured data were parameterized as the decrease in the DSM factor during equi-temperature metamorphism. The DSM factor was then incorporated into the numerical snowpack model SNOWPACK, and simulated shear strengths were compared with the observed results.
2. Instrumentation and Experimental Procedures
The experiment to produce and measure the shear strength of artificial faceted crystals was conducted in the Cryospheric Environmental Simulator (CES; Reference Higashiura, Izumi, Nakamura and R.L.Higashiura and others, 1997), using the same instruments used by Reference Hirashima, Abe, Sato and LehningHirashima and others (2009). In the CES, dendritic artificial snow was made using a device on the ceiling of the simulator, which cooled water vapour produced by an evaporator with a heater and blower to produce snow. The artificial snow dropped and accumulated on the table (Fig. 1). The dendritic snow crystals were not hexagonal but linearly branching (Fig. 2a). The apparatus used to produce the faceted crystals is shown in Figure 1.

Fig. 1. Schematic drawing of the experimental set-up. The switch of the electric plane heater was off when the temperature gradient was released, and subsequently aluminium plates, wood plates and snow were moved to the cold room in which the air temperature was –5˚C and –10˚C. (a) Cross-sectional view. (b) Plan view.

Fig. 2. Photomicrographs of snow crystals during the experiment. (a) Dendritic crystals used for the experimental snow layer. (b) Faceted crystals sampled when the temperature gradient was released. (c, d) Rounded grains that developed from faceted crystals under equitemperature conditions of –5˚C (c) and –10˚C (d), respectively.
The experimental procedures were as follows:
-
1. Set insulators with thickness of 100mm on a table (3×5m)
-
2. Set electric plane heaters with a power of 100Wm–2 maximum on the insulators.
-
3. Set aluminium plates on the electric heaters.
-
4. Set wood plates on the aluminium plates.
-
5. Set a bed of snow 4cm thick on the wood plates.
-
6. Form a snow layer (dendritic crystals) 38 cm thick on the bed of snow.
-
7. Deposit a 13 cm thick layer of snow (rounded grains) on top of the 38 cm dendritic crystal layer to accelerate sintering of the dendritic crystals by loading.
-
8. Control air temperature and snow temperature at the base.
Artificial snow with dendritic crystals (Fig. 2a) and rounded grains was used to start the experiment. Dendritic crystals were used to form faceted crystals. Rounded grains were used for the basal snow bed, and the upper snow layer used for loading. The particle size ranged from 0.1 to 0.2 mm for rounded grains and from 1 to 2 mm for dendritic crystals.
The snow bed provided a source of water vapour and acted as a robust base upon which to measure shear strength. Without such a snow bed, shearing took place in a weak depth hoar at the boundary between the snow and the wood plates, but, with it, there was no such shearing. The load-producing snow layer on top of the dendritic snow layer was included to consolidate the snow layers. Without such load-producing snow, the experimental snow layer metamorphosed into unnaturally coarse, faceted crystals in which shear strength was difficult to measure. A thermistor sensor was placed on the snow surface, and an insulator was set along one of the sides. Shear strength was measured on sides without insulators, 50 cm from the edge of the surrounding, insulating snow (Fig. 1b).
The experiment started on 27 April 2009. The air temperature in the cold room was kept at –15˚C. The heater control maintained the boundary temperature between wood plate and snow bed near 0˚C. The temperature at the boundary between snow bed and wood plate during the period of kinetic growth was –0.82±0.38˚C. The snow was exposed to a high temperature gradient that ranged from 54˚C to 64˚Cm–1 for 8.8 days. Faceted crystals developed in this period (Fig. 2b).
Next, the temperature gradient was decreased. The snow was divided into two blocks (each 2 m×1m in area) and transferred on their aluminium plates to low-temperature rooms at –5˚C and –10˚C. Each block was covered by a blue sheet to preclude sublimation from the snow surface. The snow temperature was –5.09±0.15˚C in the –5˚C room and –9.90±0.08˚C in the –10˚C room. These conditions were maintained for 55 days. During this period, faceted crystals metamorphosed to rounded grains (Fig. 2c and d). When the snow was released from the high temperature gradient, the thickness of the snow layer was 9 cm (not including upper rounded grains). The shear strength was occasionally measured during the equi-temperature metamorphism, and photomicrographs were recorded at the same time (Fig. 2). Shear strength was measured using a 250cm2 shear frame (Reference SommerfeldSommerfeld, 1984; Reference Jamieson and JohnstonJamieson and Johnston, 2001). The shear frame test was performed six times for each measurement. Maximum and minimum values were excluded, and the remaining values were averaged. Measurement of shear strength and density required excavation of a snow pit wall and identification of the layer of faceted crystals (which had been dendritic crystals under the initial conditions). Shear strength was measured at two heights in this layer (5 and 10cm above the boundary between snow bed and wood plates). Snow density was measured on volumes of 100 cm3. The shear strengths were measured at the beginning of the experiment and when the temperature gradient was released. They were also subsequently measured three and four times during equi-temperature conditions of –5˚C and –10˚C, respectively.
3. Experimental Results
Temporal variations in the shear strength of faceted crystals are shown in Figure 3. The solid line shows the shear strength measured at the lower point in the layer and the dashed line denotes that at the upper point. The elapsed time was set to zero when the temperature gradient was removed. A negative value of elapsed time refers to the period when snow was exposed to a high temperature gradient. Even under high temperature gradient conditions, shear strength increased due to an increase in snow density; snow density increased from 117 kgm–3 to 277 kgm–3 at the upper point and from 165 kgm–3 to 272 kgm–3 at the lower point in the period from the first measurement (30 April) to the time when temperature gradient was reduced (7 May). This consolidation was caused by overburden snow. Two days were required for the snow temperature to become homogeneous after the release of the temperature gradient. In the interval of equi-temperature conditions, the increase in snow density was small, but the increase in shear strength was large (Fig. 3). During this time, faceted crystals metamorphosed to rounded grains (Fig. 2).

Fig. 3. Temporal variation in shear strength during the experiment. Negative values of elapsed time refer to the time interval during which snow was exposed to a high temperature gradient. Δ: high temperature gradient conditions; ∘: equi-temperature conditions at –5˚C; •: equi-temperature conditions at –10˚C. The solid and dashed lines connect the values measured at the lower point and upper point, respectively.
Changes in the relationships between snow density and shear strength are shown in Figure 4. The black and grey curves in Figure 4 are the calculated shear strength for rounded grains, S RG (Pa) (Reference Yamanoi and EndoYamanoi and Endo, 2002), and depth hoar, S DH (Pa) (Reference Abe, Mochizuki, Hirashima and SatoAbe and others, 2007), respectively, given as

Fig. 4. Relationship between snow density and shear strength during the experiment. Δ: high temperature gradient conditions; ∘: equi-temperature conditions at –5˚C; •: equi-temperature conditions at –10˚C. The solid and dashed lines connect the values measured at the lower point and upper point, respectively. The black and grey curves are the calculated values for shear strength using Equations (1) and (2), respectively. Arrows denote the directions of change during equi-temperature metamorphism.
where ρ is the snow density (kgm–3). During the transition between rounded and faceted crystals, the measured shear strength fell between the values predicted by Equations (1) and (2) for a given snow density. To determine whether
Equation (1) or Equation (2) better expressed the empirical relationships for documented shear strength, Reference Hirashima, Abe, Sato and LehningHirashima and others (2009) established the DSM factor, C:
where S (Pa) is the measured shear strength. In these results, the shear strength approaches the estimation curve of Equation (1) for rounded grains (Reference Yamanoi and EndoYamanoi and Endo, 2002) (DSM factor = 0) under equi-temperature conditions. The decrease in the DSM factor during equi-temperature conditions is shown in Figure 5. The DSM factor is generally between 0 and 1. As estimated using Equation (3), however, it is sometimes larger than 1. Equation (2) was formulated by a power law approximation using the shear strength data for depth hoar. These data have some scatter, and some shear strengths were below the value calculated using Equation (2).

Fig. 5. Temporal variation in the DSM factor during equi-temperature metamorphism. Negative value of elapsed time refers to the time interval during which snow was exposed to a high temperature gradient.
The DSM factor at the lower measurement point showed some variation during the experiment. During this experiment, part of the bottom layer melted, even though the electric heater was controlled to keep the bottom temperature at 0˚C. Thus, as a precautionary measure, the heater should be controlled to keep the bottom temperature below 0˚C. The variation in the DSM factor at the lower point caused difficulty in estimating the decrease in the DSM factor. Therefore, only the decrease in the DSM factor at the upper point was used in the estimation. The difference in the DSM factor from just after the release of the temperature gradient to the last shear strength measurement was used. The results showed that the DSM factor decreased from 1.04 to 0.84 and 0.79, at –10˚C and –5˚C, respectively, in 55 days. These results indicate a rate of decrease in the DSM factor corresponding to an increase in shear strength under equi-temperature conditions of 0.0036 d–1 and 0.0045 d–1 at –10˚C and –5˚C, respectively. The decrease in DSM factor was parameterized using these results.
4. Implementation In the Snowpack Model
4.1 Increase in DSM factor during kinetic growth metamorphism
The increase in DSM factor, as parameterized by Reference Hirashima, Abe, Sato and LehningHirashima and others (2009), is based on changes in shear strength measured during kinetic growth metamorphism. The increase in DSM factor was calculated using:
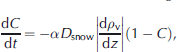
where D snow is the water vapour diffusion coefficient in snow, ρ v is water vapour pressure, and α is a coefficient reflecting the speed at which the DSM factor changes depending on water vapour flux. In the experiment of Reference Hirashima, Abe, Sato and LehningHirashima and others (2009), α had a negative correlation with average snow density:
where ρ is the snow density (kgm–3).
4.2 Estimation of the decrease in DSM factor during equi-temperature metamorphism
In our previous model, the decrease in the DSM factor was estimated by the following equation for increase in sphericity (Reference Lehning, Bartelt, Brown, Fierz and SatyawaliLehning and others, 2002):

where θ wat is the volumetric water content, θ w m is the mass fraction of liquid water (%), and T is the snow temperature. However, application of Equation (6) in this context is not supported by theoretical considerations or observational data and thus should be improved.
The new parameterization was determined using the results of the experiment described in section 3. Although changes in grain size, bond size and bond length during equitemperature metamorphism were theorized using mixture theory (Reference Brown, Edens and BarberBrown and others, 1999, Reference Brown, Satyawali, Lehning and Bartelt2001), a theory regarding changes in shear strength had not been constructed.
Here we used linear approximation based on the decrease in the DSM factor with time for snow kept at –5˚C and –10˚C. In the experiment, the rate of decrease in the DSM factor was 0.0036 d–1 at –10˚C, and 0.0045 d–1 at –5˚C. The rate of decrease related to snow temperature was parameterized by connecting the two points and extrapolating. Thus, the equation for DSM decrease becomes:
where T is the snow temperature (˚C). The DSM factor decreased by 0.25 and 0.20 at –5˚C and –10˚C, respectively, over 55 days. We used both Equations (6) and (7) to calculate the decrease in the DSM factor and compared the results.
4.3 Simulation result
For the simulation, SNOWPACK was run under the same conditions as the experiments described in section 3. The initial condition of the snow profile was set as the same as that of the first direct observation in the experiment (just after snow formation). In the initial condition, snow densities in each of the three snow layers were assumed to be homogeneous: 205 kg m–3 for the upper, load-producing snow layer (rounded grains), 67 kg m–3 for the experimental snow layer (precipitated particles), and 231 kg m–3 for the snow bed (rounded grains). These initial snow densities were determined based on the measured value when snow formation was complete (on 28 April). Measured surface and bottom temperatures were used as the input data for the boundary conditions in the model. The simulation was carried out from the time of the first measurement to the time of last measurement of the manual observations.
Simulated snow type and DSM factors are shown in Figure 6. The snow metamorphosed into faceted crystals about 155 hours after the simulation was started (Fig. 6a). Subsequently, the faceted crystals metamorphosed into rounded grains about 36 hours after the temperature gradient was released. The DSM factor simulated using Equation (6) became 0 about 86 hours after the temperature gradient was removed in the previous model (Fig. 6b). Conversely, the DSM factor using Equation (7) was approximately 0.8 at the end of the experiment, in the simulation using the new parameterization (Fig. 6c). The shear strength estimated by the parameterized version was about one-third that of the previous version.

Fig. 6. SNOWPACK results for the same conditions as the experiment. Negative value of elapsed time refers to the time interval during which snow was exposed to a high temperature gradient. (a) Grain type, (b) DSM factor with previous version, and (c) DSM factor with current version.
The simulated snow depth, snow temperature, density and DSM factor were compared with the measured values at –5˚C (Fig. 7). Simulated snow depth, temperature and density corresponded well to the measured values. The decrease in DSM factor that followed the release of the temperature gradient (elapsed time = 0) was close to the measured value in the parameterized version using Equation (7) (current version).

Fig. 7. Comparison between measured and SNOWPACK simulated snow parameters: (a) snow density, (b) temperature, (c) snow depth, (d) DSM factor with previous version and (e) DSM factor with current version. Negative value of elapsed time refers to time interval during which snow was exposed to a high temperature gradient.
The simulated shear strength was compared with the measured results (Fig. 8). The simulated strength was calculated with four algorithms: the original algorithm of Reference Lehning, Fierz, Brown and JamiesonLehning and others (2004), which used the equation of Reference Jamieson and JohnstonJamieson and Johnston (2001), the parameterized version for Japanese snow (Reference Hirashima, Nishimura, Yamaguchi, Sato and LehningHirashima and others, 2008), which used the equation of Reference Yamanoi and EndoYamanoi and Endo (2002), and using the DSM factor (previous version and current version). In the previous version, shear strength was overestimated and almost the same as that calculated by Reference Hirashima, Nishimura, Yamaguchi, Sato and LehningHirashima and others (2008) after the temperature gradient was released, because the DSM factor became zero immediately. The results using the current version and the equation of Reference Jamieson and JohnstonJamieson and Johnston (2001) (Reference Lehning, Fierz, Brown and JamiesonLehning and others, 2004) were close to the measured values. In the equation of Reference Jamieson and JohnstonJamieson and Johnston (2001), the relationship between snow density and shear strength was not significantly different for rounded grains versus faceted crystals. With this equation, the increase in shear strength due to equi-temperature metamorphism could not be simulated (dashed grey line in Fig. 8). In contrast, the increase in shear strength during equi-temperature metamorphism was reproduced in the current version using experimental results.

Fig. 8. Comparison between measured and simulated shear strengths during equi-temperature metamorphism at –5˚C. Negative value of elapsed time refers to the time interval during which snow was exposed to a high temperature gradient.
5. Discussion
As a first approach for parameterizing the increase in shear strength during equi-temperature metamorphism, experiments with isothermal temperature conditions of –5˚C and –10˚C were undertaken. The increase in shear strength during equi-temperature metamorphism is important in the estimation of slope stability. Faceted crystals that form near the snow surface will be buried by new snowfall and develop into a weak layer that is subsequently subject to a small temperature gradient. In low temperature gradient conditions, the shear strength of buried faceted crystals increases due to equi-temperature metamorphism. Parameterizing the rate of shear strength increase for faceted crystals can help in estimating the associated decrease in avalanche danger. The two rates of shear strength increase measured in this study are only two of many possible patterns for equitemperature metamorphism, all of which are related to snow temperature, grain size, grain shape and grain connectivity.
Changes at temperatures higher than –5˚C or lower than –10˚C cannot be determined from this study. Metamorphism near the melting point may be faster than the value estimated using linear extrapolation from this study’s results, and experiments on equi-temperature metamorphism near the melting point are necessary. A theoretical approach is also necessary to estimate changes in shear strength under conditions different from those in this study. The application of mixture theory (Reference Brown, Edens and BarberBrown and others, 1999, Reference Brown, Satyawali, Lehning and Bartelt2001) seems most appropriate for constructing a theoretical model of shear strength, and will be the next stage in our investigation of the shear strength of faceted crystals.
The DSM factor generally reflects the nature of the bonds among snow crystals: it is typically large bonds for rounded snow crystals with small DSM factor, but smaller bonds for faceted snow crystals with large DSM factor. At the end of the experiment in this study, however, the snow crystals were rounded (Fig. 2c), even though the DSM factor was 0.79. This result indicates that the relationship between crystal shape and DSM factor is not simple. Non-destructive measurement using tomographic equipment, such as an X-ray scanner (e.g. Reference Coléou, Lesaffre, Brzoska, Ludwig and BollerColéou and others, 2001; Reference Schneebeli and SokratovSchneebeli and Sokratov, 2004) or MRI (Reference Ozeki, Kose, Haishi, Nakatsubo, Nishimura and HachikuboOzeki and others, 2003), would be necessary to investigate the relationship between snow crystal morphology and the DSM factor.
Another shortcoming of this work is the estimation of viscosity for faceted crystals. In natural snow, faceted grains formed at the beginning of winter stay near the bottom of the snow layer and receive a large load from overlying snow. Instruments in this study reproduced only a limited amount of snowload. This limitation probably affected the degree of error in the estimated values of snow density and shear strength. Thus, accurate estimation of viscosity for faceted crystals is also important and warrants further experimentation.
6. Conclusions
Estimation of the shear strength of buried faceted crystals is important for determining avalanche risk. In this study, changes in the shear strength of faceted crystals were measured under equi-temperature conditions in the laboratory. The air temperature and bottom temperature of the snow layer were controlled to create a large temperature gradient for 8.8 days. Faceted crystals developed under this high temperature gradient. Subsequently, the temperature gradient was eliminated and the snow was kept under equitemperature conditions (–5˚C and –10˚C) for 55 days. During the experiments, snow density and shear strength were measured six times.
Under the conditions of high temperature gradients, both snow density and shear strength increased. Conversely, after the temperature gradient was removed, shear strength increased despite only a small increase in snow density.
Measured shear strength was compared with that calculated using an empirical relationship between snow density and shear strength. The measured shear strength approached the calculated value for faceted crystals when there was a large temperature gradient, whereas it approached that for rounded crystals after the temperature gradient was removed.
The DSM factor, which was defined to express the developmental stage of faceted crystals by Reference Hirashima, Abe, Sato and LehningHirashima and others (2009), was used to model the increase in shear strength under constant temperature conditions. The DSM factor decreased from 1.04 to 0.84 at –10˚C, and from 1.04 to 0.79 at –5˚C, in 55 days. The rate of decrease in the DSM factor was 0.0045 d–1 and 0.0036 d–1 at –5˚C and –10˚C, respectively. Based on this result, the decrease in DSM factor was parameterized and incorporated in the numerical SNOWPACK model. The parameterized model reproduced the increase in shear strength during equi-temperature metamorphism at –5˚C and –10˚C.
Parameterizing the rate of shear strength increase in snow composed of faceted grains is important in estimating avalanche dangers, especially for estimating when avalanche danger will be alleviated. Under real-world conditions, there are many patterns for the rate of the shear strength increase during equi-temperature metamorphism. Thus, estimation of shear strength increase for various snow temperature conditions, especially near the melting point, is critical. Any theoretical approach should include various physical conditions as well as different grain sizes and connectivities. Future work should compare modelled predictions with documented avalanche conditions to validate the applicability of models to avalanche prediction.
Acknowledgements
This study is part of ‘A research project for developing a snow disaster forecasting system and snow-hazard maps’. The SNOWPACK model used in this study was developed by M. Lehning, whom we especially thank. We also thank S. Mochizuki and G. Okawa for their support in conducting the experiment. Helpful comments and suggestions from editor and reviewers, E. Adams, P. Staron and an anonymous reviewer, are gratefully acknowledged. We also thank other members of the Snow and Ice Research Center, NIED, for helpful comments and discussions.


