Introduction and Aims
This paper examines the impact of variations in albedo (a) and aerodynamic roughness length (z0) on spatial and temporal patterns in the modelled surface energy balance of Haut Glacier d’Arolla, Switzerland, during the ablation season. Glacier-wide seasonal variations in a and z0, associated with changing surface conditions, were incorporated into the semi-distributed and physically based surface energy-balance model of Reference Arnold, Willis, Sharp, Richards and LawsonArnold and others (1996) using the relationships of Reference BrockBrock (1997). Four modelling experiments were performed with the updated model to address the following specific aims:
-
1. To assess the accuracy of the updated model in calculating surface melt rates by comparison with measurements of surface lowering at 13 ablation stakes throughout the 1993 ablation season.
-
2. To examine the impact of the evolution of a and z0 on the spatial patterns of the net shortwave, turbulent and melt energy fluxes across the glacier surface at monthly intervals between early and late summer.
-
3. To assess the impact on the surface energy balance of meteorological conditions and the changes in a and z0 associated with summer snowfall events.
-
4. To examine the combined effects of variations in a and z0 and meteorological conditions on the surface energy balance over the course of the ablation season, using time series of data.
Background
The surface melt rate of a snow or ice surface can be calculated from evaluation of the surface energy balance (e.g. Reference Rothlisberger, Lang, Gurnell and ClarkRothlisberger and Lang, 1987). There have been numerous point measurements of glacier surface energy balance (e.g. Reference Hay and FitzharrisHay and Fitzharris, 1988; Reference Braithwaite and OlesenBraithwaite and Olesen, 1990; Reference MunroMunro, 1990), which have aimed to test and improve energy-balance theory. Several studies have investigated the variation of the energy balance along glacier centre lines, to investigate how glacier mass-balance gradients might respond to climate change (e.g. Reference OerlemansOerlemans 1992, Reference Oerlemans1993; Reference Oerlemans and FortuinOerlemans and Fortuin, 1992). However, only rarely have two-dimensional models, which calculate spatial variation in the surface energy balance, been used to calculate variation in melt rates across a glacier (e.g. Reference Munro and YoungMunro and Young, 1982; Reference Escher-VetterEscher-Vetter, 1985; Reference Arnold, Willis, Sharp, Richards and LawsonArnold and others, 1996; Reference Hock and NoetzliHock and Noetzli, 1997). These models employ digital terrain models (DTMs) to calculate variation in the shortwave radiation.
As yet, no study has specifically examined spatial and temporal variations in the surface energy balance and melt across an entire glacier throughout an ablation season. The limitations of current two-dimensional energy-balance models prevent such an analysis. First, all the models, except that of Reference Arnold, Willis, Sharp, Richards and LawsonArnold and others (1996), require prescribed values of a for different surface types (e.g. old and new snow, firn, slush and ice) as input to the model, rather than generating them internally. Although this approach is appropriate for ˚bulk" discharge calculations, it is less suitable for investigations of spatial and temporal patterns of the energy balance across a glacier. Furthermore, the parameterization scheme used to calculate spatial and temporal a variations within Reference Arnold, Willis, Sharp, Richards and LawsonArnold and others’ (1996) model, based on Reference OerlemansOerlemans (1992, Reference Oerlemans1993), is hypothetically rather than physically based. Second, none of the energy-balance models calculates spatial or temporal variations in z0, although potentially these can have a large effect on the surface melt rate (Reference BraithwaiteBraithwaite, 1995; Reference Hock and NoetzliHock and Noetzli, 1997). Accurate parameterizations of a and z0 variations are required to reflect physical changes in glacier surface conditions over an ablation season.
Modelling of spatial and temporal patterns in the surface energy balance and melt across a glacier is important for a number of reasons: (i) to increase the accuracy of melt and discharge calculations from glacierized basins for hydroelectric power, flood control and water management (Reference Lang, Kraijenhoff and MollLang, 1986; Reference Willis and BonvinWillis and Bonvin, 1995); (ii) to make accurate calculations of spatial and temporal variation in surface meltwater inputs to a glacier for studies of glacier hydrology, water quality and dynamics (e.g. Reference Brown, Sharp, Tranter, Gurnell and NienowBrown and others, 1994; Reference Hubbard, Sharp, Willis, Nielsen and SmartHubbard and others, 1995; Reference Harbor, Sharp, Copland, Hubbard, Nienow and MairHarbor and others, 1997; Reference Arnold, Richards, Willis and SharpArnold and others, 1998); (m) to investigate the response of surface melt rates to summer snowfall events and to climate change.
Methods
Field site
Haut Glacier dArolla is a 6.3 km2 valley glacier inValais, Switzerland, with an elevation range of about 2550–3500ma.s.L, consisting of an upper basin with northwesterly aspect feeding a glacier tongue flowing to the north (Fig. 1). Steep slopes above 3000ma.s.l. and surrounding mountain divides above 3500ma.s.l. cast shadows and hence play an important role in the glacier’s radiation balance (Reference Arnold, Willis, Sharp, Richards and LawsonArnold and others, 1996). This glacier has been the site of an integrated study of meteorology, hydrology, water quality and dynamics for over 10 years (Reference RichardsRichards and others, 1996), and numerous datasets are available.
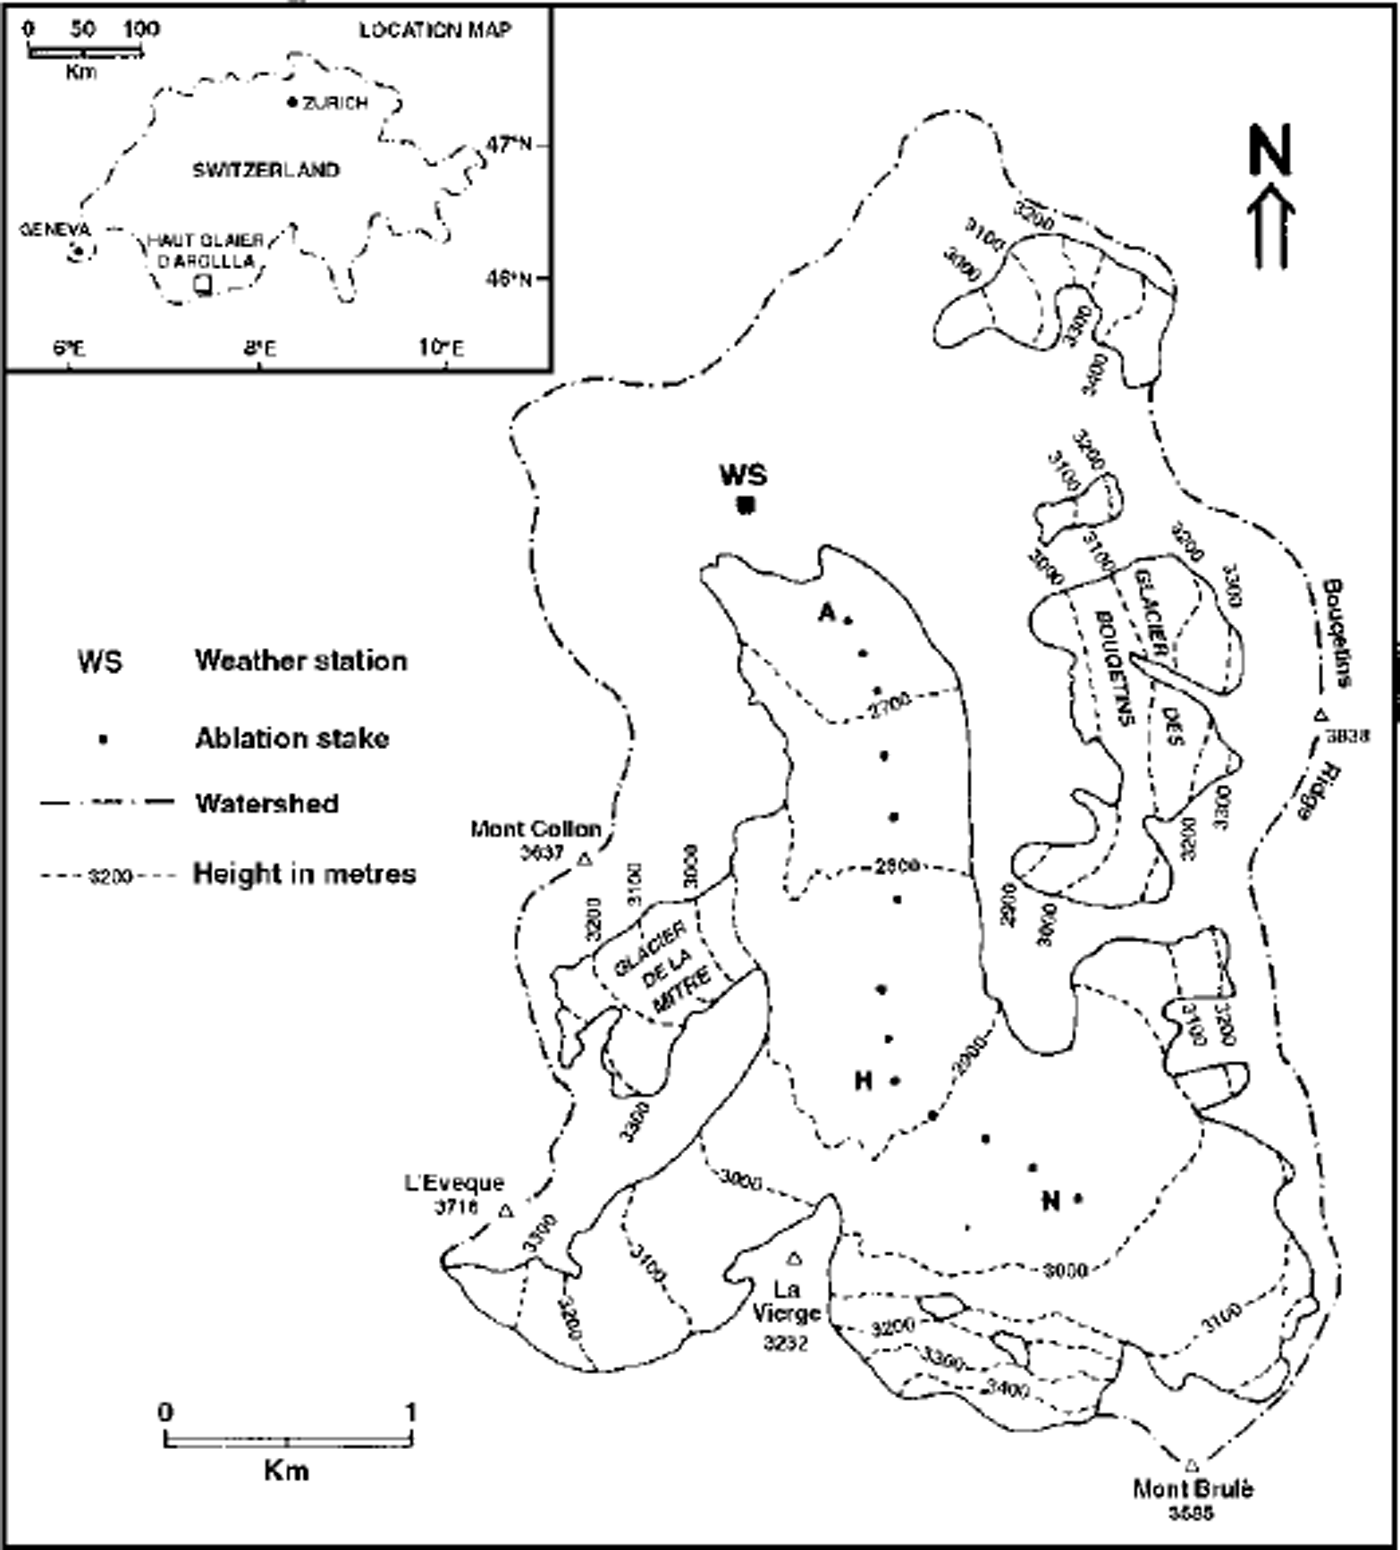
Fig. 1 Site map of Haut Glacier d’Arolla.
The original surface energy-balance model
The surface energy-balance model used in this study is described in detail by Reference Arnold, Willis, Sharp, Richards and LawsonArnold and others (1996), so only the main components of the model are described here. The surface melt rate,
![]() Qμ, is calculated from:
Qμ, is calculated from:
where Q* is the net shortwave radiation flux, I* is the net longwave radiation flux and Qs and QL are the turbulent fluxes of sensible and latent heat, respectively. By convention, all fluxes are considered positive when directed towards the surface (e.g. Reference Rothlisberger, Lang, Gurnell and ClarkRothlisberger and Lang, 1987). The values of the energy fluxes are calculated in 20 m × 20 m gridcells across the glacier surface at an hourly time-step. Heat conduction into the surface layer is not calculated, as this is considered to be a minor energy flux during the ablation season at Haut Glacier d’Arolla (Reference Arnold, Willis, Sharp, Richards and LawsonArnold and others, 1996).
Four main inputs to the model are required: (i) a high-resolution DTM of the glacier surface and surrounding basin; (ii) knowledge of solar elevation and azimuth; (iii) variation in snow depth across the glacier surface at the start of the ablation season; and (iv) meteorological data recorded close to the glacier, which are used to compute the components of the energy balance and melt in each gridcell. In the present study, meteorological data were recorded at an automatic weather station (WS in Fig. 1), located at a proglacial site 200 m from the glacier snout. New snow was assumed to fall if rain was recorded at the meteorological station when the temperature in an individual cell was ω1 °C.
In the model, the direct and diffuse solar radiation recorded on a horizontal plane at the weather station is adjusted for solar incidence and azimuth angles using a geometrical calculation, and for surface aspect and slope using the DTM of the glacier surface. Shading of the glacier surface at different times of day is calculated using the DTM of the surrounding topography. Diffuse radiation was assumed to equal 20% of the direct solar beam (Reference OerlemansOerlemans, 1993). If in shade, a cell receives only diffuse radiation, to which reflected radiation from the surrounding topography is added using a view-factor relationship (Reference Munro and YoungMunro and Young, 1982).
Incoming longwave radiation is calculated as the combination of clear sky and cloud emission, following Reference Braithwaite and OlesenBraithwaite and Olesen (1990). The longwave emission of both sky and clouds is calculated as a function of the air temperature at the meteorological station and the clear sky and cloud emissivities. Cloud cover was not recorded at the weather station, and was instead calculated from an empirical relationship using daily temperature range. No measurements of the influence of the surrounding topography on incoming longwave radiation were available, so this influence was ignored. The outgoing surface longwave radiation was assumed to be always 316 W m–2, i.e. that of a ˚black body"at 0°C.
Updating the model
New parameterizations were incorporated into the model to calculate spatial and temporal variations in a and z0. The parameterizations were developed using over 500 measurements of a and z0 made at sample points distributed across Haut Glacier d’Arolla in September 1992, between May and September 1993 and inJuly and August 1994 (Reference BrockBrock, 1997). A range of surface and meteorological variables were also measured to provide the independent variables on which the a and z0 parameterization were based. At each sample point the snow depth, density and grain-size, and at 36 sample points the solid impurity concentration, were recorded if the surface was snow. If the surface was ice, the percentage surface debris cover was visually assessed using a 0.5 m2 quadrat. At 13 sample points regular measurements of surface lowering were made to derive the accumulated melt. Meteorological variables were monitored continuously throughout the measurement period at the weather station (Fig. 1), and hourly means of 1 s samples recorded.
Albedo was measured with a Kipp and Zonen CM7B portable albedometer. The a measurements were made within 3 hours of solar noon under cloud-free conditions and in a surface-parallel plane. Under these conditions the pyranometer accuracy was ±2%, and geometrical factors, due to incorrect instrument position and surface microtopography cause a variations of ω0.02 (for a ratios in the range 0.0–1.0) (Reference BrockBrock, 1997). Measurements of surface microtopography were used to calculate z0 at each sample point using the empirical formula of Reference LettauLettau (1969), following the methodology of Reference MunroMunro (1990). It is difficult to quantify the errors associated with this method since a comparison with eddy fluctuation z0 measurements, which provide the only truly reliable measurements of z0, were not available for comparison. The main source of uncertainty is in how representative a point z0 measurement is at the fetch scale (hundreds of metres). On snow, which was relatively spatially homogeneous, this uncertainty was small. The one standard deviation range of z0 was 0.03–0.10 mm on early-season snow (late May)and 0.58–1.92 mm on rough snow (late June). For ice the one standard deviation range was 0.92–5.47 mm.
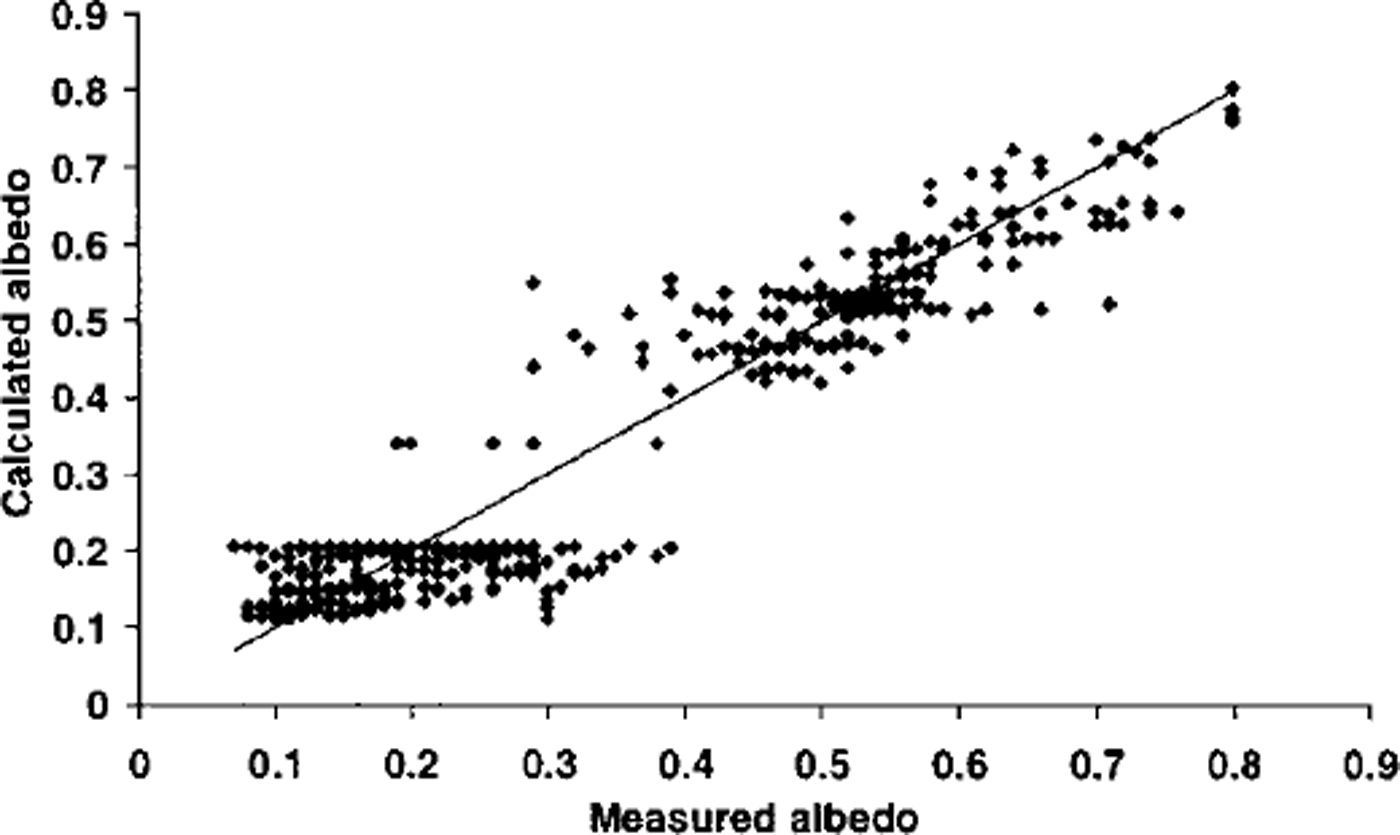
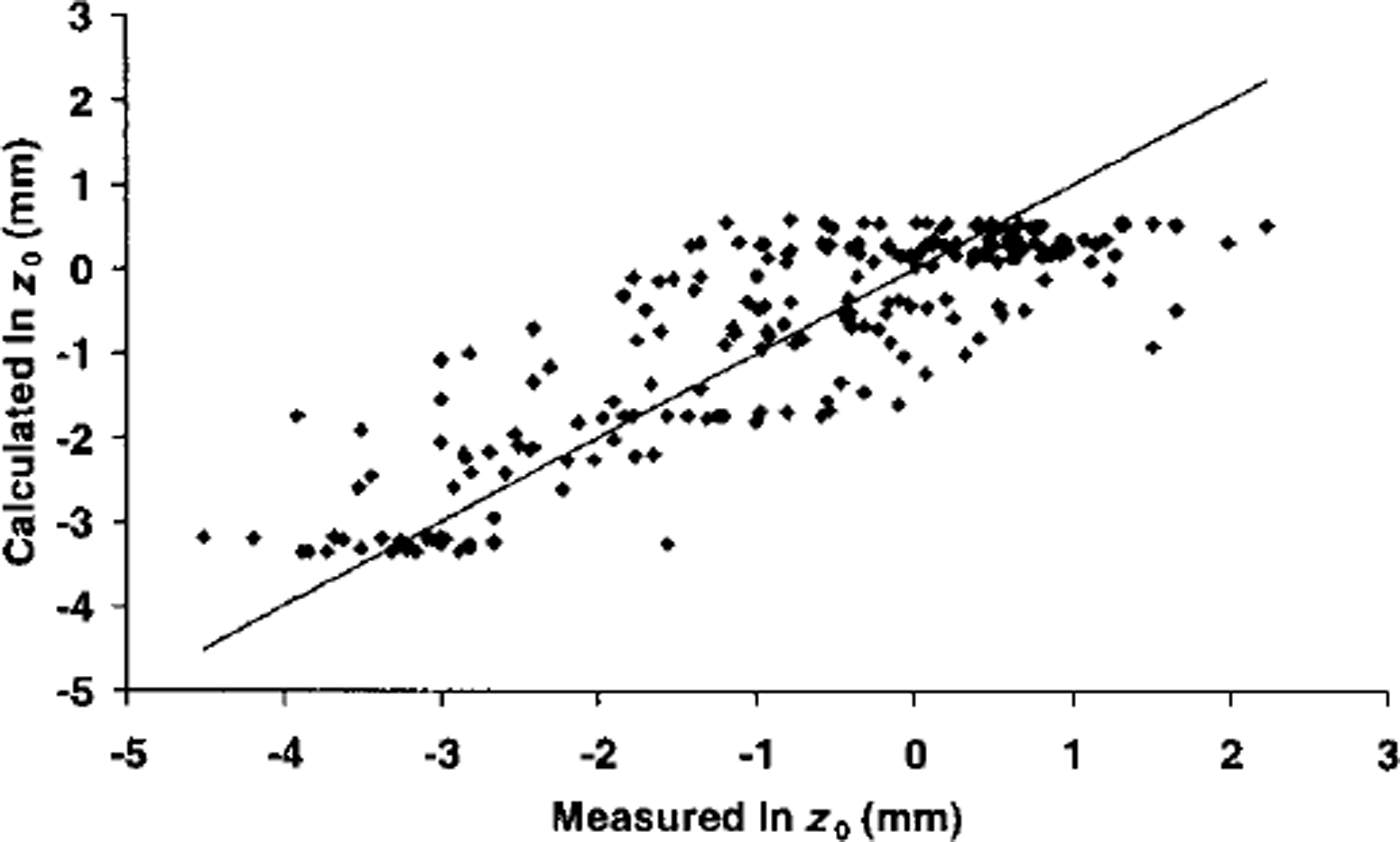
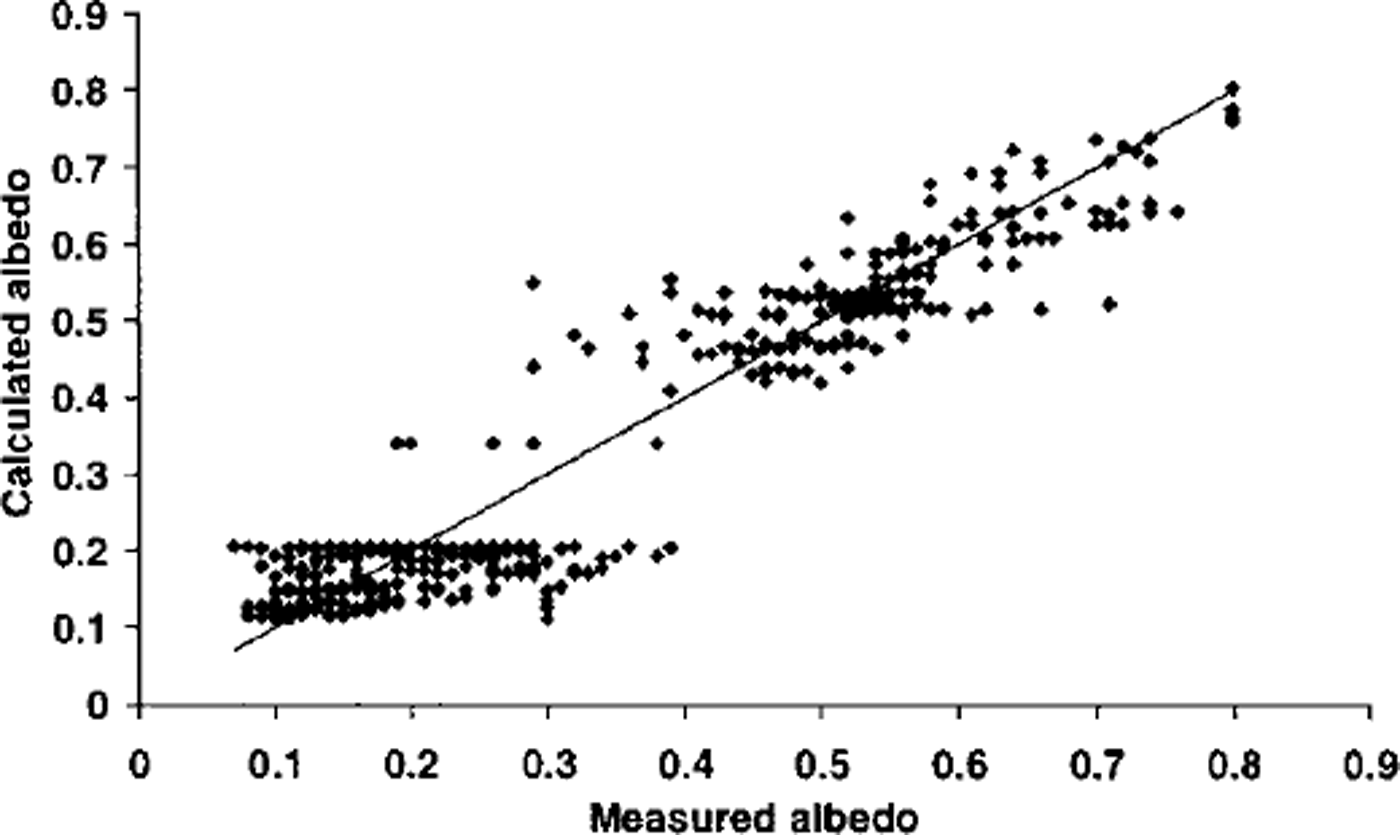
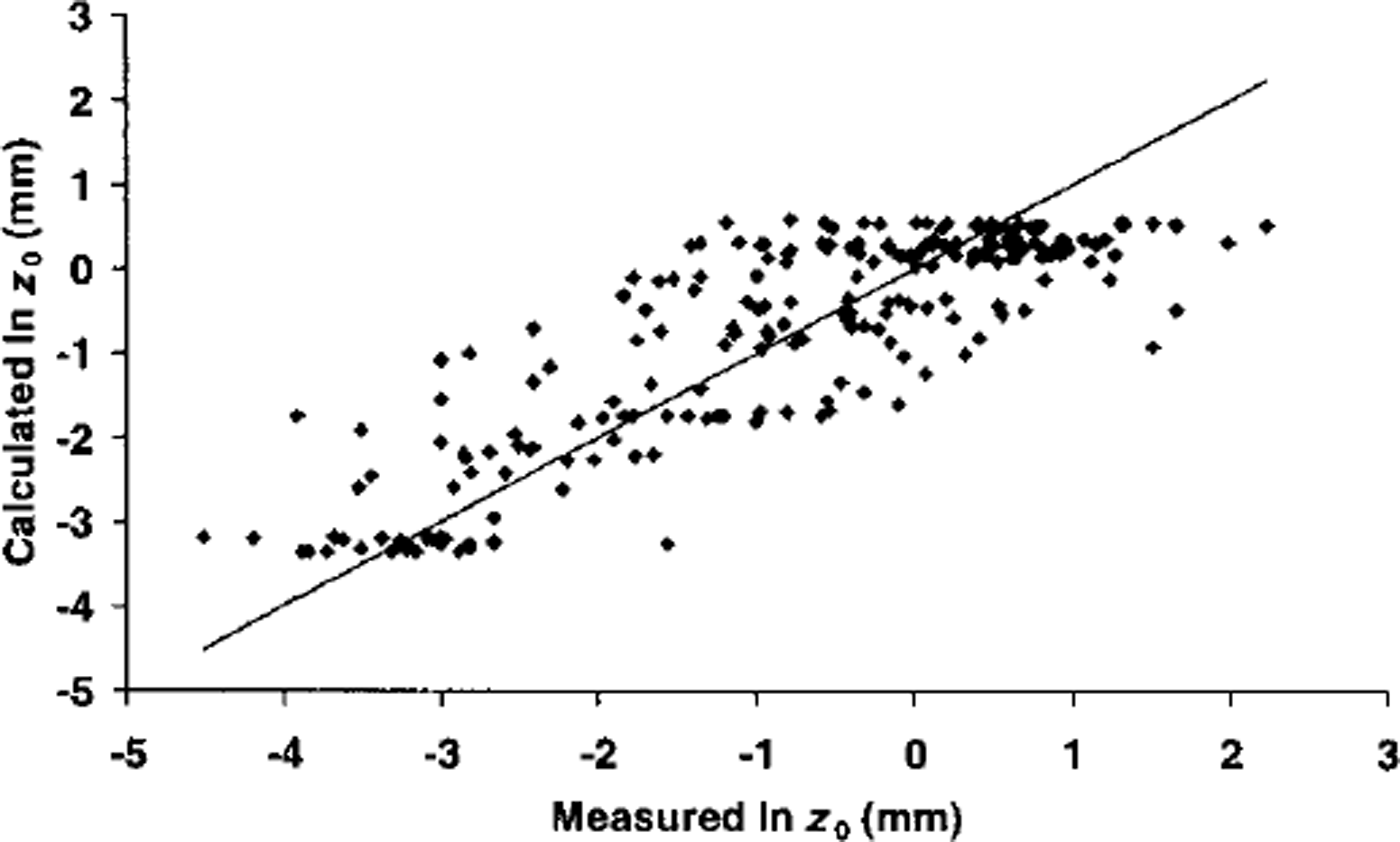
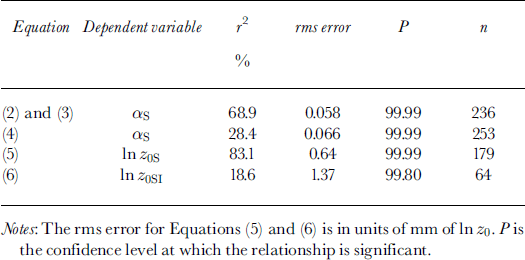
The parameterizations were developed by regressing the dependent variable (a or z0) on the independent variables using a least-squares procedure. The most explanatory relationships were identified using τ 2 and root-mean-square (rms) error statistics (Equations 2–6; Table 1).
Table 1. Albedo and aerodynamic roughness-length parameter-izatwns: goodness of fit summary statistics
In the updated model, snow a (σs) was thus calculated as a logarithmic function of accumulated daily maximum temperatures since the last snowfall (AT) in °C, to account for the temporal decrease of σs associated with increases in grain-size and impurity load in melting snow. Separate relationships were used to calculate σs on shallow snow ω0.02 m we. deep, which was affected by the a of the underlying ice, and snow ≥ 0.02 m we. deep which was independent of the underlying material:

AT increased from a value of 0 on the day of a snowfall. Snow a was not allowed to vary outside the range 0.20–0.85, to ensure unrealistic σs values were not produced. In the updated model, ice a (a,) was calculated as a non-linear function of elevation, to account for longitudinal spatial a variation associated with increasing debris cover down-glacier:
Equations (2) and (3) were very successful at calculating σs variation, while Equation (4) explained a smaller but significant amount of «i variation (Table 1; Fig. 2).
The variation of z0 over snow surfaces was calculated using a relationship which calculated the natural logarithm of snow z0 (In zos) as a non-linear function of AT, to account for increasing snow roughness during snowmelt:

No relationship could explain a significant amount of z0 variation over ice (z0I). However, to enable the probable range of turbulent-flux magnitude over ice to be calculated, cell ice z0 values were generated by sampling randomly from a normal distribution of ln z0 values. The sample distribution was defined by the mean and standard deviation of ln z0 I, which had values of 0.81 and 0.89, respectively.
Fresh snowfalls on older snow surfaces were treated implicitly in the snow ln z0 parameterization (Equation (5)). The cell z0 following a fresh snowfall on an ice surface was calculated using a separate relationship:
In z0 following snowfall on an ice surface (In z0Si):
where SD is snow depth (m). This equation was used to calculate cell z0 so long as new snow was present, after which z0 returned to the value for ice. The correspondence between ln z0 calculated from Equations (5) and (6) and measured ln z0 was good, although the calculated range was smaller than the true range (Table 1; Fig. 3).
In the model, the original turbulent-flux calculation was replaced with a ˚bulk" aerodynamic approach, sensitive to variations in atmospheric stability and z0, following Reference MunroMunro (1990). The vertical fluxes of Qs and QL were calculated from cell 2 m height z air temperature (Tc) in °C, horizontal wind speed (uc) in m s"1 and vapour pressure (εc) in Pa. It was assumed that the surface was always melting. Cell temperature was calculated using an atmospheric lapse rate of 6.5°C per 1000 m, whereas wind speed was assumed constant for all cells. Cell air pressure was calculated using a lapse rate of 10 kPa per 1000 m, from 100 kPa at sea level. To account for the effects of atmospheric stability in the surface layer, integrated stability functions were introduced into the vertical-flux equations (Reference DyerDyer, 1974):


where p is the air density (kg m–3), cP is the specific heat capacity of air at constant pressure (Jkg–1), k is the von Karman constant (0.40), ε is the ratio of the molecular weight of water vapour to air (0.622), Lv is the latent heat of vaporisation (J kg–1), εs is the vapour pressure at the surface (Pa), ρc is the atmospheric pressure and σM is a stability correction constant, for which a value of 5, following Reference DyerDyer (1974), was used. Similarity between z0 and the scalar roughness lengths for temperature and humidity, zt and zε, respectively, was assumed, due to uncertainty over the exact form of the relationship of zt and ze to z0 (Reference MooreMoore, 1983; Reference BraithwaiteBraithwaite, 1995).
The Obukhov length scale, L, was calculated from:

where
![]() is the absolute temperature (K) of the air between the surface and the measurement height (calculated as the mean of the air temperature at 2 m and the surface temperature) and g is the gravitational acceleration (ms–2). The friction velocity, u*,was calculated as follows:
is the absolute temperature (K) of the air between the surface and the measurement height (calculated as the mean of the air temperature at 2 m and the surface temperature) and g is the gravitational acceleration (ms–2). The friction velocity, u*,was calculated as follows:

The problem of needing a priori knowledge of the values of Qs and u* before L could be calculated was overcome by iteration (Reference MunroMunro, 1990). Initially, Qs and u* were calculated for neutral conditions z/L = 0, and these values are then used to obtain an initial estimate of L. This value was then re-substituted to obtain subsequent values of Qs and U*.This method normally converged in under ten iterations to give the values of u*,L and Qs.
Input data
The 1993 ablation season was defined as the period 21 May-12 September. Snow depth was measured at 30 sites across the glacier at the start of the 1993 ablation season. From these measurements the relationship of snow depth to elevation was defined, to calculate the initial snow depth (ISD) in metres in each cell:
Hourly means of incoming shortwave radiation, rainfall and the 2 m height wind speed, temperature and humidity were recorded throughout the 1993 ablation season at the weather station. Regular measurements of surface lowering were made throughout the 1993 ablation season at 13 ablation stakes positioned along the glacier centre line at 2602–2988 m a.s.l. (Fig 1). These measurements were used to assess model accuracy in calculating the surface melt rate.
˚Weather-type" days
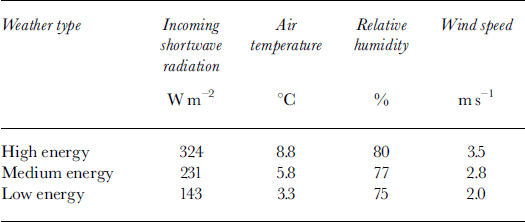
In order that the impact of variation in a and z0 on the surface energy balance could be examined independently from variation in meteorological conditions, meteorological input to the model was held constant on particular days. To facilitate this, three ˚weather types" were defined corresponding to ˚high", ˚medium" and ˚low" energy inputs to the glacier surface (referred to as high-, medium- and low-energy weather conditions henceforth), based on the values of each meteorological variable recorded at the weather station in the 1993 ablation season. Twenty-four hourly frequency distributions (one for each hour of the day) were defined for each variable. The value of each meteorological variable was defined by the mean of its distribution under medium-energy weather conditions, and one standard deviation above and below the mean under high- and low-energy weather conditions, respectively (Table 2). The use of values one standard deviation above and below the mean represented the range of typical meteorological conditions at the glacier, rather than extreme values.
Table 2. Daytime mean incoming shortwave radiation and 24 hour means of air temperature, relative humidity and wind speed under high-, medium- and low-energy weather types
Model runs
Four separate energy-balance experiments were conducted corresponding to the four aims stated in the introduction.
-
1. The model was run from 21 May to 12 September 1993, and melt-rate values calculated in the 13 gridcells corresponding to the locations of the ablation stakes compared with the measured melt rates. In addition, the modelled period of snow cover from the start of the ablation season at each stake was compared with field measurements.
-
2. The model was run from the start of the ablation season, using meteorological data recorded at the weather station, to calculate the spatial variation of a and z0 across the glacier on four days at 4 week intervals during the 1993 ablation season (30 May, 27 June, 25 July and 22 August). Output values of surface conditions and surface energy fluxes were produced for each day. On the four days in question the three types of weather conditions defined in Table 2 were used as meteorological input to the model.
-
3. Late-ablation-season snowfalls have greatest impact on the surface energy balance, due to the large area of exposed ice in the ablation area and the low a of the remaining winter snowpack. Hence, a late-summer snowfall was modelled. The model was run from the start of the ablation season to 22 August, to simulate the late-season distribution surface conditions. A snowfall event of 12 cm we., of similar magnitude to those experienced in recent summers on Haut Glacier d’Arolla (Reference BrockBrock, 1997), was then modelled. The temporal variations in a, z0 and surface energy fluxes on the day before and the 7 days following the snowfall event were calculated in cells corresponding to the lowest and highest ablation stakes (2602 and 2988ma.s.L, respectively), representing the lower and upper ablation areas. Three different meteorological scenarios were modelled using the weather conditions defined in Table 2.
-
4. Mean daily values of a, z0 and each surface energy flux were calculated for the middle ablation stake (H at 2877 ma.s.l.) between 21 May and 12 September. The results were examined in conjunction with meteorological conditions recorded at the weather station. The daily values were converted to 5 day means to smooth high-frequency variation and make seasonal trends clearer.
Results
Model validation
The difference between modelled and measured mean daily ablation rates for all 13 stakes was just 0.4 mm w.e. d–1. This was a small fraction of the mean daily ablation rates which were in the range 22–42 mm w.e. d–1. This error would result in only a slight overestimate of about 0.05 m w.e. melt over an entire ablation season for total ablation in the range 2.5–4.8 m w.e. melt.
However, the rms of the difference between modelled and measured ablation rates was 3.1 mm w.e. d–1. This suggests that the surface melt rate is either under- or overestimated at individual stakes, but these errors tend to cancel each other out when a number of stakes are examined. Such variance is unsurprising, however, given that the measured melt rates are essentially point values, whereas the model calculates the melt rate for a 20 m × 20 m area. Field studies have demonstrated that measurements of surface lowering at ablation stakes generate highly spatially variable surface melt values, and that several ablation stakes are required to generate accurate surface melt-rate values (Reference Braithwaite, Konzelmann, Marty and OlesenBraithwaite and others, 1998). Thus, overall the updated model performed very well.
Further confirmation of the model’s performance can be seen from the accuracy with which the number of days of snow cover from the start of the season at each stake was calculated (Fig. 4). Generally, the modelled snow-cover period was within a few days of the measured snow-cover period, and at most the discrepancy was 10 days. This result is all the more impressive considering it was assumed that all snow had a density of 500 kg m–3 (the mean measured value), and thus snow-density variation with depth in the winter snowpack was ignored. Furthermore, the scale difference between ablation stakes and model cells could also create differences between modelled and actual snow-cover periods of a few days. Such accurate modelling of snowline retreat is crucial for investigation of seasonal and spatial patterns in the surface energy balance due to the large contrast between a and z0 on snow and ice surfaces.
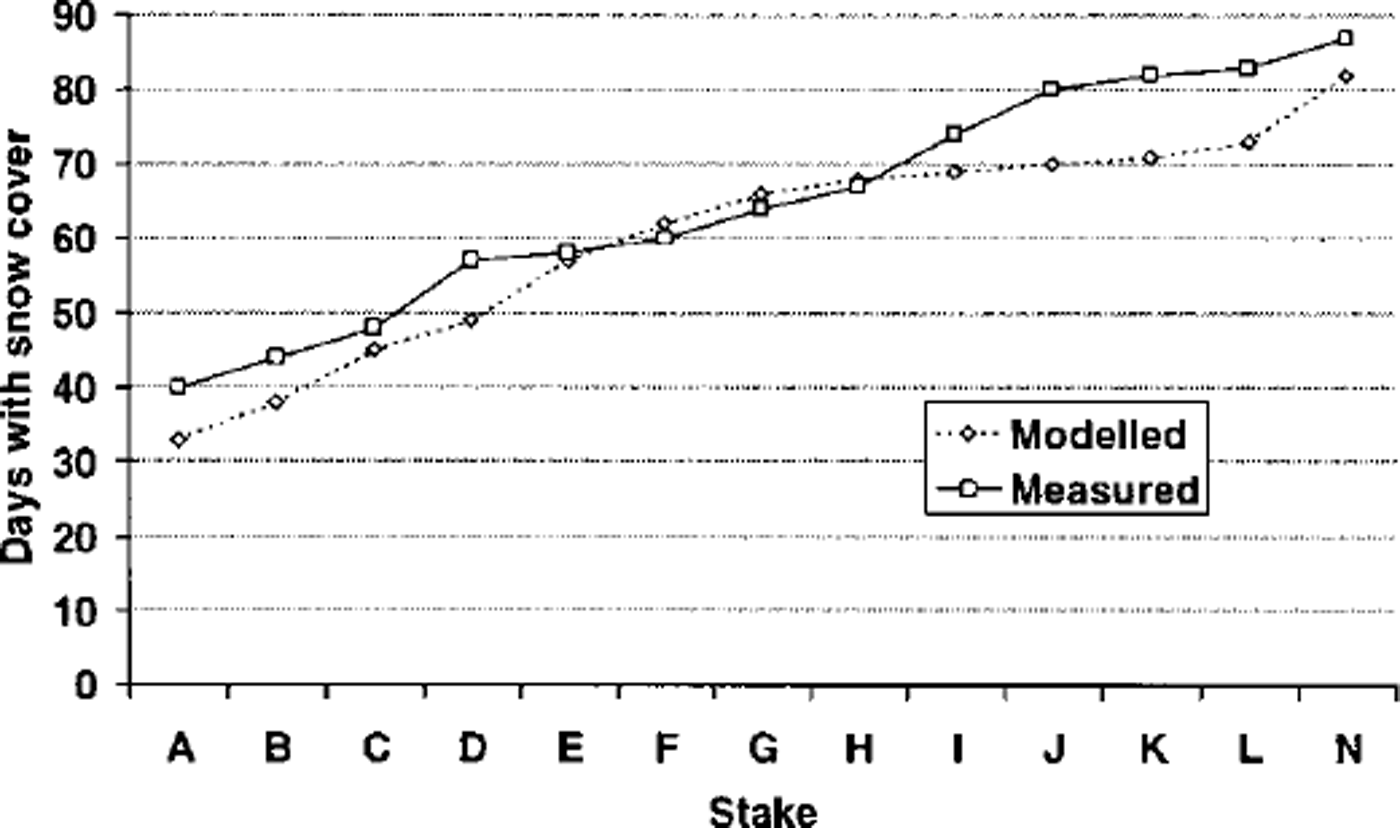
Fig. 4. Modelled and measured days of snow cover from start of ablation season at centre-line stakes.
It should be noted, however, that accurate calculation of the surface melt rate does not necessarily indicate that each component of the surface energy balance was modelled accurately, since errors in the calculation of individual fluxes may have cancelled out. While direct measurements of the individual energy fluxes on the glacier were not available for comparison, the likely error range in each flux can be estimated. The pyranometer accuracy was ±1 %, so net shortwave radiation flux errors were dependent on the accuracy of the a parameterizations, for which the rms errors are given in Table 1. The assumption that the surface was always melting could have resulted in an overestimate of the net longwave radiation flux. For example, the overestimate would be 6.6% for a surface temperature of –5°C. Air temperature was recorded to an accuracy of ±0.1 °C, so uncertainty in the incoming longwave radiation flux was dependent on errors in the estimation of cloud-cover amount. For a ±20% error in cloud cover the resulting error in incoming longwave radiation is ±4%. The turbulent-flux calculation was sensitive to a number of uncertainties which could have occurred in extrapolating point meteorological measurements at the weather station to the entire glacier. For wind-speed and temperature errors of ±20% the uncertainty in the turbulent fluxes is in the range 30–40%. The turbulent fluxes were also dependent on the accuracy of the z0 parameterizations. The z0 ranges for smooth snow, rough snow and ice in the updated model result in a further variation of 15–25% in the turbulent fluxes. However, the close correspondence between measured and calculated ablation over the 1993 ablation season suggests that errors in individual flux calculations are smaller than these maximum estimates.
Spatial and temporal patterns in surface energy balance during 1993 ablation season
Maps of the spatial variation of snow cover, a, z0 and the net shortwave, turbulent and surface melt fluxes across Haut Glacier d’Arolla on four days in the 1993 ablation season are shown in Figures 5–7. Flux values are quoted in units of mm w.e. melt under high-, medium- and low-energy weather conditions. The net shortwave flux was the main contributor to surface melt, being typically twice that of the turbulent fluxes under high-energy conditions, and increasing to three or even four times that of the turbulent fluxes under low-energy conditions. The main patterns of variation in the surface energy balance were as follows:
-
1. The position of the transient snowline was of great importance to the surface energy balance as it marked the boundary between relatively high melt rates on ice and low melt rates on snow (Fig. 5). As the ablation season progressed and the transient snowline retreated up-glacier, an increasingly large area of the glacier experienced high melt rates. The difference in melt rates on snow and ice was largely explained by the spatial pattern of a and the net shortwave radiation flux (Fig. 6). The spatial patterns of z0 and turbulent flux variation, however, were largely independent of the position of the snowline (Fig. 7). Over the glacier tongue in late June and across the entire glacier in late August, snow and ice had similar z0 values. The exception was late July (Fig. 7c), when, because recent snowfalls had reduced the z0 roughness of the winter snowpack, there was a large contrast with the rough glacier ice down-glacier.
-
2. Temporal changes in a and z0 associated with the metamorphism and melting of the winter snowpack had an important impact on the surface energy balance. In particular, the decrease in a of about 0.10 between late May and late June resulted in a large increase in the net shortwave radiation flux (Fig. 6a-b). Similarly, the increase in z0 over the same period, from about 0.1mm to ≥ 1.0 mm over a large part of the glacier tongue, resulted in a doubling of turbulent flux magnitude over snow (Fig. 7a and b). Towards the end of the ablation season, snow a was similar to that for ice, so the contrast in the net shortwave flux between snow and ice became less marked as the ablation season progressed (Fig. 6). Similarly, snow z0 increased to values comparable to those of ice z0 in late August (Fig. 7d).
-
3. Albedo tended to increase with elevation (Fig. 6). On snow this was because the increases in grain-size and impurity concentration in the snowpack, which reduce a, proceeded more slowly at low temperatures at high elevations. On ice, a decreased down-glacier due to increasing surface dust and debris. Hence, the spatial patterns of the net shortwave radiation and melt fluxes were dominated by down-glacier increases at each stage of the season (Figs 5 and 6). The effects of slope and aspect on the net shortwave and melt fluxes were superimposed on this overall trend. The effect was most noticeable on the north-facing slopes of the upper accumulation area (Figs 5 and 6). Shading also reduced the net shortwave and melt fluxes over the western side of the glacier tongue (e.g. Figs 5d and 6d).
-
The z0 decreased up-glacier in late May, June and July and this pattern was very marked in June (Fig. 7). This was because the development of ablation hollows on the snow surface proceeded more slowly at higher elevations due to lower melt rates. By the end of the ablation season the spatial variation of snow z0 was small, as in late May when ablation hollows were initiating. Overall, the spatial variation of the turbulent fluxes reflected the pattern of z0 variation combined with the decrease in air temperature, and to a lesser extent air pressure, with increasing elevation.
-
4. The impact of a and z0 on the surface energy balance was very large under high-energy weather conditions, but under low-energy conditions their impact, in particular that of z0, on the spatial variation in surface energy fluxes was small (Figs 5–7).

Fig. 5. Spatial variation of snow cover (column!) andthe surface melt-rateflux (column 2) across Haut Glacier d’Arolla on (a) 30 May, (b) 27 June, (c) 25 July and (d) 22 August 1993. Total daily fluxes under high- (H), medium-(M) and low- (L) energy weather types are given.

Fig. 6. Spatial variation of albedo (column 1) and the net shortwave radiation flux (column 2) across Haut Glacier d’Arolla on (a) 30 May, (b) 27 June, (c) 25 July and (d) 22 August 1993 Total daily fluxes under high- (H), medium-(M) and low- (L) energy weather types are given.

Fig. 7. Spatial variation of aerodynamic roughness length (column 1) and the turbulent sensible- and latent-heat.fluxes (column 2) across Haut GlacierdArolla on (a) 30 May, (b) 27 June, (c) 25 July and (d) 22 August 1993. Total daily fluxes under high- (H), medium- (M) and low- (L) energy weather types are given.
Impact of the simulated summer snowfall
The melt rate was dramatically reduced by ≥ 50% from the pre-snowfall values (snow day 0) on the day of the snowfall (snow day 1) (Fig. 8). These changes were caused by the increase in a to ≥ 0.70 and the decrease in z0 to ω0.5 mm associated with the snowfall.
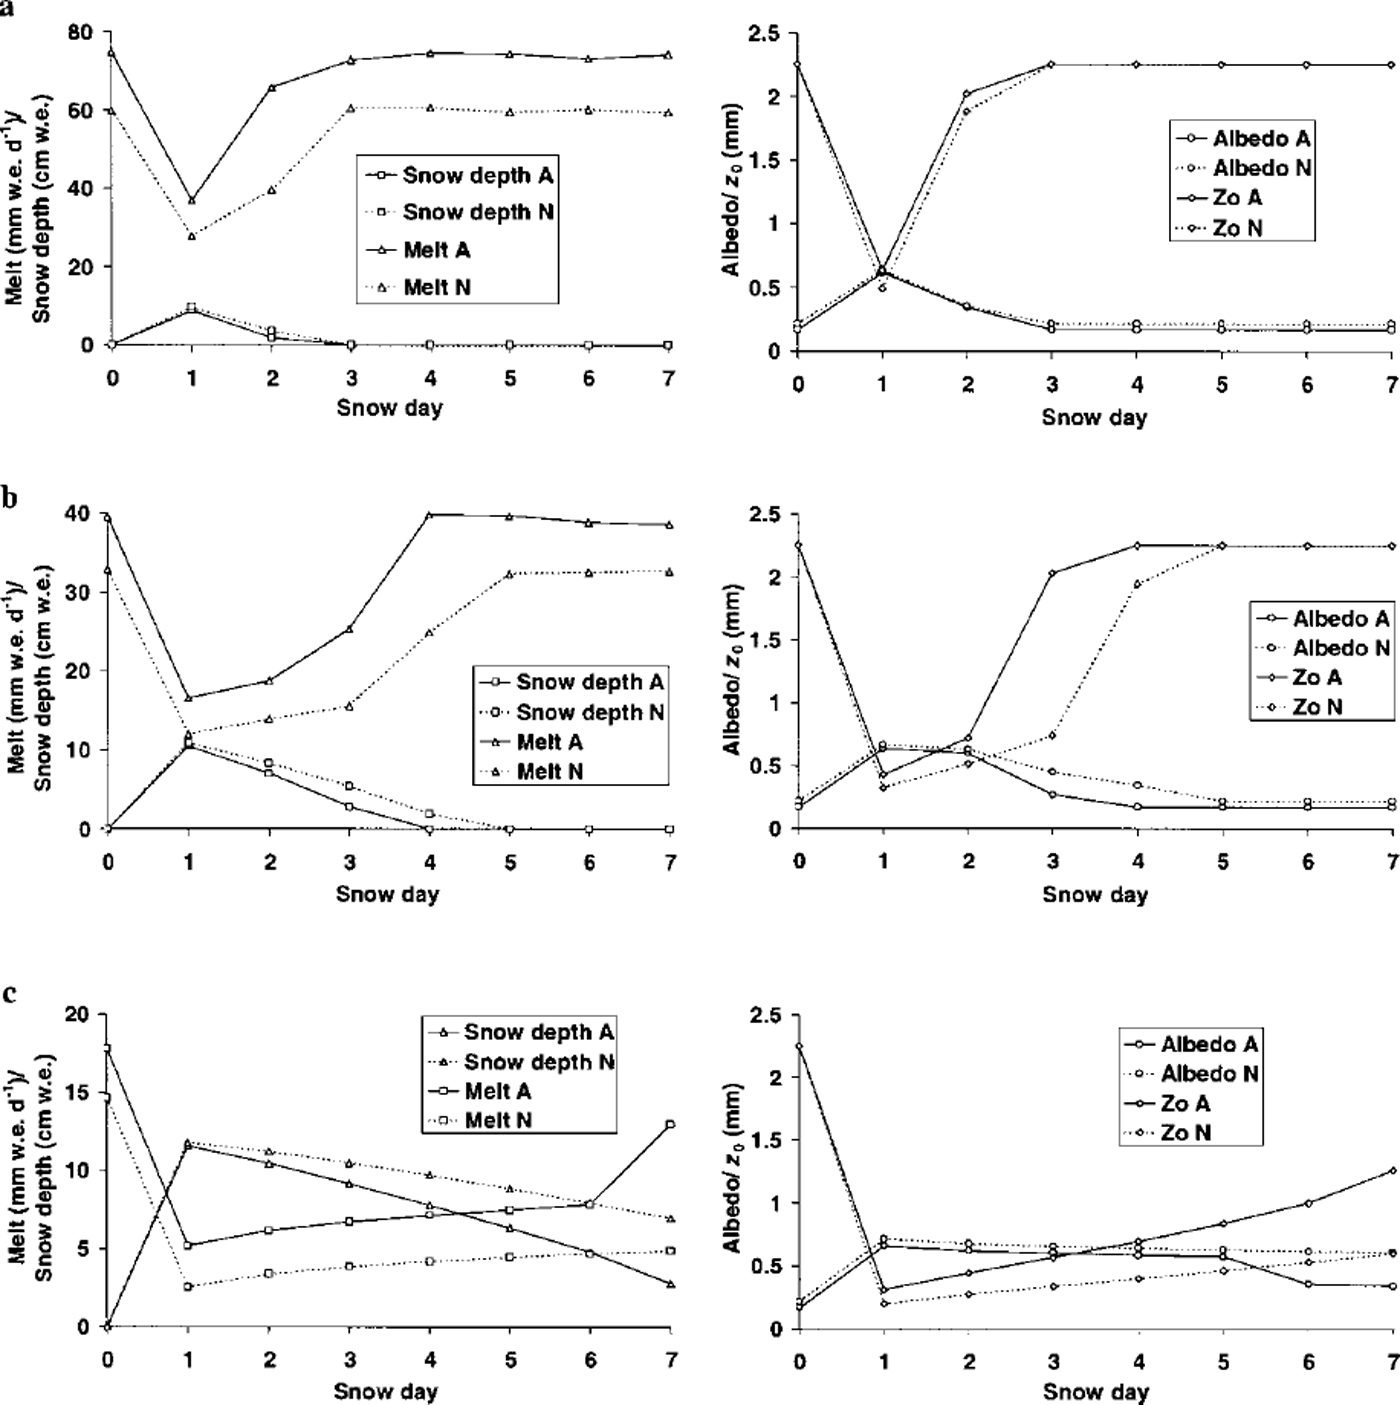
Fig. 8. Temporal variation of snow depth and surface melt rate (column 1) and albedo and aerodynamic roughness length (column 2) at stake A (2602 m a.s.l.) and stake N (2988 m a.s.l.) before and after a late-summer snowfall of initial depth 12 cm w.e. under (a) high-, (b) medium- and(c) low-energy weather types. In each case the snowfall occurred at 0001 h on snow day 1.
Whereas a increased to values comparable to the early ablation season, z0 did not reduce to early-season values (<0.1 mm) due to the influence of underlying ice-roughness elements. Consequently the net shortwave radiation and turbulent fluxes made similar-magnitude contributions to the melt rate immediately following the snowfall.
The impact of the snowfall on the surface energy fluxes was short-lived when energy input to the surface was high, and pre-snowfall values were resumed 3 days after the snowfall (Fig. 8a). Under medium-energy conditions the surface energy fluxes were affected by the snowfall for 3 days in the lower ablation area (stake A) and 4 days in the upper ablation area (stake N), but the melt rate climbed steadily in this period in response to decreasing snow a and increasing snow z0 (Fig. 8b). An important contrast occurred under low-energy conditions. Here snow remained lying in both upper and lower ablation areas throughout the 7 day period following the snowfall, and the melt rate was very slow to recover to its pre-snowfall level (Fig. 8c). Clearly, meteorological conditions following a summer snowfall event are of great importance in determining the length of time surface melt rates are suppressed. Under low-energy-input, i.e. cool and cloudy, conditions, the slow change in a and z0, due to sluggish metamorphism and melt of the snow cover, was instrumental in causing the snow cover to persist.
The contrast between energy fluxes in the lower and upper ablation areas following the snowfall was small under high- and medium-energy weather conditions, but under low-energy weather conditions the melt rates diverged with increasing time after the snowfall due to the more rapid changes in a and z0 in the lower ablation area (Fig. 8).
Seasonal trends in albedo, aerodynamic roughness length, meteorological conditions and energy fluxes during 1993 ablation season
The single most important event during the ablation season was the transition from snow to ice with the abeyance of the winter snowpack, which occurred at the end of July at stake H (Fig. 9). Thus, the highest values of the net shortwave, turbulent and melt energy fluxes occurred in the first 3 weeks of August, while a was low and z0 high, but prior to the decline in global radiation and temperature values with the onset of the accumulation season.

Fig. 9. Five-day means of (a) surface energy fluxes and (b) surface conditions at stake H (2877m a.s.l), and (c) meteorological conditions at the automatic weather station during the 1993 ablation season. S indicates the dates of the main summer snowfall events.
The decrease of σs in May and June was gradual compared with the rapid decrease which occurred with the final wastage of the winter snowpack in the second half of July (Fig. 9b). Snow z0 remained very low until mid-June, when a very rapid increase to ≥ 2 mm began (Fig. 9b). These surface factors controlled the temporal variation of the shortwave and turbulent fluxes, respectively. In particular, the turbulent fluxes were suppressed at values of ≤ lOmmd"1 until the second half of June (Fig. 9a).
The impact of summer snowfalls was very pronounced (Fig. 9). A heavy snowfall in mid-July had a particularly large and sustained impact on the energy balance, but the increases in a and decreases in z0 and surface energy fluxes resulting from snowfalls in mid-June, late August and early September were also very marked. It was also apparent that, as well as a decrease in temperature, these snowfall events were characterized by a large drop in global radiation values (Fig. 9c). The three lowest values of global radiation in Figure 9 each coincided with summer snowfall events, suggesting that the snowfalls occurred during periods of sustained cloud cover. This might be explained by particularly active weather fronts or intense cyclonic conditions. The combination of low global radiation and air temperatures could have prolonged the impact of summer snowfall events on the surface melt rate, based on the findings in the previous section.
Discussion and Conclusions
We have used a semi-distributed physically based energy model to examine the impact of variations in a and z0 on the surface energy balance of a small valley glacier over the course of an ablation season. Some key outcomes from the study are as follows:
-
1. With high-quality input data (accurate DTMs, local meteorological measurements) current energy-balance theoη enables the melt rate of snow and ice to be calculated accurately across a glacier and permits investigation of spatial and temporal patterns in the surface energy balance. However, some limitations on the transferability of this result might be that: (i) the energy balance was generally positive over the period and area considered in this study, so conduction of heat into the surface of the glacier was negligible; (ii) suitable parameterizations to calculate spatial and temporal variations in a and z0 were available and had been calibrated locally; and (iii) the energy balance was dominated by shortwave radiation receipts which can be monitored accurately with a pyranometer, knowledge of slope and aspect variations and an a parameterization scheme. At glaciers where turbulent and longwave fluxes play a greater role, measurement difficulties may lead to larger errors in surface melt calculations.
-
2. Accurate modelling of the up-glacier migration of the transient snowline is critical to accurate calculation of spatial patterns in, and the total volume of, surface melt. Changes in a and z0 which occur during the melt of the winter snowpack must be parameterized accurately to enable calculation both of temporal variations in the surface melt rate on the winter snowpack and of the changing position of the transient snowline during the ablation season. This is best achieved using parameterizations which are linked to physical changes in the snow (e.g. grain-size increases and ablation-hollow formation), and which are also responsive to the important changes in a and z0 which occur during summer snowfall events.
-
3. Summer snowfall events are of great importance to the summer energy balance and should be accounted for in melt models and calculations of the mass-balance response of glaciers to climate change. The persistence of the fresh snow cover and suppression of surface melt rates is greatly increased when (meteorological) energy inputs to the surface are low. Examination of meteorological data for the 1993 ablation season revealed that summer snowfall events were usually associated with periods of cool, cloudy conditions. This could, to some degree, offset the increase in glacier ablation caused by global warming, if trends towards increasing precipitation and cloudiness under climatic-change scenarios are realized (Reference Houghton, Meira Filho, Callander, Harris, Kattenberg and MaskellHoughton and others, 1996).
-
4. The representativeness of the findings should be tested at other sites. The importance of variation in the longwave radiation fluxes, which are estimated by the model, to the surface energy balance should be investigated, particularly at sites with a high incidence of cloud and mist. The applicability of the a and z0 parameterizations should be investigated at other sites and, if possible, extended to calculate variations of these properties on glacier ice.
Acknowledgements
This work was undertaken while B. W. Brock was in receipt of U.K. Natural Environment Research Council (NERG) studentship GT4/92/5/P; additional funding was provided by NERG grant GT3/8114, and the weather station was borrowed from the NERG equipment pool. The original energy-balance model was developed under NERG grant GR3/7004A. We are grateful to all members of the 1992–94 Arolla Glaciology Project, in particular B. Hubbard, M. Nielsen and the Cambridge University undergraduates who helped with the fieldwork. We also thank Grande Dixence SA, Y. Bams and P. and B. Bournissen for their logistical assistance. M.V. Anzevui kindly permitted us to camp at the field site. J. Ford is thanked for cartographical assistance with Figure 1. K. Steffen and two anonymous referees are thanked for their helpful comments which improved this paper.


