


Introduction
The objective of this study was to understand the glacier control on inflow in order to assess historic trends and future scenarios for the reservoir of a large powerplant in northern Norway. This was to be done by establishing a long-term mass-balance series for the glacier area (∼100 km2) in the catchment shown in Figure 1. Forty per cent of the catchment is glacier-covered, and the glacier has an important impact on the annual inflow from the catchment since it behaves like an unregulated reservoir. Thus, reconstruction of the glacier mass balance is important for understanding variation in inflow to the reservoir. Furthermore, to provide an appreciation of the future impact of the glacier on inflow, the mass balance for the next 50 years was modelled based on three suggested climate-change scenarios for the region.

Fig. 1. Svartisen ice cap.
The mass-balance series was reconstructed using three different methods: (a) the hydrological method; (b) correlation between meteorological observations of summer temperature and winter precipitation, and summer and winter balances; and (c) a precipitation-degree-day (PDD) model. The latter two models were used to construct mass-balance scenarios until 2050.
Background
Area description
Svartisen ice cap (Fig. 1) is located at 66–67° N, 13–15° E. The area is mountainous, with peaks at 1500–1800 ma.s.L, and includes one-third of the total glacierized area in northern Scandinavia. Svartisen ice cap comprises two major ice caps, Vestisen (221km2) to the west and Østisen (148 km2) to the east.
This work focuses on the part of the ice cap that drains to the hydropower reservoir Storglomvatn. The drainage boundaries have been established using topographical maps and radio-echo soundings of glacier-bed topography (Reference Kennett and ElvehoyKennett and Elvehoy, 1995).
Observations
Precipitation and temperature
The area is dominated by westerly winds, and a steep precipitation gradient is observed from the coast (annual total 1500–2000 mm) towards the interior (annual total ≤ 500 mm east of the ice cap).
The nearest meteorological station, Glomfjord, is at 20 m a.s.l. and –10 km from Storglomvatn (Fig. 1). We analyzed the data from this station and found mean annual figures for precipitation and temperature of 1992 mm and 5.08° C, respectively. Our linear trend analysis showed an increase in precipitation and temperature of +0.175% a"1 and +0.00175 °C a–1, respectively. The trend in temperature was influenced by very low figures during three of the first four years and very high figures during six of the last nine years of the period.
Discharge
High precipitation figures are manifested in the high discharge rates in the area. Generally, the annual discharge in the area is ≥ 0.1 m s–1 km–2, well above the national average of 0.036 ms–1 km–2 for the period 1930–60. Hydrological observations in the area were started in 1908. Observed discharge from the catchments Skarsvatn and Vassvatn and calculated inflow to Storglomvatn were used in this study. Skarsvatn is 40 km to the northeast and Vassvatn 50 km to the southwest of Storglomvatn.
Mass balance
Mass balance was observed for a prolonged period on three glaciers in or near the Storglomvatn catchment area: Engabreen (1970–98), Storglombreen (1985–88) and Trollbergdalsbreen (1970–75, 1990–94). Stakes and towers were used to measure accumulation and ablation of snow and ice at different elevations as described in Reference Østrem and BrugmanØstrem and Brugman (1991). The results are given in Reference KjøllmoenKjollmoen and others (1998).
Methods
Hydrological method
Glacier volume change can be estimated with the hydrological method (Reference RogstadRogstad, 1942) using inflow (or discharge) observations in the glaciated area and a glacier-free reference catchment area. The method assumes that the inflows of the catchment areas are proportional to each other if corrected for the glacier volume change. A period with known volume change, in this work derived from repeated mapping, was used to establish the scale factor between the inflow series. Annual volume balance A V was estimated from the annual inflow figures Q and Qief according to
Correlation between mass balance and meteorological observations
Accumulation is mainly due to winter precipitation, and ablation due to melting of snow and ice during summer, the latter being closely related to air temperature. A regression analysis between winter balance (accumulation) and total winter precipitation, and summer balance (ablation) and mean summer air temperature was used to determine whether data from a nearby meteorological station could be used to estimate the mass-balance terms (e.g. Reference LiestolLiestol, 1967; Reference Tvede, Wold and ReppTvede, 1979). Furthermore, the established regression models were used to estimate mass balance for the years without mass-balance observations.
PDD model
The glacier mass balance was estimated using a PDD model, in which precipitation is used as an index for accumulation, and degree-days for calculating ablation. Such models have been used in mass-balance modelling in the past (Reference BraithwaiteBraithwaite, 1985; Reference ReehReeh, 1991; Reference Laumann and ReehLaumann and Reeh, 1993), and the procedure is described by Reference Jόhannesson, Sigurdsson, Laumann and KennettJohannesson and others (1993). The model calculates precipitation, snow accumulation, snowmelt and refreezing as a function of altitude based on observed temperature and precipitation.
Uncertainty
Uncertainties in reconstructed mass-balance series arise from uncertainties in the observations used in the modelling and the model formulation and application. We addressed the matter of uncertainties and errors by comparing the results from the three methods and by comparing the model results with the observations.
The uncertainties in traditional mass-balance observations are associated with uncertainties in the specific snow accumulation and ablation at observation points and the conversion of the point values into spatially distributed variables. The accuracy of the annual specific net balance is believed to be ― 0 .2 m we. and of the volume change derived from repeated mapping ― 2 m if there is high contrast of the glacier surface in the photographs.
Uncertainties associated with the hydrological method are linked to discharge and lake-volume change observations, inflow calculations and the assumptions that the annual inflow in the two catchments responds in a proportional manner if glacier impact is eliminated and that the glacier does not change too much. Uncertainties in the P-T correlation and the PDD models are associated with meteorological observations (their representativity with regard to the conditions on the glacier and the observations themselves), the (backwards and forwards) extrapolation of the validity of statistical relationships established for the calibration time periods and area-elevation distributions.
Glacier Variations
Glacier area
Glacier area (and the changes thereof) was derived from digital maps from the 1890s (surveyed between 1895 and 1899), 1968 and 1985, and the drainage divides from radar observations in 1985 (Reference Kennett and ElvehoyKennett and Elvehoy, 1995).
Svartisen ice cap, including the glaciers draining to Storglomvatn, retreated during the first half of the 20th century (Reference TheakstoneTheakstone, 1965). Aerial photographs, maps and glacier-front observations suggest that most of the reduction in area took place between 1930 and the 1960s, mainly at lower elevations. During the past 30 years, the western outlets of Vestisen have advanced, while Trollbergdalsbreen and the large outlets from Østisen have retreated further. Table 1 lists the changes in areas as derived from the map.
Table 1. Area changes (km2 ) estimated from available maps
Glacier volume
The change in glacier volume between August 1968 and August 1985 (repeated mapping) was calculated using the difference in elevation between the two surface maps multiplied by the density of glacier ice (Fig. 2). Aggregate figures established for Trollbergdalsbreen and the different parts draining to Storglomvatn showed that those draining to Storglomvatn decreased in volume during this period. Østisen had the largest reduction in volume, a total of ≥ 0.31 × 10⁹m3 or a specific balance of –13.6 mw.e. Trollbergdalsbreen decreased by –12.2 mw.e. or –0.02 × 10⁹ m3 in volume. Vestisen had a small reduction, –2.6mw.e. or about 0.18 xl09m3 in volume. In total, the glaciers draining to Storglomvatn lost 0.58 × 10⁹ m3 more water than was retained.

Fig. 2. Volume change of glaciers draining to Storglomvatn and Trollbergdalsbreen, 25 August 1968 to 19 August 1985. The horizontal lines indicate the natural drainage area of Storglomvatn.
Mass balance
Figure 3 shows observed specific mass balances (winter, summer and net balance) at Engabreen, Storglombreen and Trollbergdalsbreen.

Fig. 3. Specific winter (upper), summer (bottom) and net balance (middle) for Engabreen (bars), 1970–98. Valuesfor Storglom- and Trollbergdalsbreen are superimposed.
The observations at Engabreen provide a 29 year long reference series for the area. This series was used to estimate winter, summer and net mass balances for the same period at Storglom- and Trollbergdalsbreen using regression analysis to establish relationships between the observations at Engabreen and the two other glaciers. Coefficients of determination for the linear correlation of winter, summer and net balances were all >0.94, using comparison periods of 4 and 10 years for Storglom- and Trollbergdalsbreen, respectively. The estimated cumulative mass balances are shown in Figure 4. Enga-, Storglom- and Trollbergdalsbreen are located along a west-east profile (see Fig. 1), with Engabreen located near the coast and Trollbergdalsbreen 30 km inland. The results show that the mean annual winter balance decreases eastwards from +3.1mw.e. at Engabreen to +2.4mw.e. at Trollbergdalsbreen. The mean annual summer balance increased eastwards from –2.4 mw.e. at Engabreen to –2.9 mw.e. at Trollbergdalsbreen. The higher summer balance figures at Trollbergdalsbreen are explained by the fact that a large area of Engabreen is located at higher elevations thanTrollbergdalsbreen.

Fig. 4. Measured and computed cumulative specific balance for three glaciers along a west-east profile along the northern part ofS vartisen, 1970–98. For years without direct balance measurements, estimated values are used.
The net balance of Storglombreen was derived from change in glacier surface elevation between the mappings in 1968 and 1985, and from traditional mass-balance observations and correlation of these with the series from Engabreen. The map comparison between 1968 and 1985 showed that the area of Storglombreen was ― 6 2 km2 (i.e. there was no change in area) and a specific mass balance of –2.3 mw.e. The specific balance calculated by map comparison represented a total figure that could be compared to traditional observations from 1969 (as the map of 1968 represents the surface at the beginning of the mass-balance year 1968/69) to 1985. The mass balance estimated from traditional observations and the correlation with the Engabreen data for the period 1970–85 suggested a specific change of +1.5 m w.e. This estimate did not include the mass-balance year 1968/69, which gave a specific balance of ― 2 mw.e. according to the models. Combining mass-balance observations for the period 1970–85 with estimated balance for the year 1968/69, a total specific balance of –0.5 mw.e. was obtained for the period. Thus the difference in specific balance as estimated by two independent methods was 1.8 mw.e. over 17 years.
Historic Reconstruction
Model calibrations
Hydrological method
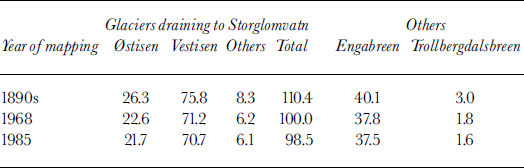
The inflow to Storglomvatn was calculated using observed discharge from the lake and by compensating for changes in the water level of the regulated reservoir and a tunnel transfer which extended the catchment in 1955. Glacier volume change between 1968 and 1985 was derived from repeated mapping. The ratios between the glacier-corrected inflow series for Storglomvatn and the (nearly) glacier-free reference basins Skarsvatn and Vassvatn were 4.5 and 11.1, respectively.
Figure 5 shows the net balance for the period 1931–89 calculated according to the hydrological method using Skarsvatn and Vassvatn. As seen in Figure 5, the reference catchments gave different results. The balance between 1931 and 1989 totalled ― 8 × 10⁹ m3 using Skarsvatn and ∼2.3 × 10⁹m3 using Vassvatn. The estimates differed in particular during the periods 1932–41 and 1961–72. Climatic shifts or changes in the hydrological regimes in the region may explain these differences. Furthermore, as the hydrological method depends on inflow amounts, errors in discharge observations could introduce similar effects. The results for the 1960s using Vassvatn gave a substantial decrease in glacier mass, while use of Skarsvatn showed the opposite. As Vassvatn has both a very stable profile and is in a programme with regular observation, and there was no major climatic shift in the period, the Vassvatn observations are believed to be more reliable.
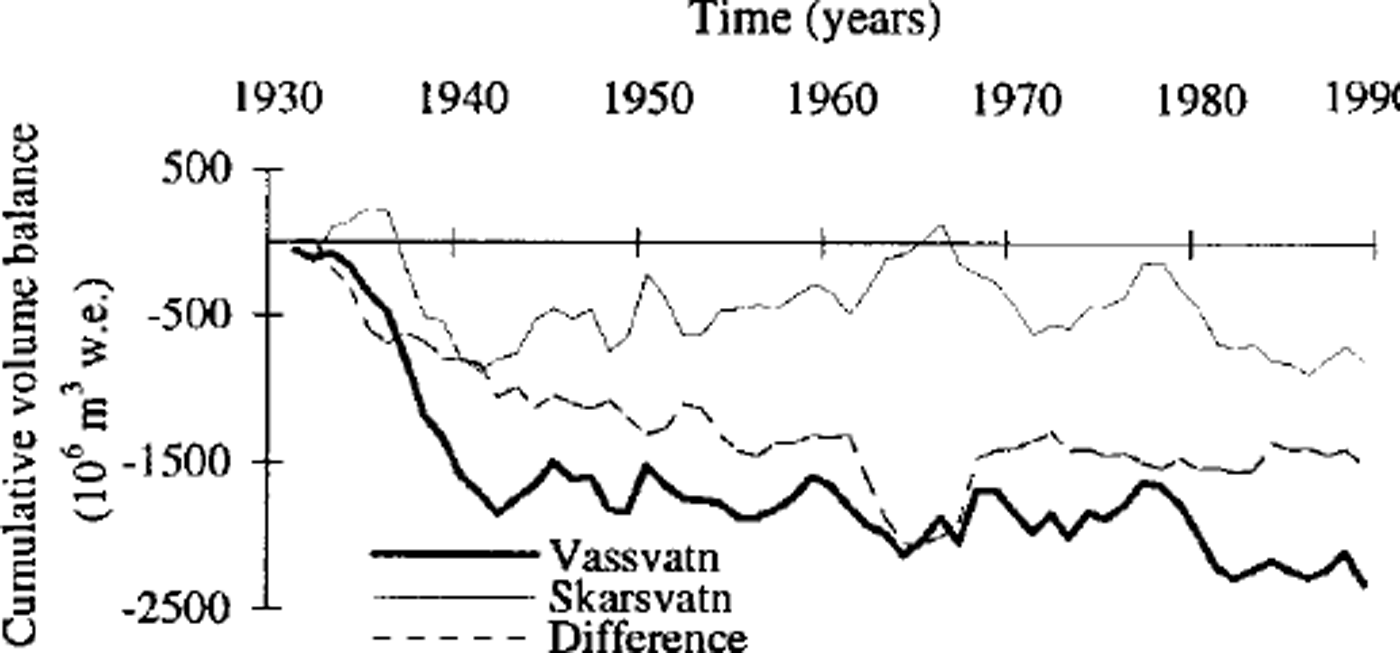
Fig. 5. Cumulative volume balance variations, 1931–89, calculated using the hydrological method and Skarsvatn and Vassvatn as reference catchments.
P-Tcorrelation model
Total winter precipitation (September-May) and average summer temperature (June-September) were calculated for each year from 1917 to 1998 at Glomfjord (Fig. 6). Trend analysis showed an increase in winter precipitation of 2.5 mm a"1 (0.15% a–1) and a decrease in summer temperatures of 0.0036°C a–1. The decadal averages showed that the winter precipitation was highest in the 1990s and lowest in the 1950s. The average summer temperature was highest in the 1930s and lowest in the 1970s and 1980s.

Fig. 6. Winter precipitation (September-May total) and summer temperature (June-September mean) observed at the meteorological station Glomfjord. Decadal averages and linear trends are superimposed.
Linear regression was carried out using winter (summer) balance as the dependent variable, and winter precipitation (summer temperature) as the independent variable. The observations were assumed to be normally distributed and complete. To determine whether these assumptions were correct, the meteorological data during the calibration periods (the years with mass-balance observations on more than one glacier) and during the period 1916–98 were compared. The comparison showed that variations in temperature and precipitation were well represented (for the observation period) at Engabreen, years with low summer temperature were not represented for Trollbergdalsbreen, and years with high winter precipitation or low summer temperature were not well represented for Storglombreen. The latter series has only 4 years of measurements.
Furthermore, the data were assessed by expressing winter (summer) balance as a linear function of winter precipitation (summer temperature) using linear regression and simultaneous observations. The regression equations were used to estimate the mass balance for Engabreen for the period 1970–98 for comparison with the observed data. Large deviations between observed and estimated mass balance would suggest that the observations are incomplete. A high correlation was found for both winter and summer balance using the observation period for Trollbergdalsbreen. The observation period for Storglombreen showed that the estimated winter balance was in good agreement with observations and that the summer balance was overestimated compared to observations.
Linear regression analysis was carried out to establish the relationship between winter (summer) balance and winter precipitation (summer temperature). The winter balance was well correlated with winter precipitation (τ2 ≥ 0.8), while a lower correlation was found for summer balance (τ2 ≥ 0.3), in particular at Trollbergdalsbreen. This suggested that temperature alone does not describe ablation as well as winter precipitation describes accumulation.
A comparison of modelled cumulative net balance from 1968 to 1985 with that from repeated mapping of Storglombreen indicated that the modelled net balance was too high. This agreed with the observation that the summer balance model for Engabreen based on a period of 4 years overestimated the summer balance in warm summers as compared to a model based on all 29 years. Thus, the summer balance function for Storglombreen was modified to correspond with the map-derived volume change.
The modelled specific balances for Storglom- and Trollbergdalsbreen were considered representative for the western and eastern parts of the glacier area within the Storglomvatn catchment. The western part comprises the northern part of Vestisen, and the eastern part comprises the northern part of Østisen and some small valley glaciers further north. The east-west division was applied because of the regional trend of increasing continentality from west to east, and the differences seen in the annual mass-balance measurements (Fig. 3) and in the map-derived volume changes (Fig. 2).
The glacier area and hypsometry are constantly changing to compensate for changes in mass balance. To derive annual volume balance which accounts for changes in glacier area, the glacier area was calculated for each year between 1900 and 1998 by a linear change between years with known areas (1890s, 1968 and 1985) or assumed areas (1930 and 1998). Furthermore, as changes in area were concentrated in the lower part of the glacier where melting is dominant, the change had a greater impact on summer than the winter volume balance. To incorporate this effect, changing area was used only when calculating summer volume balance.
Figure 7 shows cumulative volume balance calculated according to four different procedures: (a) using the initial regression equations, (b) using the modified summer balance equation for Storglombreen, (c) applying changing area for both winter and summer balance, and (d) applying changing area for summer balance only. Procedure c gave slightly higher figures than procedures a and b, especially in the late 1930s and 1940s. Procedure d gave significantly higher negative values between 1917 and the 1950s than procedures b and c. The difference between the graphs in Figure 7 indicates the uncertainty of the results. Although the eastern area is much larger (71 vs 29 km2), the volume contributions from the western and eastern parts are almost identical, due to a lower negative net balance for the western part of the glacier basin.
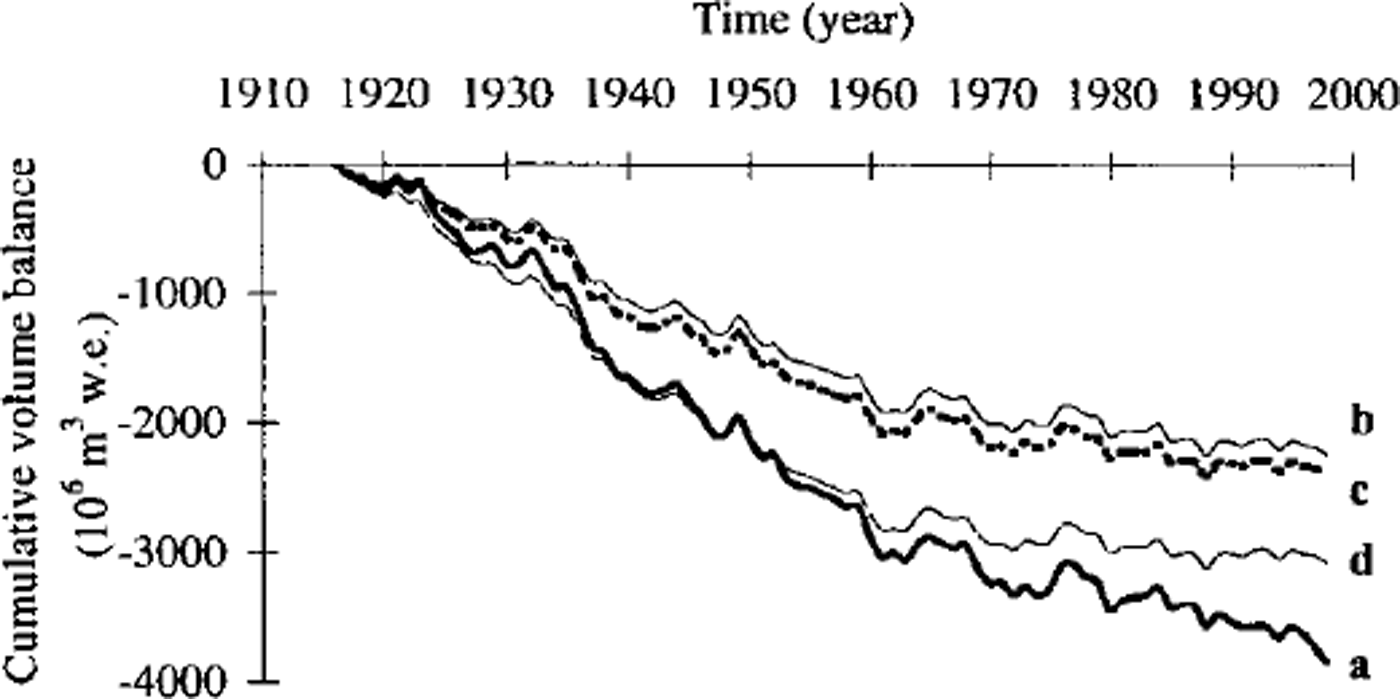
Fig. 7. Cumulative volume balance for the glaciers draining to Storglomvatn calculated according to four procedures: (a) using the initial regression equations, (b) using the modified summer balance equation for Storglombreen, (c) applying changing area for both winter and summer balance, and (d) applying changing area for summer balance only.
PDD model
The PDD model was calibrated for Enga-, Storglom- and Trollbergdalsbreen to investigate the performance of the model on an annual basis. The model was then recalibrated using the mass balance calculated from the maps from 1968 and 1985.
The mass-balance observations, volume-change estimates from repeated mapping and implied correlation of mass-balance observations all indicated a decreasing trend in mass balance from west to east. The model calibrated for Storglombreen was used to model the net balance of the western part, and the Trollbergdalsbreen calibration was used to model the eastern part. The model did not account for changes in glacier area, but instead used the areas derived from the 1985 map.
Reconstructed mass-balance series using three different methods, 1931–89
Annual volume balance was calculated for the glacier basin draining to Storglomvatn using the three different methods from 1931 to 1989, as this is the time period for which there were sufficient data for the hydrological method to be used. Figure 8 shows the cumulative figures produced by the three methods.
Fig. 8. Cumulative volume balance of glacier basin draining to Storglomvatn calculated with the three different methods (the hydrological method, the P-Tcorrelation model and the PDD model MBT) for the period 1931–89.
The hydrological method gave a drastic reduction in mass during the period 1933–41. The reduction is almost twice that seen using the other two methods. After 1940, the annual volume balance fluctuated around a near steady state until 1980 according to the hydrological method. After 1980, a further reduction took place. The P–T6 Corτεlσtion and PDD models showed a rapid decrease between 1932 and 1940, followed by a slightly slower decrease until 1962. After 1963 the mass continued to decrease, but at a much lower rate.
The glacier variations are shown as mean net balance for normal periods of 10 and 30 years in Figure 9. All methods showed a decrease in glacier mass throughout the century (from 1917). The decrease was highest during the 1930s (∼–90×106m3a–1) , but also significant during the 1950s (∼–70×106m3a–1). During the 1940s, 1970s and 1980s, the accumulation and ablation were almost in balance.
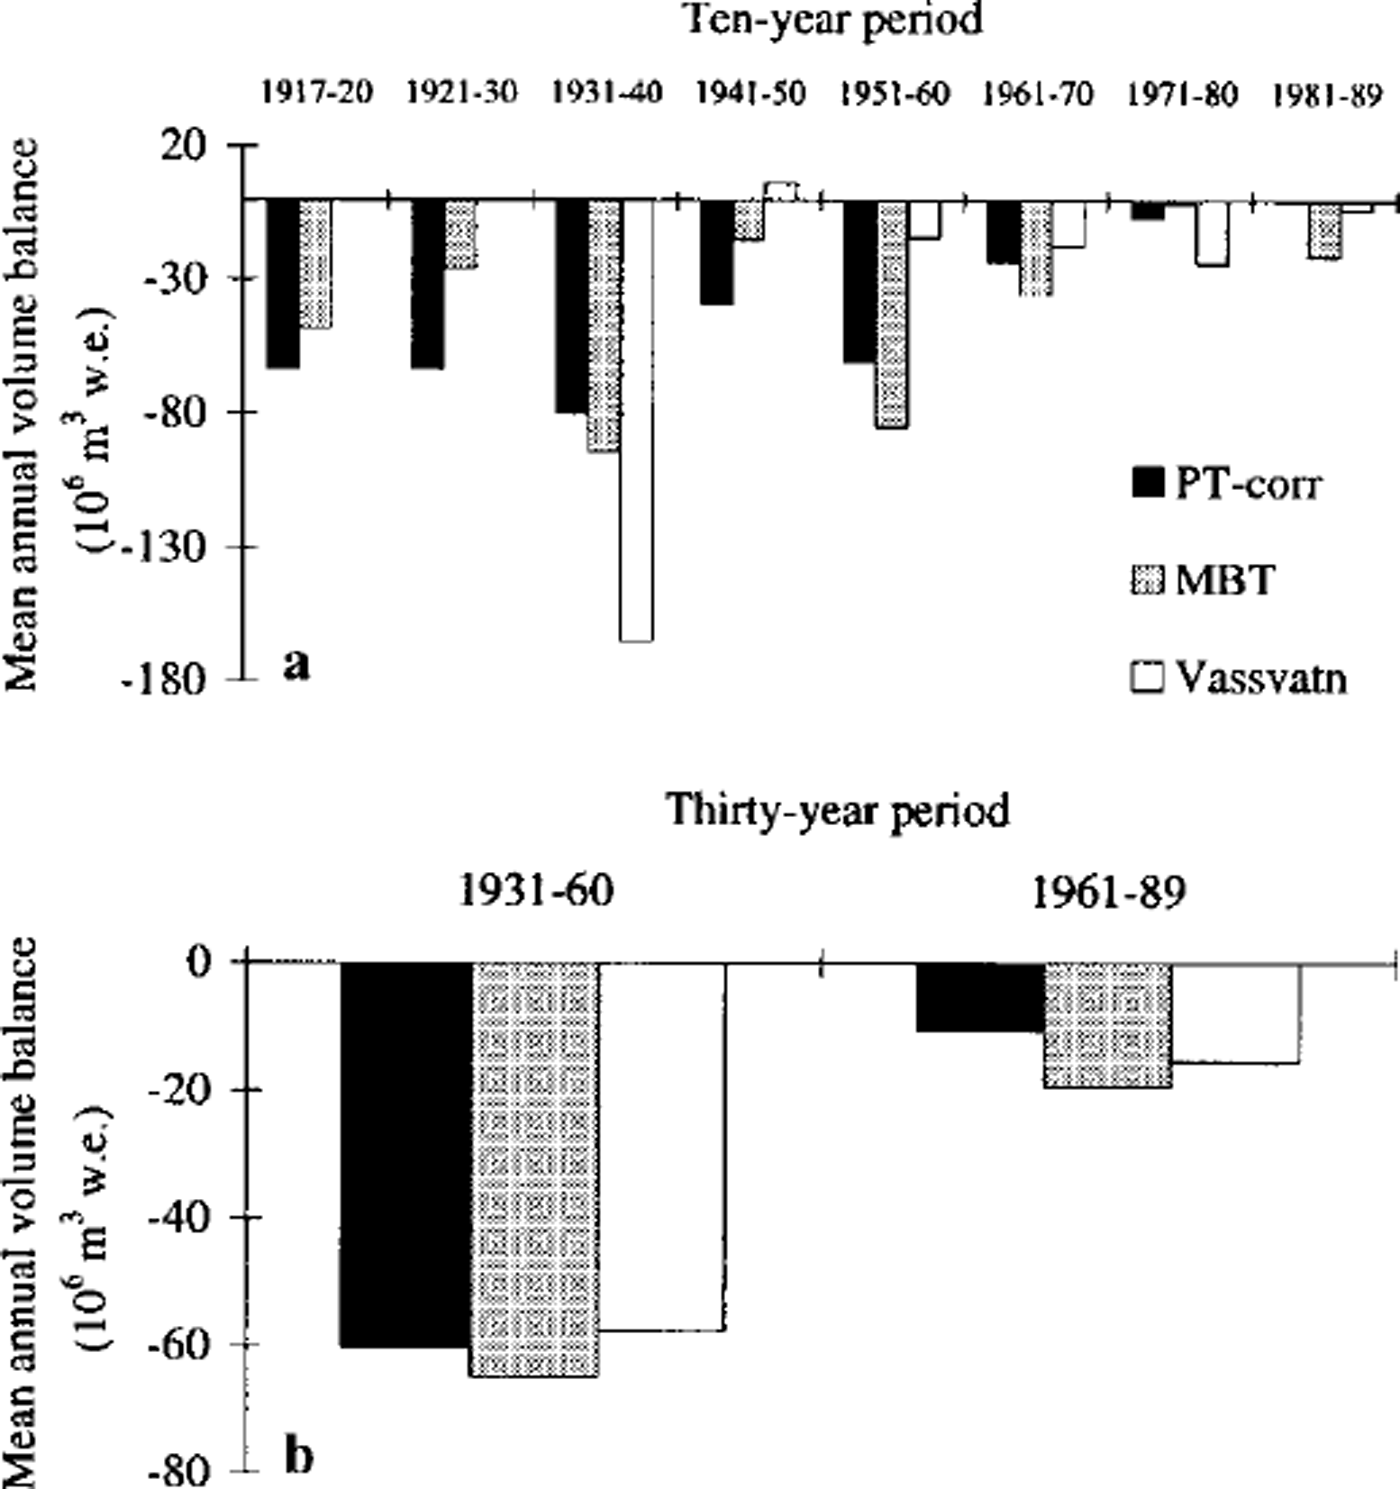
Fig. 9. Average annual volume balance of glacier basin draining to Storglomvatn in normal periods of (a) 10years and (b) 30 years.
Reconstructed mass-balance series, 1917–95
Annual volume balance was modelled for the period 1917–98 using the P-T correlation model. The results are shown in Figure 10, superimposed by graphs of a linear trend and Gaussian filter with bandwidths of 9 and 27 years. The linear trend analysis showed a significant positive trend corresponding to an increase of 1.1 × 10⁶ m3 a–1 . A filter with a 27 year bandwidth shows the low-frequency variation in the mass balance, which may be summarized as high negative balances in the period 1920–50, followed by a period of increasing balance. The annual volume balance appeared to be approaching zero, which suggests that the glacier is in balance with the present climate.
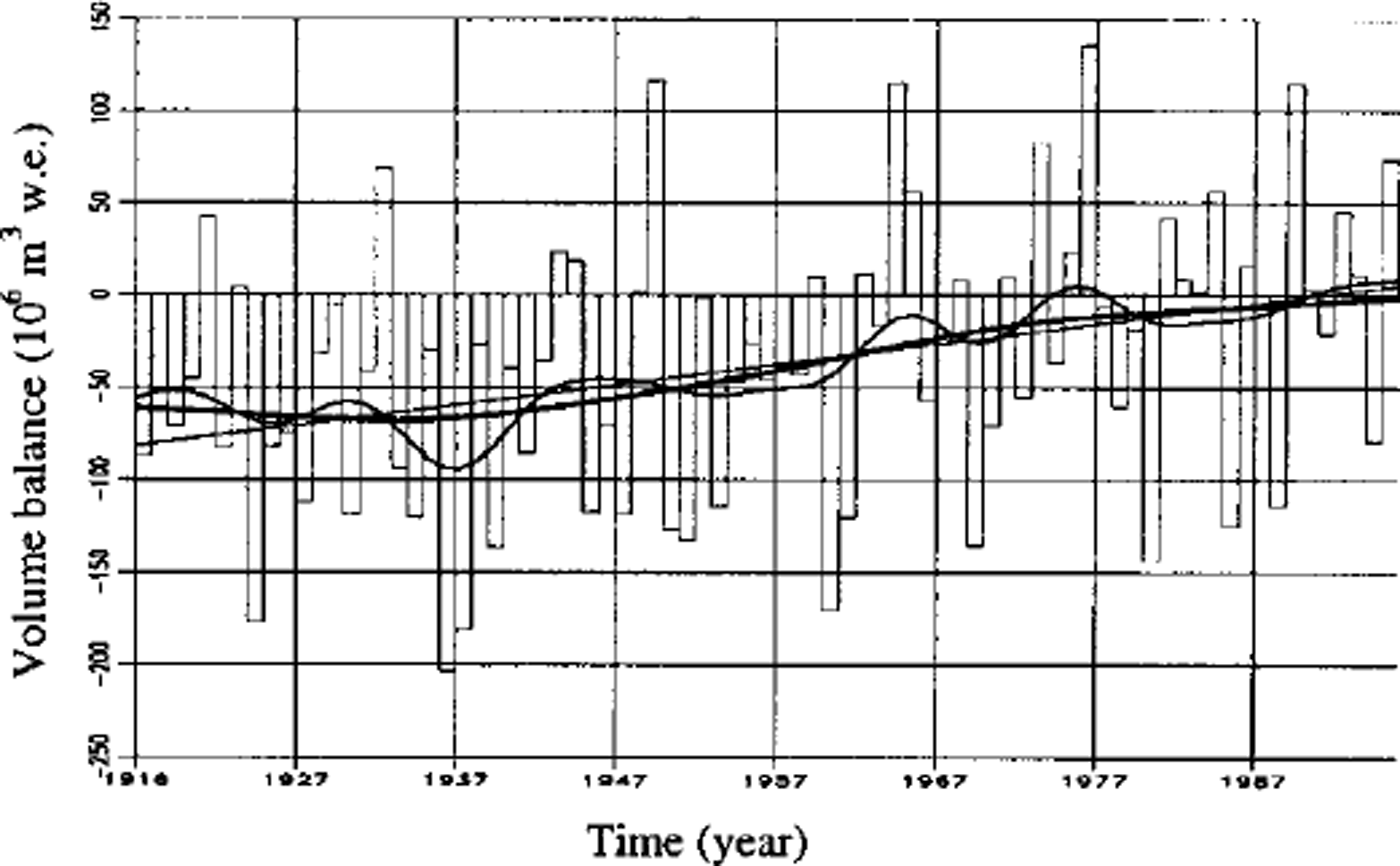
Fig. 10. Annual volume balance of glacier basin draining to Storglomvatn, as modelled with the P-Tcorrelation model for the period 1917–95 (bars). Superimposed are a linear trend line (thin line), and Gaussian-filtered balance using bandwidths of 9years (line of medium thickness) and 27years (thick line).
Future Scenarios
A study conducted by Reference SæltunSæltun and others (1998) was considered to present the most recent climate-change scenario for the region. The study compares the results from globalchange research carried out using a variety of methods to establish climate-change scenarios for the region. Scenario 3 inTable 3 is established specifically for the region (Nordland).
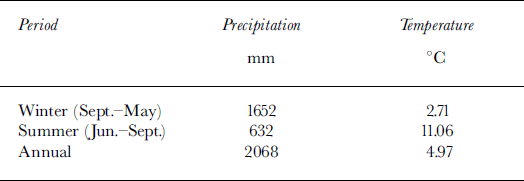
In addition to the scenarios presented by Reference SæltunSæltun and others (1998), two other possible outcomes were tested. One was a no-change scenario (temperature and precipitation values considered to continue to be at the 1961–90 average), and the other was a scenario where the climate change equals the linear trends observed from 1917 until the present (corresponding to scenarios 1 and 2 in Table 3). The mean values for annual and seasonal temperature and precipitation from 1961 to 1990 are listed inTable 2.
Table 2. Mean values for annual and seasonal temperature and precipitation, 1961–90, at Glomfiord
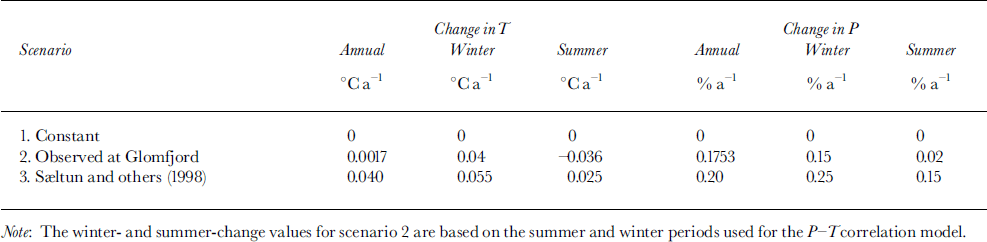
Table 3. Climate-change scenarios tested for the study area
Climate-change scenarios were available for air temperature and precipitation. Only the two mass-balance models using these two input variables could be used to establish mass-balance scenarios, so the hydrological method was not used in this exercise.
The results from the simulations of future changes in cumulative volume balance until the year 2050 are shown in Figure 11. Changes in air temperature and precipitation were imposed on the meteorological observations, and both the P––T–corrεlσtion and the PDD models were used to calculate the responses in mass balance.
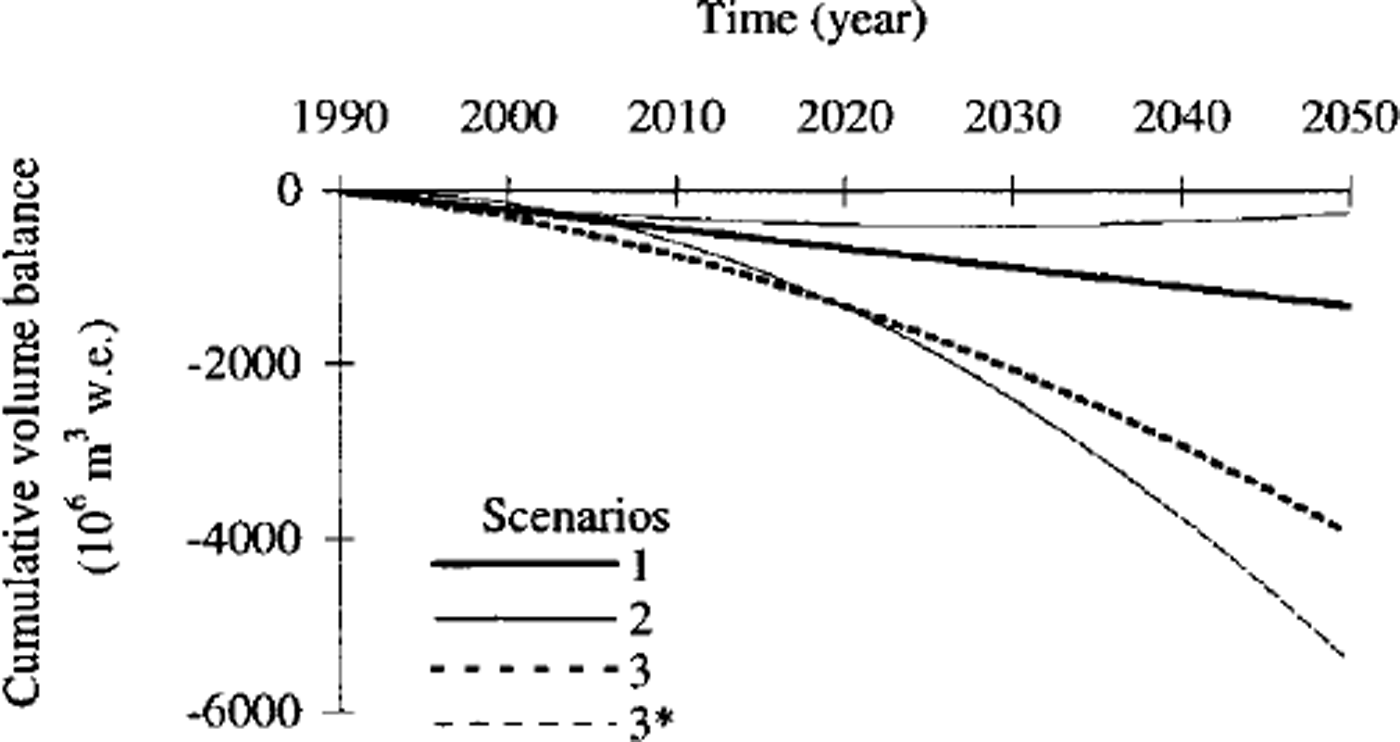
Fig. 11. Scenarios of cumulative volume balance given three climatic-change scenarios. Scenario 1 has constant precipitation and temperature, scenario 2 uses the observed linear trends at Glomfiord, and scenario 3 is from Sdtun and others (1998), which suggests an annual change in temperature of +0.040°C and m precipitation of+0.20%. All results are produced using the P-T correlation model, except scenario 3* for which the PDD model was used.
All scenarios indicated that the glacier will lose mass during the next 60 years. However, the magnitude of the possible decrease varied from 5.5 × 10⁹ m3 to close to zero. Scenario 3, which gave the largest loss in glacier volume, was an upper estimate, as a subsequent reduction in glacier area would reduce the volumes (possibly by 5–15%).
Conclusions
In this study all available observations of mass balance, area and volume change of the glacier basin draining to Storglomvatn were compiled and analyzed in order to provide calibration datasets for three different methods of estimating the annual volume balance. The three methods were the hydrological method, a model of correlation between meteorological and mass-balance observations (the P-T correlation model) and a PDD model.
The mass-balance series for the period 1931–89 was reconstructed using the three methods. All methods yielded a large reduction in mass in the 1930s. After 1940 the balance according to the hydrological method fluctuated near steady state until 1980, after which a further reduction took place. The / P–T corτεlσtion and PDD models showed a decrease until 1962 (although at a slightly lower rate than in the 1930s) and a continued decrease after 1963, but at a much lower rate.
Linear trend analysis of the annual volume balance series from 1917 to 1995 showed a significant positive trend corresponding to an increase of 1.1 × 10⁶ m3 a–1. Gaussian filtering of this series showed low-frequency variations, which may be summarized as very negative balances between 1920 and 1950 followed by a period of increasing balance that was approaching zero.
Three future climate-change scenarios were used as input to the mass-balance models. All of these indicated that the glacier will lose mass during the next 60 years. However, the magnitude of the suggested decrease in mass varied between 5.5 × 10 9m3 and close to zero.
Acknowledgements
The work was conducted under a contract with Eastern Norge Svartisen AS and Chase Manhattan International Ltd. T. Johannesson kindly provided the computer code for the PDD model. The contributions from the referees P. Jansson and F. Pattyn, and the editor H. Gudmundsson significantly improved the manuscript.


