


1. Introduction
Snow depth on sea ice plays a critical role in the heat exchange between the ocean and atmosphere (see, e.g., massom and others, 2001, for an overview). furthermore, a heavy snow load on the relatively thin southern ocean sea-ice cover submerges the ice floes below sea level, causing snow-to-ice conversion, which results effectively in an increase of sea-ice thickness and a decrease in snow depth. snowfall is also an important freshwater source into the weakly stratified ocean. snow-depth on sea-ice observations can be used as an indirect measure of solid precipitation. variations in snow cover also modify the physical behavior of the sea-ice cover (fichefet and morales maqueda, 1999; wu and others, 1999; powell and others, 2005). genthon and others (1998) compared the intra-annual and regional variability of snowfall from models and observations and discussed the complex variability of snowfall, emphasizing the need for reliable observations. the means to monitor snow depth becomes even more important as models project an increase in precipitation associated with increased temperatures over the southern ocean (bromwich and robasky, 1993;watterson and dix, 2003; trenberth and shea, 2005).
In this paper, we use snow-depth on sea-ice estimates from satellite passive microwave data to investigate its temporal and regional variability and its connection to variations in the sea-ice cover, and discuss these results in the context of cyclone density.
2. Data
Daily maps of snow depth on sea ice are derived from satellite passive microwave special sensor microwave imager (SSM/I) data (markus and cavalieri, 1998) for the period 1992–2003. in order to extract the snow signal from the SSM/I radiances, the contribution of the signal from variations in sea-ice concentration must be excluded, which is done using enhanced nasa-team algorithm (nt2) sea-ice concentration estimates (markus and cavalieri, 2000). remaining variations in SSM/I brightness temperatures then depend mainly on variations in the snow cover. snow acts primarily as a scatterer of microwave radiation. therefore, the deeper the snow the more scattering. the scattering efficiency is frequency-dependent so that a combination of different frequencies allows the retrieval of snow depth. nevertheless, in addition to the snow depth itself several other snow properties can affect the scattering and thus the retrieval quality. these are mainly snow grain size, snow density, snow layering and snow wetness. the snow depth of wet snow cannot be retrieved, and in the algorithm temporal information is used to flag wet snow. currently, algorithm coefficients are constant, but comparisons of monthly SSM/I-derived and in situ snow-depth distributions for different regions and different seasons have shown that the algorithm is adequate at least on larger scales, where variations in snow physical properties likely average out. comparisons of in situ snow-depth distributions with distributions derived from SSM/I data showed good agreement on regional and monthly scales. average in situ snow depths varied from about 6 to 26 cm, and the correlation coefficient between in situ and SSM/I snow depths was about 0.8 (with one possible outlier removed, it increased to 0.94). there was a negative bias of 3.5 cm and a precision of 3.9 cm (markus and cavalieri, 1998). more recently, in situ snow depths were compared with airborne radiometer measurements as part of the advanced microwave scanning radiometer–earth observing system (AMSR-E) arctic validation campaign (cavalieri and others, 2006). initial comparison shows a good correlation (∽0.7), although the results suggest that different algorithm coefficients may be needed for rough sea ice (markus and others, 2006). in this study, we therefore generate and use monthly-averaged snow-depth on sea-ice maps.
figure 1 shows the minimum, maximum and mean snow depth on a pixel-by-pixel basis for september, the month of maximum sea-ice extent. generally, the deepest snow cover is observed in the weddell sea and in the bellingshausen, amundsen and ross seas. the ‘tongue’ of deeper snow in the weddell sea corresponds to an area of second-year (and thus older) ice, which is drifting eastwards following the weddell gyre. the west antarctic area (bellingshausen, amundsen and ross seas) is known for frequent cyclone activity and thus higher snowfall rates. areas of frequent coastal polynyas, such as along the ronne and ross ice shelves as well as along the wilkes land coast, show low snow depth because of the presence of new ice.

Fig. 1. September SSM/I-derived snow depth for the years 1987–2003. From left to right: pixel-based minimum snow depth; pixel-based maximum snow depth; average snow depth; and standard deviation multiplied by 5.
3. Snow Variability
figure 2 shows the monthly-averaged snow depth for the entire southern ocean. the average snow depth is highest during the months of minimum sea-ice cover. during these months, only thicker, older ice (with presumably deeper snow) has survived the summer’s melt. the increase in sea ice during austral fall leads to large areas of new ice, which results in a decrease of average snow depth. once the sea-ice growth slows down, the average snow depth increases until the onset of melt (about october) and the subsequent disintegration of the sea-ice cover.
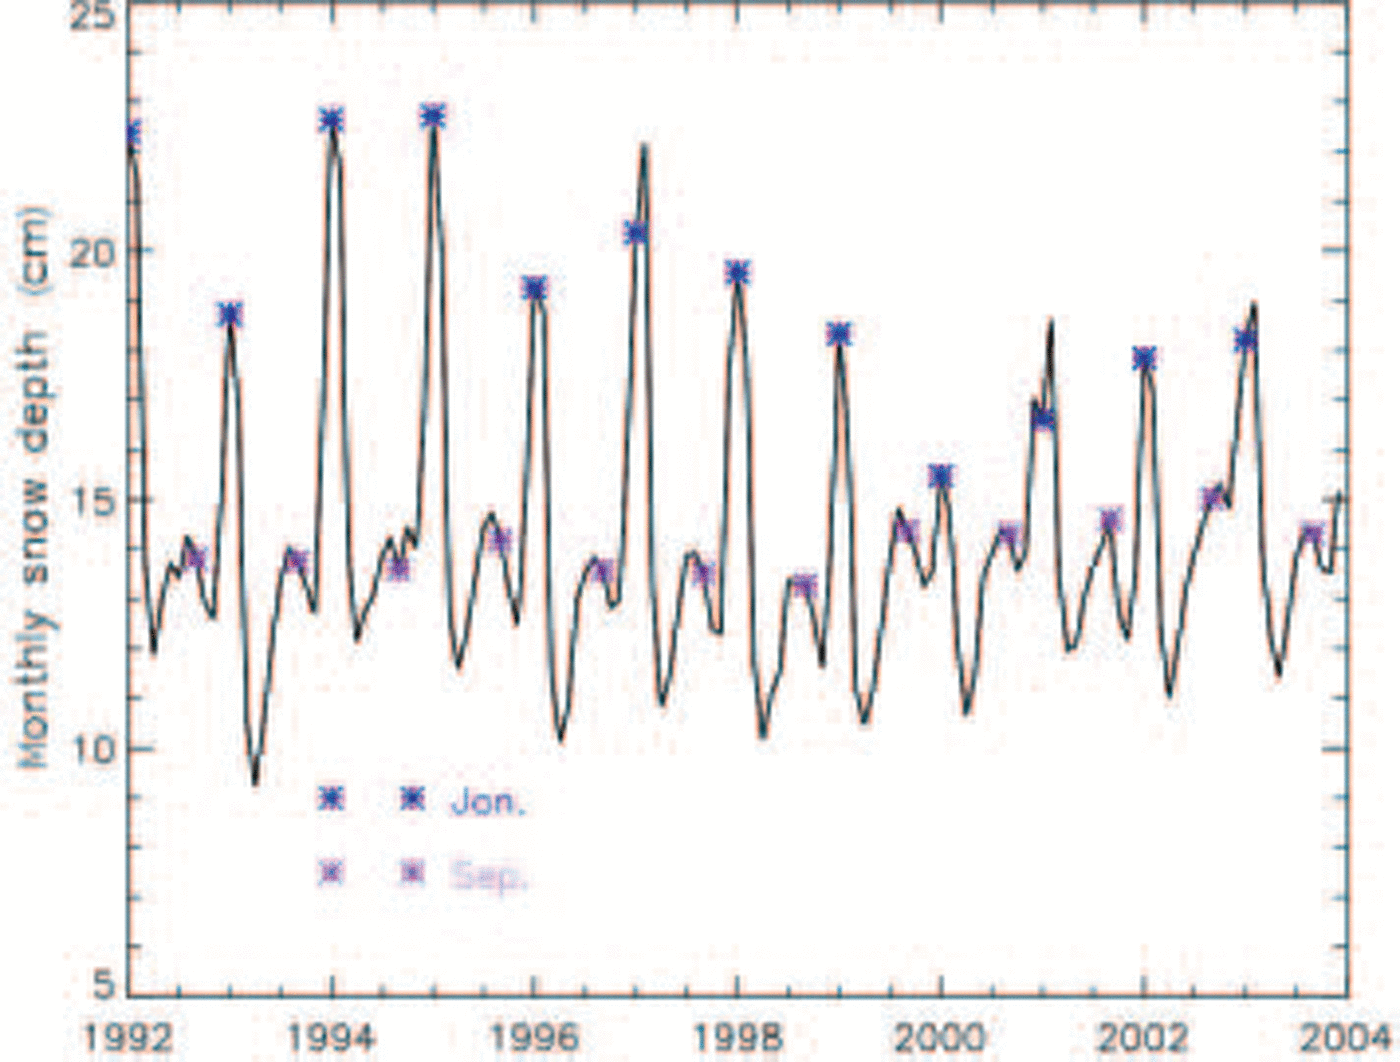
Fig. 2. Monthly average snow depth for the entire Southern Ocean. Blue and purple stars indicate January and September values, respectively.
Although the snow-depth data show a significant amount of interannual variability, part of this variability seems to be connected to the variability of the sea-ice cover. in figure 3, the september snow depth is plotted vs the september sea-ice area (also derived from SSM/I data; markus and cavalieri, 2000). there is a surprisingly clear linear relationship between snow depth and sea-ice area. years with greater ice areas have, on average, lower snow depth and vice versa. there are a couple of possible interpretations for this correlation: (a) years with greater ice extent have likely greater areas of newer, thinner ice with presumably less snow, which will reduce the average snow depth; (b) there is an atmospheric connection between years of deeper snow (increased precipitation) and reduced sea-ice cover. the figure furthermore suggests greater snow depth in recent years.

Fig. 3. September snow depth vs September sea-ice area.
In order to analyze this in more detail and to investigate regional differences, anomalies of sea-ice area and snow depth were computed around the southern ocean in 1˚ longitudinal segments relative to the 12 year mean (figs 4 and 5, respectively). positive anomalies are shaded in light gray, and negative anomalies in dark gray. the spikes around 300˚, particularly in figure 4, are mainly a result of the antarctic peninsula. north of the peninsula the number of ice-covered pixels is much smaller so that relatively small changes in the sea-ice cover translate into large anomalies. these figures do not show an immediate regional connection between the sea ice and the snow depth. it is interesting, though, that the snow-cover anomalies differ between the first 6 and the second 6 years. particularly beginning with 1999, there appear to be greater positive anomalies which additionally show a rotational pattern with consecutive maxima. there are consecutive maxima around 45˚, 120˚, 190˚, ˚8 and 360˚ for the years 1999 through 2003, respectively. this partial eastward propagation of maximum snow depths may be related to the antarctic circumpolar wave.

Fig. 4. Polarplots of normalized September sea-ice area anomalies around the Southern Ocean in 1˚ longitude steps. Positive anomalies (>1) are shaded in light gray, negative anomalies (<1) in dark gray. A circle of radius 1 represents the mean sea-ice area.
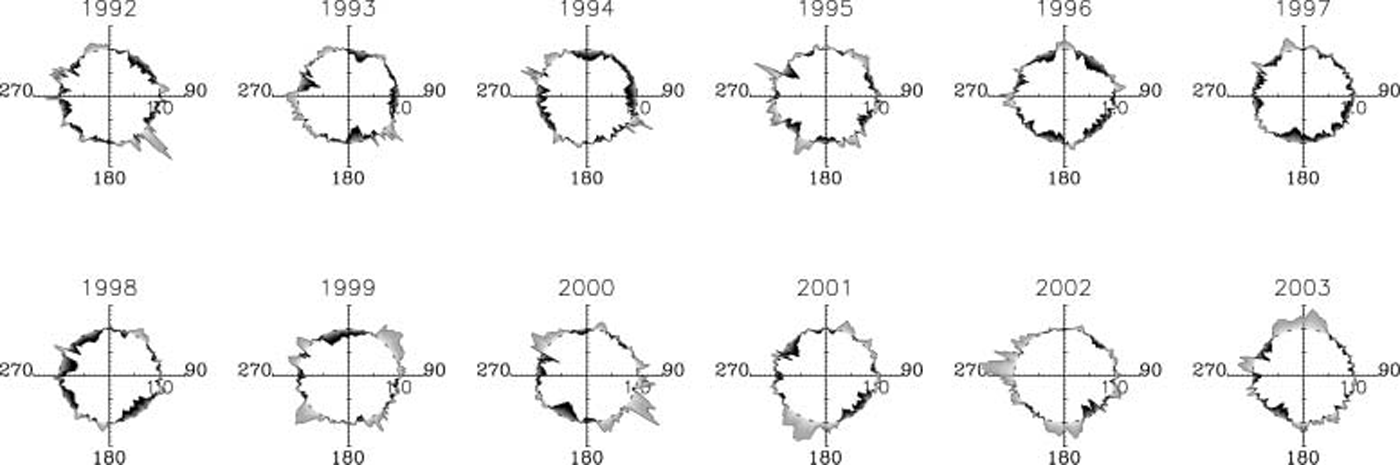
Fig. 5. Polarplots of normalized September snow-depth anomalies around the Southern Ocean in 1˚ longitude steps. Positive anomalies (>1) are shaded in light gray, negative anomalies (<1) in dark gray. A circle of radius 1 represents the mean snow depth.
Next, we examine the 12 year means and standard deviations of the normalized snow depth obtained by dividing the snow depth by its corresponding sea-ice area for each of five sectors as defined by gloersen and others (1992) (table 1). the standard deviation of the september snow depth is highly correlated with the average snow depth, with a correlation coefficient of 0.99 (fig. 6). some possible reasons for this correlation are presented in section 4.
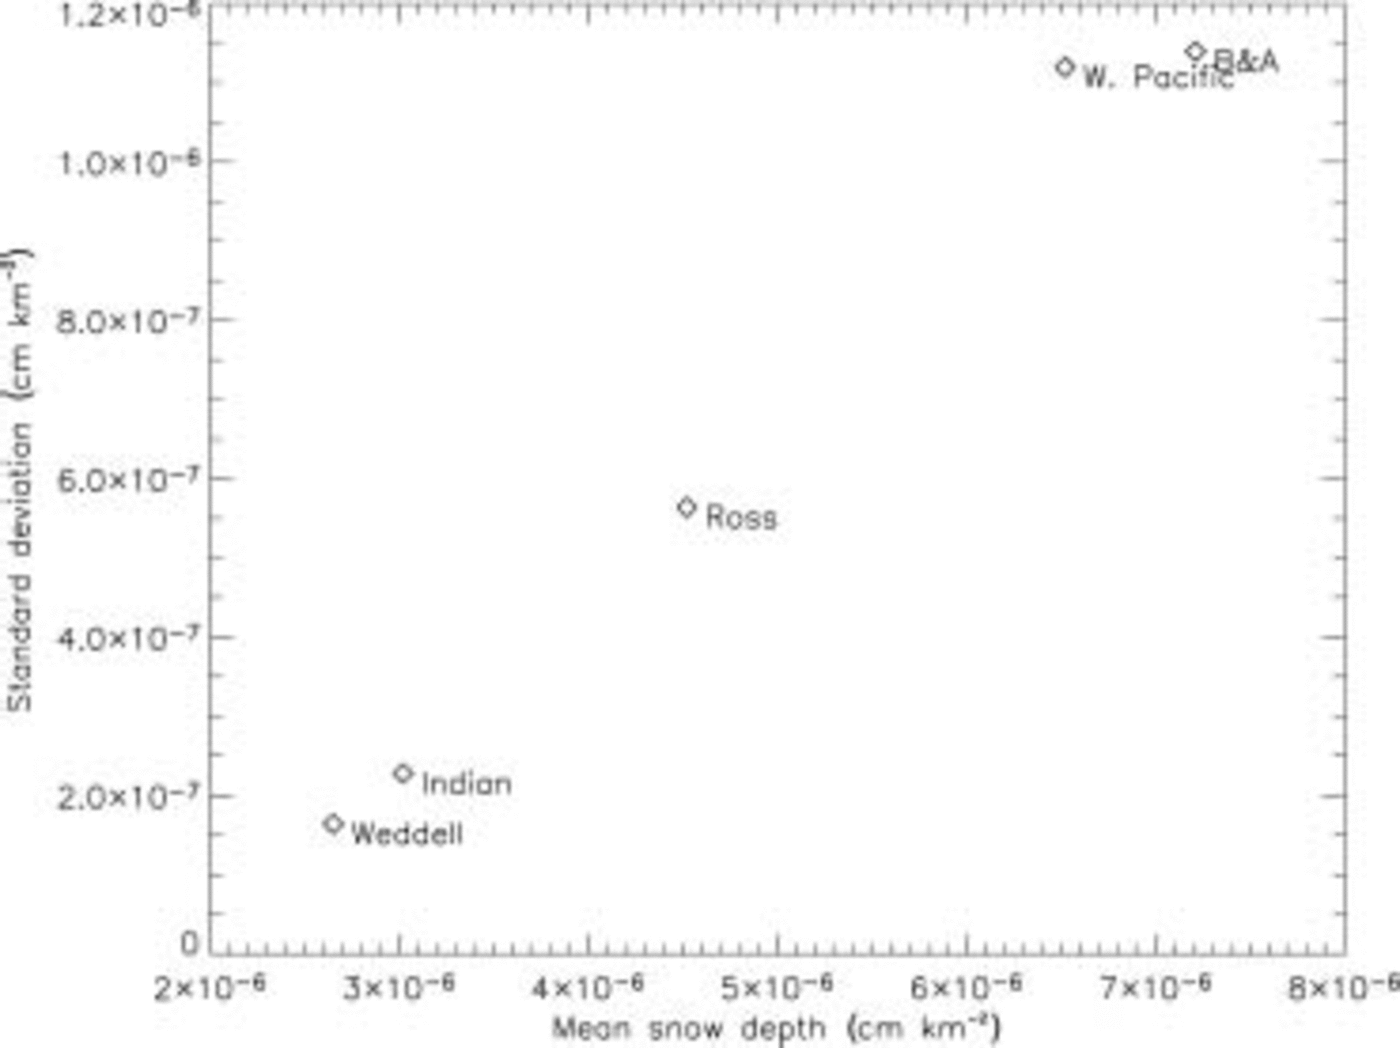
Fig. 6. Normalized mean snow depth and standard deviation for each of the five Antarctic sectors (see Table 1) for the month of September 1992–2003.
Table 1. Longitude boundaries for the Antarctic sectors

The time series for each of the sectors show a slight positive trend (fig. 7). these trends range from 8 to 16 mm(decade)–1, but only the indian ocean sector and the entire southern ocean have significant trends at the 95% confidence level. the difference in the significance is to a large extent caused by the lower interannual variability of the indian ocean sector and the entire southern ocean compared to the other sectors. nevertheless, these trends are well below the precision of the current snow-depth algorithm.

Fig. 7. Average snow depth for each of the five Antarctic sectors for the month of September 1992–2003. The snow depth for the entire Southern Ocean is the thick line.
4. Discussion
The results presented in the previous section reveal that the september snow depths have considerable regional and interannual variability over the period 1992–2003. furthermore, the snow depths are observed to be increasing in each of the five antarctic sectors. these changes appear to be related to corresponding changes in storm frequency and intensity. storms in the southern ocean generally originate at mid-latitudes and spiral poleward primarily along two branches merging with the circumpolar trough (e.g. jones and simmonds, 1993). a more recent study of extratropical southern hemisphere cyclones shows that there has been a southward shift in the number of cyclones over recent decades; more specifically, south of 40˚ s but north of the southern ocean there has been a decrease in the number of cyclones, whereas over the southern ocean there has been a modest increase (fyfe, 2003). additionally, there have been observed increases in the mean radius of southern hemisphere extratropical cyclones as well as in the annual mean cyclone depth (simmonds and keay, 2000). thus, the increase in the number of cyclones as well as their intensity may help explain the increase in the normalized snow depth observed in all sectors.
Longitudinally, the area-normalized cyclone density for winter has maxima in the bellingshausen and amundsen seas (b&a) and west pacific sectors (see fig. 3 in jones and simmonds, 1993), whereas latitudinally the peak zonal average cyclone density for september–october is centered in the 60–65˚ latitude band (see fig. 9 in jones and simmonds, 1993). the longitudinal position of these two cyclone maxima helps explain both the high mean normalized snow depths and the high snow-depth standard deviation of these two sectors (fig. 6).
A comparison of the time series of the annually averaged cyclone system density in the vicinity of 75˚ s, 160˚ e (see fig. 2c in simmonds and keay, 2000) with the september time series for the normalized snow depths for the west pacific sector during the years of overlap (1992–97) reveals peaks in both cyclone density and snow depths for the years 1992 and 1995. while the period of overlap is too short to yield any statistically significant result, the agreement does support the intuitive relationship between cyclone density and snow-depth variability.
These results also appear to be consistent with the nasa/ goddard institute of space studies atlas of extratropical storm tracks for the antarctic, in that their maps show that the east antarctic is the region of highest storm-track density for the years covered by the atlas (1992–98). the weddell and b&a sectors show large year-to-year differences in the number of september storm tracks, helping to explain the large surface-level pressure standard deviations for these sectors.
In summary, the b&a and west pacific sectors exhibit large variability in the number of storms, their intensity and frequency, which likely explains the large snow-depth per sea-ice area standard deviation (fig. 6). furthermore, the reported increase in the number of storms and storm depth entering the west pacific sector explains the positive trend in snow depth. the observed increase in snow depth is also consistent with recent reports of an increase in the mass of the east antarctic ice sheet from satellite radar altimetry measurements which were associated with a contemporaneous increase in precipitation (davis and others, 2005).
An airborne validation campaign for the arctic ocean was successfully completed in march 2006, with its primary objective to validate satellite passive microwave snow-depth retrievals (cavalieri and markus, 2006). for the antarctic, we plan to compare the SSM/I-derived snow depths with antarctic sea ice processes and climate (aspect) data (worby, 1999) once they become available. these data are a collection of standardized snow and sea-ice observations from ships. furthermore, we plan to compare these results with european centre for medium-range weather forecasts era-40 and/or us national centers for environmental prediction (ncep)/us national center for atmospheric research (ncar) re-analysis data, in order to explain better the observed variability in snow depth and also its relationship with the sea-ice cover.
Acknowledgements
We thank j. miller for his help analyzing the data, and the two reviewers for helpful comments.


