


1. Introduction
Water levels and pressures measured in surface boreholes on glaciers are used widely to interpret the hydraulic characteristics of the subglacial drainage system (Reference Iken, Fabri and FunkIken and others, 1996; Reference Barrett and CollinsBarrett and Collins, 1997; Reference Kulessa and HubbardKulessa and Hubbard, 1997; Reference Kavanaugh and ClarkeKavanaugh and Clarke, 2000; Reference Fischer, Porter, Schuler, Evans and GudmundssonFischer and others, 2001; Reference GordonGordon and others, 2001; Reference Flowers and ClarkeFlowers and Clarke, 2002). Such records typically show that subglacial drainage systems can be classified into two distinct and seasonally dependent modes: in winter a distributed drainage system dominates, while in summer an arborescent or channelized drainage system prevails (Reference Fountain and WalderFountain and Walder, 1998; Reference Gordon, Sharp, Hubbard, Smart, Ketterling and WillisGordon and others, 1998; Reference Jansson, Hock and SchneiderJansson and others, 2002).
Water-pressure records found in the literature are usually from surface boreholes, which connect relatively directly to the subglacial drainage system; less attention has been devoted to boreholes which intercept unconnected areas of the bed (Reference Murray and ClarkeMurray and Clarke, 1995; Reference Kulessa and HubbardKulessa and Hubbard, 1997), as these records show mainly unvarying pressures. This is due in part to the fact that the water fluxes one might observe in the unconnected drainage system, the Reference WeertmanWeertman (1964) layer, are too small to be registered in the larger-volume borehole. The problem with using surface boreholes is avoided when using pressure sensors placed directly at the glacier bed.
Beneath Engabreen, a hard-bedded temperate outlet glacier of the Svartisen ice cap, northern Norway, rock tunnels have been excavated for a hydropower project (Fig. 1). The Svartisen subglacial observatory (SGO) is a part of this hydropower complex, and is situated in a dry access tunnel next to the main water-transport tunnel used to carry water from the various subglacial and subaerial intakes to the power station. Above the intakes, the glacier is about 1.5 km wide, surface slope is about 10° and surface velocity is about 1md–1, with seasonal variations (Reference KohlerKohler, 1998). From the SGO tunnels, an inclined shaft goes up to within a few metres of the ice–rock interface, at a location where the overlying ice is 210m thick. A removable access door allows access to the basal ice.
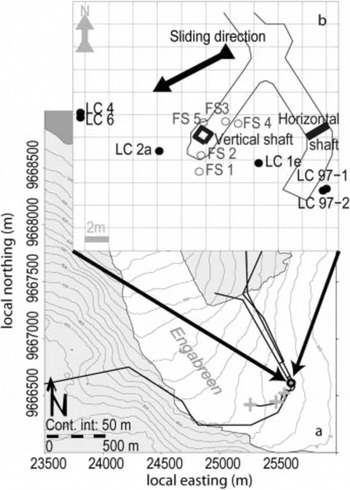
Fig. 1. (a) Site map of Engabreen with tunnel system (unit: metre, NKG (Nordic Geodetic Commission)). The three light crosses show the active subglacial intakes; the black open circle indicates the research shaft leading into the ice (study area). (b) Close-up of study area with load cells (filled circles), boreholes (open circles) and the two entrances vertical and horizontal shaft.
In this paper, we analyze and discuss results obtained from subglacial high-pressure pump experiments conducted from the research shaft underneath Engabreen. We use data from a load-cell record and in situ water-pressure measurements to study the way in which our artificial pressure perturbations interact with the subglacial hydraulic system. Data are collected from both connected and unconnected bed areas over a 22 m transect perpendicular to ice motion.
2. Data and Methods
2.1. Load cells
Six Geonor P-105 Earth Pressure Cells (0–50 bar) were installed flush with the bedrock (Fig. 1b), and have been logged at 15 min intervals semi-continuously since 1993. Load-cell signals reflect the pressure contributions of various combinations of basal ice, water or sediment particles. The load cells have been placed on the stoss and lee sides of bumps, inside overhangs and on flat terrain. Each pressure sensor is hardwired to a central Campbell ScientificCR10data logger, which is stored in a heated laboratory within the tunnel system.
2.2. Borehole pressure
Throughout the tunnel system are boreholes drilled from the tunnels up to the ice above, many of which will occasionally drain water from the glacier bed. In the SGO tunnel, there are five such boreholes (FS1–FS5; Fig. 1b).We seal the boreholes using packers connected to pressure transducers. The pressure transducers used are Stiko PTX-2 with 4–20mA two-wire output and a pressure range of 0–30 bar. The sensors are logged with a Campbell Scientific CR10 data logger. These short-term pressure records provide useful data for comparing load-cell pressures with direct water pressures.
2.3. High-pressure pump experiments
During several field campaigns we have conducted high-pressure pump experiments in the SGO tunnel boreholes (FS1–FS5; Fig. 1b). Water used in the experiments is taken directly from the stream within the tunnel system. The temperature of the water leaving the high-pressure pump is <1˚C. The procedure in all cases is as follows.
First we hydraulically ream the boreholes, removing all accumulated sediment. We then insert a packer into the borehole, connected to a short length of pipe sealed at the end with a closable valve and with a T connection to a pressure transducer. We pressurize the boreholes with water at 4–5 bar using a long tube inserted in the valve, to minimize the amount of air introduced into the system. The water-filled boreholes are allowed to sit for a period of hours to a day. One of the packed boreholes is then used to introduce high-pressure perturbations to the basal hydraulic system using water pressures exceeding local ice overburden. During the experiments, water pressures in all five boreholes are logged at 1 s intervals and the load cells at 2 min intervals.
SGO uses two pumps to deliver water to the research tunnel at a pressure of 4 bar and a maximum discharge of 8m3 h–1. High-pressure boosting is accomplished primarily using a Grundfos CR 8-200, which can deliver a maximum of 26 bar, decreasing to 18 bar at the maximum discharge. We also used a Kärcher M 5.20 high-pressure pump in the start-up phase of the experiments. This smaller pump delivers 30–40 bar pressure but has a maximum discharge of only 0.5 m3 h–1. The Grundfos pump is turned on when the Kärcher pump does not manage to keep the pressure above ice overburden after connection to the drainage system is established, that is, if the capacity of the drainage system exceeds the maximum discharge of the Kärcher.
The discharge of each high-pressure pump is measured with a Kobold SMA-1150 flow-meter. This flow-meter has a high accuracy for small discharges, but measures only up to 3 m3 h–1. Hence discharges between this limit and maximum flow rate (8m3 h–1) have to be estimated.
3. Results of High-Pressure Pump Experiments
Ten pump experiments have been conducted at different times of the year. High summertime discharge into the tunnel system precluded all but two pump experiments, which were conducted during July. The majority of the experiments have been conducted in March (three) and May (four), and only one in the autumn (November).
The aim of these experiments is to create a local and closed hydraulic cavity. Cavity pressure is controlled by our high-pressure pump as long as no connection is established with an existing drainage system. The spatial extent of the growing water cavity can be deduced from positive pressure perturbations observed in the load cell and the instrumented boreholes. Minimum volume of the water cavity can be estimated using the pump discharge record.
Every high-pressure pump experiment has three stages. First is the pre-breakthrough stage, the time between start of pumping and ‘breakthrough’. We define a breakthrough as the sudden uplift of the basal ice, which manifests itself as a decrease in water pressure in the injection borehole as water starts to flow into the glacier bed. Second is the cavity-growing stage, the time between breakthrough and pump shut-down. During this stage the cavity is growing, and connection with an existing drainage system is established. Third is the post-pumping stage. If we assume that we did connect with a subglacial drainage system, the water pressure in the injection borehole adjusts to the ambient water pressure in the hydraulic system. During this stage we log the actual water pressure in the drainage system.
The most important defining characteristics for each pumping experiment are the background pressure and the surface-to-volume ratio of the drainage system that is encountered. In summer experiments the growth of the cavity suggests a low surface-to-volume ratio of the hydraulic system. Upon cessation of pumping, water pressures in the pumped borehole drop to low, near-atmospheric levels. In contrast, the defining characteristics for a winter experiment are that the growth of the cavity suggests a high surface-to-volume ratio of the hydraulic system and, after pumping, water pressures in the pumped borehole drop to near overburden pressure.
3.1. Summer pump experiments
In July 2002, four boreholes leading from the research tunnel to the ice–bedrock interface (FS1–4; Fig. 1b) were cleaned and plugged as described in section 2. One borehole, FS3, was connected to the high-pressure pump and the flow-meter. The Kärcher low-flow pump was turned on (Fig. 2a) and the pressure in FS3 immediately rose to 30 bar. After <1 min, the pressure fell to 22 bar and water had slowly started to flow (Fig. 2c). The Kärcher pump ran for 22 min, during which time FS4, FS2 and LC2a come into contact with the pressurized water (Fig. 2d). By the time the low-flow pump was switched off, water pressure in the pumped borehole was 15 bar.
Fig. 2. Summer high-pressure pump experiment in borehole FS3. Solid vertical lines mark pump start and pump end. (a) Water pressure logged in boreholes FS1 (solid light line), FS2 (dotted light line), FS3 (solid dark line) and FS4 (dash-dotted light line). (b) Load-cell pressures on load cells LC4 (dash-dotted light line), LC6 (dash-dotted dark line), LC2a (solid dark line), LC1e (dotted light line), LC97-2 (dashed dark line) and LC97-1 (solid light line). (c) Pump rate through the borehole FS3. (d) Study-site map with connected logging points marked with connection time (dark circles) and unconnected logging points (open circles).
The Grundfos high-flow pump was then turned on at 23 min. The flow rate increased (Fig. 2c), and pressure increased in the water cavity to above flotation level. After 28 min, the flow rate increased beyond 3 m3 h–1. After approximately 40 min, LC2a decoupled from the water-filled cavity as the pressure in the cavity was declining. We shut the pump down after 45 min as the pressure had been falling for the previous 17 min. After pump shut-down, the pressure in the connected boreholes continued to fall to 2 bar. Two of four pump experiments from May, one of three pump experiments from March and the other July experiment had similar characteristics.
3.2. Winter pump experiments
In May 2003, we cleaned five boreholes (FS1–FS5; Fig. 1b) but blocked only four of the open boreholes with packers (FS1, FS3–FS5). FS2 was left open and unpacked after cleaning. The high-flow Grundfos pump was connected to FS5. The whole set-up was left undisturbed for 40 hours. FS1 connected to a hydraulic system 12 hours before pump start (14 bar). The pump was turned on at time zero (Fig. 3a). The flow rate into the glacier bed reached 2 m3 h–1 after 10 min (Fig. 3c) as the pump pressure stayed stable around 22 bar. Within 34 min, two new boreholes and four load cells were connected to the pressurized cavity (Fig. 3d). Pressure then started to decrease from 22 bar and the flow rate increased. Load cell 1e again disconnected from the cavity approximately 58 min after pump start. After 75 min, a small pressure drop was logged within the cavity and the pump started to work more easily. The pump was turned off after 202 min as the pressure asymptotically approached 18 bar. Two of three pump experiments conducted during March, the one conducted in November and one other of the four pump experiments conducted in May had similar characteristics.
Fig. 3. Winter high-pressure pump experiment in borehole FS5. Solid vertical lines mark pump start and pump end. (a) Water pressure logged in boreholes FS1 (dash-dotted line), FS3 (dotted light line), FS4 (solid light line) and FS5 (solid dark line). (b) Load-cell pressures on load cells LC4 (solid light line), LC6 (dash-dotted dark line), LC2a (dash-dotted light line), LC1e (dotted light line), LC97-2 (solid dark line) and LC97-1 (solid light line). (c) Pump rate through the borehole FS5. (d) Study-site map with connected logging points marked with connection time in minutes (dark circles) and unconnected logging points (open circles).
4. Interpretation and Discussion
It is now commonly accepted that temperate glaciers typically have two seasonally dependent end-member hydraulic systems, a dominantly channel-based drainage system during summer and a dominantly distributed or linked-cavity system during winter (Reference Stone and ClarkeStone and Clarke, 1996; Reference Fountain and WalderFountain and Walder, 1998; Reference Nienow, Sharp and WillisNienow and others, 1998; Reference Anderson, Fernald, Anderson and HumphreyAnderson and others, 1999). A dominantly channel-based drainage system, typical for the summer, will have a low surface-to-volume ratio, that is, the connected area of the bed is at a minimum. Under this hydraulic regime the average water pressure in the connected area will be low, the discharge high, and the channels should develop in the sliding direction (Reference RöthlisbergerRöthlisberger, 1972). On the other hand, a linked-cavity based system, typical for the winter, will have a larger surface-to-volume ratio, with a relatively large connected area of the bed. For this type of drainage configuration, the averaged water pressure in the connected areas will stay high, the discharge will be low and the drainage direction will tend to follow low-pressurized areas of the bed perpendicular to sliding direction (Reference WalderWalder, 1986).
Applied to our pump experiments we could thus expect two scenarios: the cavity connects either (1) to a channel-based drainage system with low pressure and fast drainage or (2) to a linked-cavity based drainage system with slow drainage and high pressure. In both cases, the post-pump water pressure in the injected borehole will reflect the pressure of the drainage system, giving us a means of identifying the particular hydraulic system.
Due to the significant difference in surface-to-volume ratio, discharge and water pressure in the two types of drainage configuration discussed here, we will expect pump experiments undertaken during channel-based drainage to differ from pump experiments undertaken during linked-cavity based drainage. A low surface-to-volume ratio should on average extend the time needed between pump start and establishment of a connection with the existing drainage system. Once connected, the distal pressure in the cavity will adjust quickly to the lower pressure in the drainage system, leading to increased flow in the cavity. Due to the overall lower pressures, the cavity will cease to grow and a direct connection will be established between the pump and the channel. Conversely the existence of a linked-cavity drainage system should, due to the high surface-to-volume ratio, lead to shorter time needed between pump start and establishment of a connection between the expanding pressurized cavity and the drainage system. The pressure in the latter case remains high and the flow is limited by what our pumps can deliver.
At the beginning of each experiment the water in the injection borehole is most likely unconnected to the active subglacial hydraulic system. We assume this because the water pressures in the boreholes are stable over hours after cleaning and blockage. When the pump is started, a thin lens-shaped water cavity will grow above the pumped borehole as the ice is mechanically lifted due to the strongly negative effective pressure (Reference Engelhardt and KambEngelhardt and Kamb, 1997). On an idealized flat bed, this lens would simply grow radially. Since the topography of a natural glacier bed is irregular, the cavity should quickly become polymorphous, with fingers extending into areas of the bed which have relatively lower values of normal stress.
The normal stress is strongly dependent on the orientation and size of bed undulations, sliding speed, sliding direction, sediment content and water stored at the bed. The pressurized water fingers grow in all directions as long as the local effective pressure is negative. Inactive water-filled cavities will be embedded into these fingers, adding an unknown water volume to the continuously expanding thin water cavity. Such inactive cavities enhance the spatial distribution of the growing cavity. If any part of the cavity intersects the connected system, our pump will feed a larger system. Thus the controlling factor in these experiments is the spatial distribution of the connected system.
We classified our ten pump experiments by season (Figs 2 and 3) primarily on the basis of the pressures observed once pumping ceased. Another significant difference is that the pre-breakthrough stage (Fig. 4, first stage) varied highly in duration for the different pump experiments during the summer regime, but was very short (some seconds) during the winter regime.
Fig. 4. Left axis: month and year for all ten pump experiments. Left column (first stage): time between pump start and breakthrough. Centre column (second stage): pump experiments plotted as physical distance from injection borehole (x axis) vs time after breakthrough (numbers, in minutes). Right column (third stage): post-pump pressure in injection borehole. (a) The five ‘winter regime’ pump experiments. (b) The five ‘summer regime’ pump experiments.
Finally, a further seasonal difference is that the spatial distribution of the growing cavity, as inferred from the detection of the pressure increases at the observing points (load cells and boreholes), was different for the two groups of experiments. In the winter-classified experiments, load cells and boreholes were connected one by one in a seemingly random order relative to physical distance from the injection point (Fig. 4a, second stage). The only main trend is that they tended to connect in a zone perpendicular to sliding direction (e.g. Fig. 3d). We interpret this to be due to the existence of the wider distribution of water-filled but poorly connected cavities typical for a linked-cavity system. In this way large areas of the bed will come into contact with the cavity soon after the pump starts. This is also supported by the observation that the first connection between the pumped borehole and the other observation points was established relatively fast in all five winter experiments, independent of distance to the starting point (Fig. 4a, second stage).
Cavities created during the summer pump experiments also extended quickly, but in a linear fashion relative to the distance between water injection and sensor (Fig. 4b, second stage and Fig. 2d). The pressurized cavity will theoretically expand its fingers from the borehole in a more-or-less radial distribution until connection with an active drainage system is established. The time needed to establish connection with an existing drainage system was highly variable, however, from <10 min to >40 min. This is consistent with the low surface-to-volume ratio of a dynamic drainage system consisting of a few main draining channels with few or no interconnected cavities in the area between the channels. Note that we assume in this model that the channels tend to move with the sliding glacier, a supposition supported by the load-cell record, which shows the existence of low-pressurized zones occasionally passing the load cells during the summer season.
During summertime, after contact was established with the low-pressure high-flow connected system, we were unable to maintain sufficiently high pump pressures due to the enhanced intake capacity of subglacial drainage. After pump shut-down we logged a water pressure radically lower than the post-pump pressures logged in winter, reflecting a low-pressure drainage configuration (Fig. 4, third stage).
We have classified one pump experiment conducted in March 2002 as a summer regime experiment (Fig. 4b). Engabreen is a maritime glacier that receives rainfall throughout the year. In March 2002 the weekly mean temperature at a nearby meteorological station was 3˚C prior to our pump experiment, and the precipitation for the week was 17 mm. Subglacial discharge was observed to increase by >30% the day before our pump experiment, leading us to infer that we pumped into a subglacial hydraulic system that had adjusted to the input of surface water earlier that week.
5. Conclusion
We have conducted ten basal high-pressure pump experiments during all main seasons. The results suggest a separation of the ten pump experiments into five summer- and five winter-regime pump experiments. The summer regime is characteristic of a dynamic drainage system of low pressure and high discharge. The pump experiments and the load-cell record lead us to suggest that this low-pressure system consists of ephemeral channels moving with the sliding glacier, having a low surface-to-volume ratio. The winter regime, in contrast, is characterized by high pressure (one order of magnitude larger than the summer regime) and low discharge. The quickly established hydraulic connections that expanded non-linear relative to pump source in a direction perpendicular to the sliding direction lead us to suggest that this high-pressure system consists of connected and interconnected cavities. These are situated in the low-normal-stress areas of the bed, resulting in a hydraulic system with a high surface-to-volume ratio.
Acknowledgements
This work was supported by a grant from the Norwegian Research Council (NFR), by the Norwegian Water Resources and Energy Directorate (NVE) represented by M. Jackson, and by the hydropower company Statkraft. We are grateful to the irreplaceable field assistants A. Baumberger, E. Loe, R. Hansen and T. Schuler for their full day and night work in the tunnel. We thank M.J. Roberts and an anonymous reviewer for their thorough and constructive reviews.


