


Introduction
Over a span of several years, experiments have been carried out with small volumes of flowing snow in order to assess the mechanics of the flow process (Dent and Lang 1980). The evidence from these tests is that the bulk of the material moves on a relatively thin, active layer of granular material (Dent and Reference Maeno, Nishimura and KanedaLang 1982). In these tests the snow flowed over a smooth packed snow surface, for which surface roughness and surface undulations were small. Surface roughness was of the order of the grain size of the packed snow, up to 1.0 mm, and surface undulations were less than 0.01 m per meter of track. Under these track conditions the active velocity-gradient granular layer was of the order of 0.01 to 0.05 m thick for flow speeds up to 18.5 m s−1. Logically, as surface roughness and surface undulations are increased, as in actual avalanche flows, the active layer size may vary. However, the basic mechanism of flow should remain the same. In particular, this may occur in reaches of the flow behind a rapidly mixing, leading-edge region, that functions to smooth the track.
Our primary interest is in the characteristics of the thin-layer mechanism of flow. As a first step in an experimental program to study this mechanism, some simplifying assumptions were made. These include restrictions to small surface roughness of the order of the grain size of the snow, to negligible surface undulations, and to flow speed of low values.
The development of the thin layer is believed to depend upon the relative shear strength of the moving snow τk compared to the shear strength of the surface snow τs. For τs<< τk the thin granular layer should form principally from granulation of the snow blocks of the moving snow. If τk<< τs then the granulation should be of the surface snow, the surface eroding away as the flowing snow passes over. When the shear strengths are comparable, then both processes of granulation operate. In our tests the condition τk<< τs was used, and the hardness of the surface snow was varied so that several physical parameters that characterize the granular layer under conditions of varying hardness between the moving and surface materials could be determined. One measured parameter was the shear force necessary to initiate and sustain motion for different flow speeds and overburden loads. Another computed parameter was the kinematic viscosity of the granular layer, based upon the observed velocity profile through the layer thickness. From extrapolation of shear force measurements at different flow speeds, the locking shear stress τ0 of the granular layer was estimated. The dependence of the various parameters on temperature was also determined. These test results constitute a first step in a process of attempting to characterize the material properties of the granular layer.
Snow Hardness
Snow is an ideal material with which to obtain variable hardness through sintering. At the start of each test, snow having a nominal grain size of 0.4 mm was sifted through a sieve with a 2.0 mm square grid onto a track, smoothed, and allowed to sinter for different periods of time before testing for hardness. By this process snow hardness ranging over an order of magnitude was tested.
Hardness of the snow was measured with a Canadian hardness tester with a scale reading zero to 4.5 kg m−2 with the scale amplified by 10X by changing the diameter of the penetration head on the instrument for most tests. Hardness readings were obtained by placing the penetration head on the snow surface, then gradually applying pressure by hand until the head penetrated the surface. In most tests the penetration amounted to 1 to 5 mm before the head stopped, but in a few tests the penetration was through the entire 0.05 m depth of snow before the head stopped. A third condition was noted in some tests when the penetration head was gently placed on the snow surface, rather than settling it in by a sideward motion. Under these conditions initial penetration was sometimes less than 1.0 mm, and occurred at low pressure. This is thought to be due to a few contact grain bonds failing, and may be a more accurate measure of surface hardness than the 1 to 5 mm penetration case described above. However, our interest is in formation of granular snow, so that the 1 to 5 mm penetration hardness is appropriate for possible correlation with granular layer formation, and it is this type of hardness measure that is referred to as “surface hardness” in this report.
Hardness measurements were made on a track of sifted snow 2.0 m long, 0.15 m wide, and 0.05 m deep. A total of six measurements were made at each temperature and duration of sintering, and the average of these was used as the hardness value. Two types of tests were run, one with the track covered, so that no moving air contacted the surface and another in which air speed past the snow surface was approximately 0.6 m s−1, produced by circulating air fans in the freezer. Snow hardness was measured at air temperatures of -5, -10 and -18°C, and average relative humidity in the freezer of 84% (as measured with a hygrothermograph). Snow density measured at various times over the six-month duration of testing was constant at 400 kg m -3 . Over this period, as snow volume was lost due to sublimation, additional snow of similar grain size and constitution was used, when the snow was re-sifted for a new test.
Results of the hardness tests are summarized in Figure 1 for the three freezer temperatures, as noted.
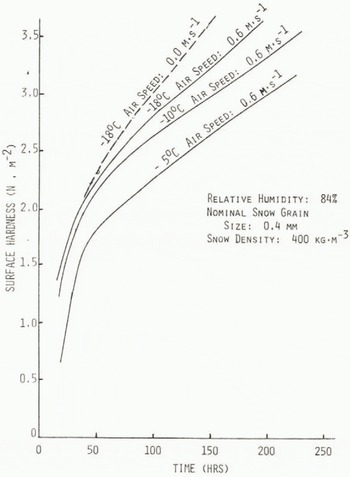
Fig. 1. Average surface hardness versus sintering time of the track of sifted snow.
It can be seen that surface hardness tends to increase as air temperature decreases for any specified duration of sintering. For instance, at a sintering time of 100 h, hardness at -5°C is 2.25 H m−2, whereas at -18°C it is 2.85 N m−2 for the case of an uncovered track (air speed 0.6 m s−1). When the air speed is reduced to zero (covered track), the snow tends to harden at a slightly faster rate so that after 100 h at -18°C the hardness is 3.0 N m−2 Under all testing conditions the curves of hardness versus sintering time appear to have a bend between zero and 50 h sintering time. After this time the dependence approaches a straight-line relationship.
Setup for Sled Tests
The 2.0 m long track was used as the softer surface upon which a granular layer was formed by dragging a weighted sled along the track (Fig.2.). Sleds used for these tests were 0.105 m wide and 0.12 m long, made of 9.5 mm plywood with the bottom surface coated with glued sand. Two sizes of sand grains were used (referenced to sieve grid dimension), 0.4 mm which corresponded to the snow grain size of the track, and 2.0 mm which provided a second roughness for testing purposes. A third sled was constructed having the same contact area as the above, but with a width of 0.0525 m and length of 0.24 m, with 0.4 mm sand, in order to determine the effect of a halved frontal width on granular layer formation. The sleds were weighted with steel plates that were selected to simulate the pressure of flowing snow 0.4 and 0.8 m deep with a nominal density of 300 kg m−3. The sleds were pulled by a stepped-speed motor having settings from 0.06 to 0.63 m s−1. The motor was mounted on a roller-suspended table that bore against a dial force-indicator of 5.0 kg capacity and 0.1 kg least division. The track assembly was placed in a room freezer which had a temperature control to ±1.0°C. Additional details of the test set-up and procedures are outlined by Dent and Lang (1981).
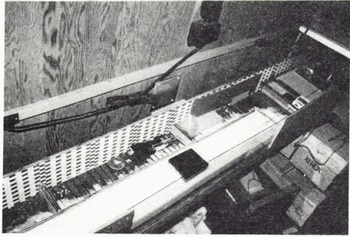
Fig. 2. Overall view of track, motor.test sled and drive
Characteristics of the Drag Force
A drag test consisted of pulling the sled along the track by a cord connected to a pulley on a stepped-speed motor. At the lowest speed of the motor (0.06 m s−1) the driving force versus time was a large regular oscillation, controlled basically by the elasticity of the driving system. At the higher speeds a static breakaway force was noted, fallowed öy a monotonie decrease to a steady-state force. After one pass of the sled on the track, a loose granular layer of snow was left whose thickness varied by the original hardness of the surface.
The greatest influence on drag force was the weight of the test sled. Based on two sled weights the variation in drag force is shown in Figure 3, with slopes of the lines in the range of a friction coefficient u = 0.5. For a 400% change in roughness of the surface of the test sled (defined by grain size), only a 10 to 20% increase in drag force on the sled was observed.
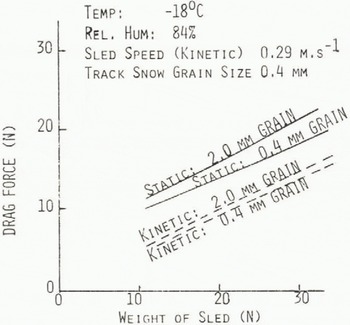
Fig. 3. Drag force on sled versus weight of sled for initial (static) release and steady (kinetic) motion of sled.
Variation in steady-state drag force with surface hardness was small, in the range 4 to 13%, for an order of magnitude change in hardness from 0.4 to 4.0 N m−2 (see Dent and Lang (1981) for these results). Measurements of drag force below 0.4 M m−2 surface hardness were not taken because of prédominant plowing action by the test sled. Drag force did not appear to vary with temperature over the range -5 to -18°C, at least to the accuracy of measurement in these experiments.
Drag forces on the test sleds having 0.4 and 2.0 inn sand grains are shown in Figure 4. Since drag force is not a strong function of temperature, data points are included from all test temperatures of -5, -10 and -13°C. Comparing nominal values of drag force we note that for an overburden pressure of 1 180 N m−2 there is a 4.5% increase in drag force of the 2.0 mm sand grains sled over the 0.4 mm sand grain sled, at a surface hardness of 2.5 N m−2 This increase in drag force is actually within the error envelopes of the data points of these tests. At an overburden pressure of 2 360 N m−2 the increase is larger, at 13.7%, but still within the error envelope of the data. However, if we consider the trend as experimentally accurate, we can conclude that a 400% increase in sled surface roughness will produce an increase in drag force of less than 15%. This possibly can be attributed to the smaller snow grains filling the interstitual spaces of the large sand-grain spacings, so that the rougher sand-grained sled has nearly the same appearance as the finer grained sled, as far as drag is concerned. One would expect the same type of process to occur in the case of snow avalanches flowing over rough terrain. Action at the leading edge would tend to reduce the effective roughness of the track over which the bulk of the follow-on avalanching snow would flow. Halving the frontal dimension of the test sled did not result in a significant change in drag force. This indicates that motion in the granular region behind the leading edge of the sled had the dominant influence on the steady-state drag force, rather than the bond breaking at the leading edge of the sled.
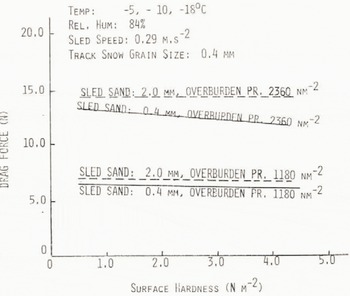
Fig. 4. Steady drag force on sled versus track surface hardness.
Following a series of tests involving the two sled roughnesses and the two overburden pressures in all combinations, the depth of the loose granular snow on the track was measured. This was done by direct measurement; a track area 0.105 by 0.07 m was isolated and the loose grains were removed and weighed (800 grains = 2.9 × 10⁻³N). Results from these measurements show that neither overburden pressure nor sled grain size influenced appreciably the amount of loose grain production from passage of the sled over the track. Rather, the only marked effect is seen relative to surface hardness of the track. Although scatter of data is large, grain depth appears to be related to surface hardness by an exponential relationship (Fig.5.). The data points include those from all pertinent tests for all freezer temperatures, overburden pressures, and sand-grain sizes. One conclusion derived from study of these data is that the degree of surface hardening affects the depth to which the loose granular layer penetrates; yet the depth of the loose grains has little effect on the drag force necessary to form the layer. Various straight-line approximations to the exponential curve in Figure 5 are possible for limited ranges of grain depths. One approximate straight-line representation over a limited range of hardness is shown by the dashed line in Figure 6.
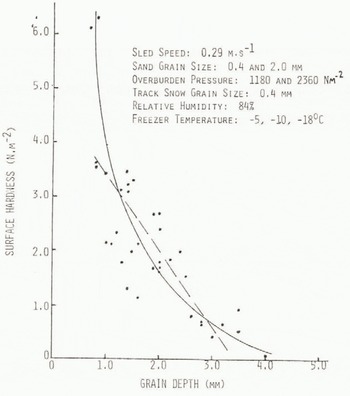
Fig. 5. Surface hardness versus deoth of loose grains on track after passage of test sled.
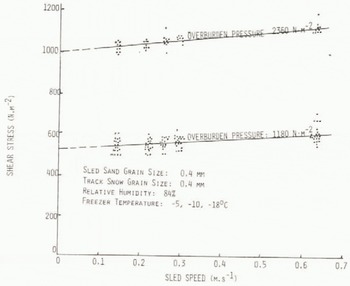
Fig. 6. Shear stress on test sled versus speed of test sled.
Viscous Properties of the Granular Surface Layer
The viscous properties of the granular snow layer were estimated by pulling the test sleds over the track by a second or third pass and noting the steady-state drag force at different speeds. Data points from tests at all freezer temperatures are plotted for the two overburden pressures of 1 180 and 2 360 N m−2 in Figure 6. The essential information derived from Figure 6 is the locking stress, or shear stress at zero velocity. This is obtained by extrapolating the solid lines through the data points clusters back to the Ordinate. Then τ0 = 520 N m−2 when the overburden pressure is 1 180 N m2 and τ0 = 1 000 N m−2 for an overburden pressure of 2 360 N m−2, thereby defining the ratio of locking shear stress to overburden pressure as γ = 0.43. This value is at the low end of the range of values for kinetic friction reported by Inaho (194-1), namely 0.42< γ _0.55. Inaho obtained this range of values for snow blocks sliding on a granular snow track. Density of the snow used in the experiment ranged from 295 to 438 kg m−3 Snow blocks ranging from 0.10 to 0.45 m in height were used at speeds up to 4.0 m s−1. Inaho reported the total kinetic friction, whereas τ0 represents the limit on kinetic friction as the velocity approaches zero. Thus, we expect our value of Y to be at the low end of Inahois data. We note, however, that the range in values of kinetic friction reported in the literature is from 0.1 to 0.6 under different conditions of testing (Lang and Reference InahoDent 1982). We report Inaho’s results because the test conditions are similar in the two cases.
Further information derived from these tests is an estimate of the kinematic viscosity of the granular snow. The kinematic viscosity ν is contained in the basic shear-stress equation for a linear locking material in one-dimensional flow of the form

In this equation, τ0 is the locking shear stress, for which average values have already been determined. The density ρ is assumed to be equal to the value of the track snow, which was measured at ρ = 400 kg m−3 A cross-section of a drop of ethylene blue dye placed in the granular layer immediately before passage of the sled over the spot is shown in Figure 7. The superimposed line on the figure highlights the approximate linear character of the distribution. Thus, the term du/dy is estimated by dividing the sled velocity by the measured thickness of the granular layer.
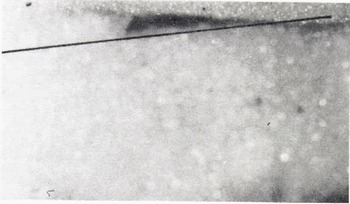
Fig. 7. Photo of ethylene blue dye dispersed through granular layer after passage of test sled.
The results of calculating ν from the shear equation show that kinematic viscosity is primarily a function of surface hardness, and not dependent strongly on freezer temperature or overburden pressure (Fig.8.). Considerable scatter in data points is obtained, particularly at higher values of surface hardness, when depth of the granular layer reduces in thickness. This change in kinematic viscosity may reasonably be due to a change in the mechanism of relative motion between the grains as the granular layer thickness decreases to one or two layers of grain. From Figure 8 we see that kinematic viscosity is in the range 10−3 m2 s−1. This order of magnitude viscosity is in the range reported by Maeno and others (1980) from his tests of snow mixed with air, as the air content is reduced. Maeno and his co-workers measured viscosity using a viscometer, employing an air flow that fluidized the snow grains as in blowing snow.
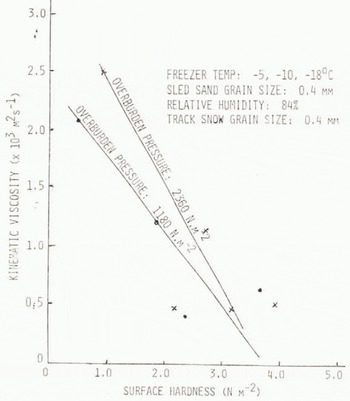
Fig. 8. Computed kinematic viscosity as a function of surface hardness for two overburden pressures.
Conclusions
From the simple tests that have been run, some qualitative data has emerged on the characteristics of the thin granular layer formed between friction surfaces and snow. To form the granular layer from originally sintered snow takes approximately twice the force as that necessary to sustain motion on the continuously formed granular layer. Depth of formation of the granular layer depends strongly on surface hardness of the snow, with negligible variation due to freezer temperature over the range -5 to -18°C. The shear force needed continuously to form the granular layer depends linearly on the overburden pressure, but only secondarily on the relative roughness between the surfaces for the range of parameters of our tests. Also the shear force for continuous motion of the test sled depends only secondarily upon surface hardness and thickness of the granular layer. As surface hardness is increased, the shear force to sustain motion monitonically decreases for the range of parameters considered in our testing. A locking shear stress was measured for snow, and determined to be in the range of values for kinetic friction as reported in the literature. Using a constitutive law that includes locking stress, kinematic viscosity was computed, and determined to be of an order of magnitude that pertains also to the lower limits of air content in blowing snow. Having determined properties of the thin layer of granular snow at low speeds, the investigation of granular layer characteristics at high (snow avalanche) speeds remains.
Acknowledgments
The work performed relative to this report was supported through Cooperative Agreement No. RM-81-165-CA with the Rocky Mountain Forest and Range Experiment Station in Fort Collins, Colorado. The authors express appreciation to Dr Pete Martinelli Jr for leadership and encouragement during the course of this cooperative study.


