


Introduction
There is a need to improve our knowledge of the flow dynamics and stability of Antarctic blue-ice areas in a changing climate (Reference BintanjaBintanja, 1999). Blue-ice areas are known to have very old ice at the surface that can be a valuable resource for palaeoclimatic research (e.g. Reference SommerNaruse and Hashimoto, 1982; Reference BintanjaBintanja, 1999). However, to extract useful information from the ancient surface ice for palaeoclimate studies, or to study the stability of the Antarctic blue-ice areas as a part of large-scale mass-balance research, detailed mass-balance and concurrent ice-flow measurements are needed. The state of balance of blue-ice areas over a period could also be estimated from these measurements.
The longest mass-balance record known to us from a blue-ice area is from Borgmassif in Dronning Maud Land where three stakes were measured over a 34 year interval (Reference Brunk and StaigerBrunk and Staiger, 1986). Ablation rates have been measured by direct stake measurements on several other Antarctic blue-ice areas, but most stake ablation records still only cover a relatively short period (e.g. Reference Budd and ŌuraBudd, 1967; Reference Faure, Buchanan and ElliotFaure and Buchanan, 1991; Reference Thompson and WallaceTakahashi and others, 1994). The results are summarized by Reference BintanjaBintanja (1999). We present accumulation and ablation rates for a blue-ice area spanning a period of 14 years. The results are compared with previous, only partially published, field measurements (Reference Naruse and HashimotoJonsson,1992). We discuss the error sources in the data, and estimate the state of balance of the blue-ice area.
Study Area
Scharffenbergbotnen is the best-studied blue-ice area in Antarctica, from a glaciological point of view. It is located in northwest Sivorgfjella, Heimefrontfjella, with an ice inflow from the surrounding inland ice sheet (Fig. 1). The main influx comes from the northwestern entrance of the valley (shown by the large arrow in Fig. 1). There are minor inflows from the shallow, narrow southwestern portal and from ice entering the valley from a 400 m high icefall at the eastern end of Scharffenbergbotnen (shown by small arrows in Fig. 1). A visible boundary <km from the icefall, in the ice at the bottom of the valley, restricts the small icefall flow (Reference Naruse and HashimotoJonsson,1992).This boundary also marks the end of a debris-covered area close to the mountains. Supraglacial till is found mainly at the eastern end of the valley and on the southern side where stakes 15,16 and 18 were located. The mass-balance data from these stakes appear typical of blue ice.

Fig. 1. The Scharffenbergbotnen study area close to the Swedish field station Svea (marked). The stakes located on snow are labelled in black, and the blue-ice stakes in grey.
The surface topography of the floor of the valley, mapped in 2000, is presented in Figure 2. The main blue-ice area is located in a depression at the southeastern end of the valley. There is a smaller blue-ice field, in a depression upstream of the main blue-ice area, on the northern side of the main entrance that is separated from the main blue-ice field by a snow ridge (stakes 4 and 17 in Fig. 1). Blue ice is also found above the Swedish research station Svea (stake 14 in Fig. 1). The ice transition between perpetual snow-covered areas and blue ice is a zone where snow patches are found on blue ice occasionally situated 4100 m from the continuous snow-covered areas.
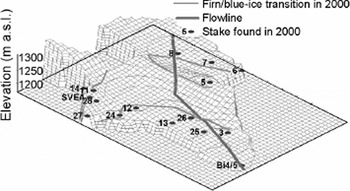
Figure 2 also shows the stakes that survived until 2000. Stake 28 was snow-covered between 2000 and 2002, but the rest of the stakes plotted in Figure 2 were also found in 2002. The study area is described in more detail by Reference Naruse and HashimotoJonsson (1992).
Stake Measurements
Originally a net of 34 stakes was established in the study area in 1988 (Reference Naruse and HashimotoJonsson,1992). The stakes were remeasured in 1990, 1992, 1993, 1994, 1998, 2000 and 2002. The mass-balance results are obtained from direct measurements on 12 stakes over the full 14 year period, and from 26 stakes over the 6 year period 1988–94. The positions of the 12 stakes and an additional 3 stakes installed in 1998 were measured with differential global positioning system (DGPS) in 2000 and 2002 (Javad Positioning System) to determine the ice-flow velocity. Two of the additional stakes (Bi4/5 in Fig. 1) were also used for mass-balance measurements for the period 1998–2002.
Results
We divided the stake data into two groups according to the surface conditions (Table 1). Group 1consisted of stakes that were on blue ice for the whole period, and also stakes that had snow around them in 1990 and 2002 but were otherwise on blue ice. Group 2 included a few stakes that were occasionally on blue ice but usually on snow, along with stakes that were on snow for the whole period.
Table 1. Net balance (mm w.e. a–1) for each stake in Scharffenbergbotnen valley for the observation period they survived. standard deviation of the mean

The cumulative net balance for each stake over the 14 year observation period is shown in Figure 3. Only 12 stakes survived the whole period, 5 of which were on blue ice. Most of the surviving stakes were located close to the equilibrium zone of the main blue-ice area in the Scharffenbergbotnen valley or the smaller blue-ice area upstream from the main blue-ice area (Fig. 1). Thus they were not buried by snow accumulation, or ablated from the blue ice. The measurements show high spatial and temporal mass-balance variability both within the two groups and, of course, between the blue-ice and snow groups. The measured net balance for each stake is presented in Table 1. The range of net balance values during the 14 year period along the main flowline is from –186 ±36 mm w.e. a–1 at stake 1 at the eastern end of the blue-ice area, to 208±132 mm w.e. a–1 at stake 17 on the snow ridge.

Fig. 3. Cumulative net balances for 26 stakes in Scharffenberg-botnen. Group 1 consists of the blue-ice stakes, and group includes the snow stakes. Only the stakes at sites that are close to equilibrium have survived the full 14 years. The highest accumulation rate is found on the snow ridge between the blue-ice areas (stakes 4 and 17).
The variation of the average annual net balance along a flowline ending near stakes 2 and Bi4/5, close to the bottom of the southeastern depression of the main blue-ice field (see Fig. 2), is presented in Figure 4. The figure shows that net balance along the line is positive only at the snow ridge separating the main blue-ice field from the smaller blue-ice depression. The year-to-year variationin net balance expressed by the ratio of the standard deviation to the mean is also largest at the snow ridge.

Fig. 4. A 6 km section of the surface profile of a flowline starting from the bottom of the southeastern depression of the main blue- ice field (see Fig. 2). A snow ridge separates the main blue-ice area from the smaller blue-ice field at the northwestern entrance to the valley. The stakes located close to the flowline are marked. The horizontal distance between the stakes marked and the centre line varies between 30 and 990 m, being 460m on average. The average annual net balance at the stakes over the period 1988–94 are shown with standard deviation of the measurements.
The areas of observed net accumulation over the 14 year period are also those where snowdrift is transported by the dominant easterly winds (Reference BintanjaBintanja,2000).The relative year-to-year variability in net balance is smaller on blue ice than on snow-covered areas (Table 1), perhaps because ephemeral snowdrift affects stake measurements on snow, but not on ice where snow accumulation is occasional. The highest annual variations in the net mass balance were observed on the western side of the valley, and on the snow ridge separating the main blue-ice field from the small blue-ice depression.
Trends
We calculated the linear trend in balance for each stake over the entire period. For each stake we looked at the difference, at each measuring time, between the long-term linear trend and the actual value of the ablation or accumulation, i.e. the residual balance. The residuals in each group of stakes were fitted with the simplest non-linear function (a quadratic) with robust (or least-squares) estimation methods. Calculating 95% confidence limits to the quadratic curve allows any significant changes in balance trend over the whole period to be investigated. Figure 5 shows the results in water equivalent (w.e.) assuming a snow density of 400 kg m–3. Each group is now discussed in turn.

Fig. 5. (a) Residual ablation for ice stakes (and those mostly ice) with a robust quadratic fit and 95% confidence interval. (b) Residual accumulation for snow stakes (actual accumulation minus linear trend at each stake) with a robust quadratic fit and 95% confidence interval.
Blue ice
The 1990 data were excluded from the analysis for stakes located on snow in that year, since the snow depth was not measured. Results of the residual analysis are shown in Figure 5a and suggest no change in ablation rate with time for the stakes on blue ice.
The mean ablation rate for the blue-ice stakes was –78±48 mmw.e. a–1 (13 stakes) in 1988–94 and –20±12 mmw.e. a–1 (5 stakes) in 1988–2002 (Table 1). The difference does not indicate a change in ablation rate but is actually determined by the location of the stakes that remained until 2002. None of the 12 stakes that survived the whole 14 year period on blue ice are located in the most severe ablation area, which is at the bottom of the depression at the southeastern end of the valley. Thus, the blue-ice ablation rate calculated for the whole period represents the ablation rate fairly close to the equilibrium zone (see Fig. 2).
In an attempt to extend the observation period for the southeastern end of the main blue-ice field, we also remeasured, in 2000 and 2002, a pair of stakes installed in 1998 in the vicinity of stake 2 (Bi4/5 in Fig. 1and 2). Bi4/5 was about 360 m from stake 2,690m from stake 1 and about 510m from stake 21 (Fig.1). The surface elevation of Bi4/5 was about the same as that of stakes 2 and 21 (±5m) and about 10m higher than that of stake 1. Since the pair of stakes were located only 2 m apart and thus represent ablation almost at the same point, we use an average value for the ablation rate measured from them. The measured ablation rate for Bi4/5 for the period 1998–2002 was –146±4mmw.e.a–1. The ablation rate at stakes 1, 2 and 21 for the period 1988–94 was –111±28 mm w.e. a–1. This result suggests that the ablation rate at the southeastern end, i.e. in the area with the highest ablation rate in the main blue-ice field, may have increased during the 14 year observation period, while close to the equilibrium zone it remained constant. However, the errors are large and the difference is just about at the 95% confidence level.
An inverse relation between the ablation rate and the ice-surface elevation was found in Scharffenbergbotnen even though the variation in the blue-ice surface elevation is only 40 m (Fig. 6). The change in ablation rate was about 23 mmw.e. a–1 for a 10 m elevation change. Stake 50, located at the bottom of the depression, and stakes Bi4/5 were excluded from the calculation. Stake 50 stands at a site where surface meltwater gathers and refreezes, and Bi4/5 was measured over a different observational period.

Fig. 6. The annual net balance for 11 stakes in the main blue-ice field in Scharffenbergbotnen vs the surface elevation in the period 1988–94. Stakes 50 and Bi4/5 were excluded from the trend-line calculation. Refreezing of the meltwater decreases the net ablation at stake 50. Bi4/5 was measured only in 1998–2002. The elevations for stakes that were not found and measured in 2000 are taken from Reference Naruse and HashimotoJonsson (1992).
Snow
The stakes on snow show a relative decrease in accumulation in the middle of the observing period, and a significant increase over the latter part of the period, particularly in the last 2 years (Fig. 5b).
Large temporal variations in net balance have been reported in the vicinity of the Scharffenbergbotnen valley (Reference Holmlund, Isaksson and KarlenHolmlund and others, 1989; Reference Naruse and HashimotoJonsson, 1992; Reference JonssonIsaksson and Karlen, 1994). The net accumulation within 20 km of Scharffenbergbotnen in 1988–89 was only one-third of the value in 1989–90 (Reference Holmlund, Isaksson and KarlenHolmlund and others, 1989; Reference Naruse and HashimotoJonsson, 1992). The 1990 increase in accumulation is also observable in the data from the Scharffenbergbotnen valley, when some of the blue-ice group of stakes were even found on snow. A similar thing was observed in 2002.
Four of the snow stakes (stakes 6,11,16 and 24) show net ablation over their whole observation period. All these stakes are at the margins of blue ice. The average net mass balance for them is –6±7mm w.e. a–1. The proximity of blue ice increases the sublimation rate on the snow, mainly because the surface temperatures are significantly higher on blue ice than on snow (Takahashiand others, 1994; Reference BintanjaBintanja and Van den Broeke, 1995). Thus, the surface temperature is probably higher at the blue-ice/firn transition zone than on snow further away. The negative net balance on these snow stakes suggests that the area of the blue-ice field will tend to grow. However, short-term fluctuations in the extent of one particular blue-ice area are believed to be an indication of changes in surface wind speed (Reference BintanjaBintanja,1999).
Velocity
The maximum horizontal flow velocity in the main blue-ice field was 30 ± 2 cm a–1 at stake 3 close to the equilibrium line of the main blue-ice field. At the southeastern end of the blue-ice field the velocity is about half this value. The velocities indicate a mass influx from the east/northeast, right outside the northwestern entrance of the valley, where the horizontal velocity was about 117 ± 2 cma–1 from the east/northeast at stake 6. The value is approximately twice as large as that reported earlier (Reference Van RoijenVan Roijen, 1996; personal communication from P. Holmlund, 1992). The reason for this difference is unclear.
The vertical velocities were not measured over the blue-ice area since they are too small to be observed by the DGPS in such a short time period. Even if there was an increased net ablation over the blue-ice area, a reduced upward velocity could lead to the disappearance of the blue-ice area in the longer term through an increased transport of firn to the area. However, the time-scale for this kind of process is probably somewhat longer than for mass-balance effects on blue-ice areas.
Error Estimation
The accuracy of each stake length measurement is ±5mm. Year-to-year variations can be partially caused by variations in the length of the measurement period, by temporary changes in the snow cover and by change in weather. The stakes could not be measured every year. When they were, logistical limitations sometimes prevented them from being measured at the end of the summer period or at exactly the same time of the year. For an individual year, this can lead to significant errors since the average summer ablation rates in blue ice are significantly higher than the average annual rates (Reference Faure, Buchanan and ElliotFaure and Buchanan, 1991; Reference Bintanja and vanden BroekeBintanja and others, 2001). The results obtained from bare blue ice may also include an additional error due to the rippled surface typical of blue-ice areas. The wave height of the ripples increases throughout the summer, as most ablation occurs in the wave troughs (Reference Bintanja and vanden BroekeBintanja and others, 2001). The stakes were measured in relation to the level of the highest points of the surrounding ripples. This method has been found to underestimate the true ablation on bare blue ice by 6–15% (Reference Bintanja and vanden BroekeBintanja and others, 2001). Large temporary changes in surface snow conditions in the blue-ice areas have also been reported during the summer seasons, and at the ice/snow margin the surface conditions may have changed from year to year. All these errors disappear, however, when many years of data are considered.
Originally the stake net was well distributed in order to observe the general features of the mass balance and the average net balance in the area. However, stakes installed in the accumulation area and the area of the highest ablation values are now lost, so the average net balance value of the area now best represents the net balance in the areas close to the equilibrium line.
Discussion
There is a relation between annual ablation rate and altitude for various blue-ice areas (Reference BintanjaBintanja, 1999). Scharffenbergbotnen is a blue-ice area at 1200ma.s.l., and the observed ablation rate is at the lower limit of expected values for its altitude. An inverse relation between the ablation rate and the ice-surface elevation that has also been reported from other blue-ice areas (Reference Budd and ŌuraBudd,1967; Reference Faure, Buchanan and ElliotFaure and Buchanan, 1991) is observed in the main blue-ice field in Scharffenbergbotnen. We observe a gradient of about 25 cmw.e. per 100 m elevation change (Fig. 6) compared with only about 2.5 cm w.e. per 100m observed by Reference Faure, Buchanan and ElliotFaure and Buchanan (1991). The difference is probably due to the strong heating effect of the steep rock walls around Scharffenbergbotnen. We also observed that the distance to the rock correlates with the ablation rate for blue ice. In the Scharffenbergbotnen valley, the distance between most of the stakes and the rock increases with increasing elevation. Thus, it is difficult to estimate which part of the decrease in ablation rate is due to the increase in elevation and which part to the increase in distance to rock outcrops. It seems likely that rock heating dominates in comparison with other blue-ice areas.
Taken together, the results indicate that there has been little trend in net balance over the period studied. This, however, maybe a logical consequence of the fact that survival of stakes near the equilibrium line biases the data towards that region. What is most interesting, however, in terms of blue-ice area sensitivity to climate change, is to study changes in the snow/blue-ice transition zone. There is some indication of a recent increase in accumulation in the snow-covered areas. Simultaneously, there appears to be an increase in ablation rates in the peak ablation area of the blue-ice area, while no change has occurred near the equilibrium zone. Increased ablation is expected in a warmer climate since the sublimation rate increases with increasing incoming longwave radiation (Reference Bintanja, Reijmer and HulscherBintanja and Van den Broeke, 1995). The increased snow precipitation onto the blue ice can decrease the sublimation rate only temporarily since any snow on blue ice tends to be blown away efficiently by gusty winds (Reference BintanjaBintanja, 2001). This enables a negative surface mass balance to be maintained on blue ice by sublimation. Since there are so few measurements on blue ice and none in the area of highest ablation rates over the whole 14year period, it is impossible to estimate whether the observed slight increase in the average net balance in snow in the Scharffenbergbotnen valley is balanced by the decreased values of net balance in bare blue ice.
Large spatial and temporal variations in net accumulation have been observed in Dronning Maud Land. Reference Isaksson and KarlenIsaksson and Karlen (1994) discuss snow-accumulation variations in Dronning Maud Land between 1975 and 1988. The observation point closest in that period to Scharffenbergbotnen was 27 km to the northwest of the valley, and showed a decreasing trend in the observation period. On the other hand, Isaksson and Karlen also found a 12% increase in accumulation from the period 1957–74 to 1975–88. Reference Takahashi, Ageta, Fujii and WatanabeSommer and others (2000) found no trend in accumulation rates in Dronning Maud Land for the last few decades, but variability on decadal time-scales was about 20%. Large accumulation trends have been reported in several other places in Antarctica, and both trend and decadal-scale variation may be related to the Antarctic Oscillation (AAO) index (Reference Van RoijenThompson and Wallace,2000). The large trend in the AAO over recent decades is presumably driven by the decrease in stratospheric ozone, intensifying the polar stratospheric vortex which leads to stronger westerly winds and to changing precipitation patterns in much of Antarctica. The rather striking changes due to AAO trends contrast markedly with the observations presented here, which seem to show only minor changes or none at all. Indeed the equilibrium zone appears to have undergone no change over the 14 year period of the observations, during which the AAO has been declining at about 3%a–1.
Concluding Remarks
The mass-balance results for the Scharffenbergbotnen blue-ice area can be summarized as follows:
-
(1) Changes in accumulation and ablation rate have been slight. There is a marginally significant increase in snow accumulation over the latter part of the 14 year observation period (at the 95% confidence level).
-
(2) There is a similarly marginally significant increase in ablation in the blue-ice area farthest from the equilibrium zone.
-
(3) The snow/blue-ice transition zone shows no change over the whole period of observation, and the ablation rate shows no change over the 14 year period.
The results ofdirect stake measurements suggest that the mass-balance gradient in Scharffenbergbotnen may have become steeper during the period 1988–2002, but the equilibrium line has not changed. This may indicate that the blue-ice areas are relatively stable to change in accumulation rate, and possibly temperature. Since there are only a few detailed mass-balance studies on Antarctic blue-ice areas and since the time series are still relatively short, it is important to continue the direct net balance studies in order to obtain a longer time series to verify this presumption.
Acknowledgements
We would like to thank J.Vehvilainen for all his help in the field. We are also grateful to those who made the field measurements during the various Swedish Antarctic Research Programme (Swedarp) expeditions to Antarctica in the period 1988–98, and to D. P. Zwartz for the field measurements in 2002. The 1999–2002 field logistics were provided by the Finnish Antarctic Research Programme (FINNARP) 1999–2002. The work is funded by the Finnish Academy. We also thank two anonymous reviewers for helpful comments.


