


Implication
In this study, we compared the efficiency of three widely used imputation algorithms, fastPHASE, BEAGLE and findhap, using Chinese Holstein cattle genotyped with the Illumina BovineSNP50 BeadChip (Illumina Inc., San Diego, CA, USA). We found that the three methods showed comparable accuracy when the proportion of masked single-nucleotide polymorphisms (SNPs) was low. However, the difference became larger when more SNPs were masked. BEAGLE performed the best and was most robust with imputation accuracies >90% in almost all situations. Our research is helpful for imputing genotypes from low- to high-density genotyping platforms.
Introduction
The recent development of high-throughput systems for genotyping single-nucleotide polymorphisms (SNPs) has led to an extraordinary amount of research activities. With the availability of low- (Illumina Bovine 3K or BovineLD, San Diego, CA, USA), medium- (Illumina BovineSNP50, San Diego, CA, USA) and high-density (Illumina BovineHD, San Diego, CA, USA) SNP platforms in dairy cattle, imputation of high-density genotypes from low- or medium-density platforms is a promising way to promote genomic selection based on different SNP platforms in dairy cattle (Weigel et al., Reference Weigel, Van Tassell, O'Connell, VanRaden and Wiggans2010; Zhang and Druet, Reference Zhang and Druet2010).
Several imputation methods based on various statistical models, such as the haplotype clustering algorithm (Scheet and Stephens, Reference Scheet and Stephens2006), the hidden Markov model (HMM; Browning and Browning, Reference Browning and Browning2007), the Expectation Maximization (EM) algorithm (Qin et al., Reference Qin, Niu and Liu2002; Scheet and Stephens, Reference Scheet and Stephens2006) and the Markov Chain model (Li et al., Reference Li, Willer, Ding, Scheet and Abecasis2010), have been proposed. The accuracy of imputing missing genotypes using different haplotype reconstruction methods has been mostly compared using real data in humans (Marchini et al., Reference Marchini, Howie, Myers, McVean and Donnelly2007; Pei et al., Reference Pei, Li, Zhang, Papasian and Deng2008; Nothnagel et al., Reference Nothnagel, Ellinghaus, Schreiber, Krawczak and Franke2009; Shriner et al., Reference Shriner, Adeyemo, Chen and Rotimi2010; Weigel et al., Reference Weigel, Van Tassell, O'Connell, VanRaden and Wiggans2010). In dairy cattle, studies have been conducted to investigate the accuracy of imputation from low- to high-density using real SNP data sets from cattle populations (Weigel et al., Reference Weigel, Van Tassell, O'Connell, VanRaden and Wiggans2010; Zhang and Druet, Reference Zhang and Druet2010; Berry and Kearney, Reference Berry and Kearney2011); however, comparisons between prevailing methods commonly used in human populations have not been carried out in these studies.
The objective of this study was to investigate the imputation accuracy and computational requirements of three widely used imputation algorithms in animals, fastPHASE (Scheet and Stephens, Reference Scheet and Stephens2006), BEAGLE (Browning and Browning, Reference Browning and Browning2007) and findhap (VanRaden et al., Reference VanRaden, O'Connell, Wiggans and Weigel2011). We simulated scenarios with different masking SNP rates using Illumina BovineSNP50 genotypes of Chinese Holstein cattle to mimic different density SNP panels in order to evaluate their performance of imputing genotypes from low to high density. Factors affecting imputation accuracy were also studied. The results of this study are expected to be helpful in guiding the application of imputation methods in genomic selection and genome-wide association studies in Chinese dairy cattle, especially when using low- or medium-density platforms to select parents of the subsequent generation.
Material and methods
Data
A total of 2180 Chinese Holstein cattle (87 bulls and 2093 cows) were genotyped using the Illumina BovineSNP50 BeadChip (Illumina Inc.). The SNP data were edited using the following procedures: (1) SNP genotypes with Mendelian inheritance errors were treated as missing; (2) SNPs with call rates <0.90 or minor allele frequency (MAF) <0.01 were removed; and (3) cattle with call rates <0.90 were deleted. After selection, 2108 cattle (87 bulls and 2021 cows) and 45 727 SNPs remained on all chromosomes; the proportion of missing SNPs was low, 0.58% on average after quality control. Pedigree errors of 241 sire–daughter pairs were detected on the basis of the 45 727 remaining SNPs using program Cervus (Marshall et al., Reference Marshall, Slate, Kruuk and Pemberton1998). After pedigree correction, 13 of the 87 bulls were sires of all 2093 genotyped cows (each bull had 83 to 358 daughters with an average of 150), and the other 74 bulls did not have any genotyped progeny; there were no sibship or parent/grandparent relationships among 87 bulls.
The 2108 cattle were divided into a reference population and a test population to evaluate the performance of different imputation methods. The reference population consisted of all bulls and half of the cows (randomly selected), whereas the test population consisted of the remaining half of the cows. The individuals in the reference population kept their original genotype data, whereas in the test population various proportions of SNP genotypes were masked. The masked SNPs were then imputed from the genotype information provided by the reference population. Three chromosomes, BTA1, 16 and 28, were used to represent large, medium and small chromosome size, respectively.
To make a comprehensive comparison of different imputation methods, different proportions (20%, 40%, 80% and 95%) of masked SNPs in the test population were simulated by randomly masking the existing genotypes on the three chromosomes. For the masking proportion of 95% on BTA16, three additional structures/sizes of the reference population were considered: (1) 87 bulls only; (2) 87 bulls and 101 cows; and (3) 87 bulls and 401 cows. The corresponding remaining cows for each reference population would be the test population. For each scenario, 10 replicates were simulated, and, in each replication, SNPs were randomly masked at the assigned proportion.
At the moment, Illumina has marketed two low-density Bovine SNP chips. The original 3k (Bovine3K) has been replaced by the BovineLD with 6909 (7k) SNPs (Boichard et al., Reference Boichard, Chung, Dassonneville, David, Eggen, Fritz, Gietzen, Hayes, Lawley, Sonstegard, Van Tassell, VanRaden, Viaud-Martinez and Wiggans2012). We used the real SNP information on 3k and 7k chips, in which ∼5% and 13% SNPs on a 50k chip (BovineSNP50) are drawn equally from each chromosome, respectively. Therefore, the results from BTA1, 16 and 28 are still representative for the comparison of different imputation methods.
Imputation methods
Three widely used imputation methods were evaluated in our study:
(1) fastPHASE: fastPHASE uses a localized haplotype clustering algorithm (Scheet and Stephens, Reference Scheet and Stephens2006). It assumes that haplotypes of individuals in the population tend to cluster into groups of closely related or similar haplotypes within a short region of a chromosome. This method allows memberships of clusters to vary along the chromosome based on an HMM. Missing genotypes are sampled on the basis of allele frequencies estimated from reference haplotypes, and then an EM algorithm is used to estimate parameter values to infer missing genotypes. The computing time of the fastPHASE algorithm increases linearly with the number of ungenotyped individuals and the number of haplotype clusters (Weigel et al., Reference Weigel, Van Tassell, O'Connell, VanRaden and Wiggans2010). The clusters represent groups of closely related haplotypes. Its value is defined by parameter K in fastPHASE v1.4. In our study, two values of K, 20 and 30, were applied.
(2) BEAGLE: BEAGLE is also a localized haplotype clustering-based algorithm (Browning and Browning, Reference Browning and Browning2007). First, it gathers haplotype clusters at each marker and defines an HMM to find the most likely haplotype pairs based on the known genotypes of each individual. At that time, the most likely genotype at the missing genotype loci could be deduced from final haplotype pairs. Both BEAGLE and fastPHASE use an HMM approach to cluster haplotypes. However, some slight differences exist between them. First, fastPHASE estimates parameters for cluster configuration using an EM algorithm, whereas BEAGLE uses empirical frequencies. Second, unlike fastPHASE, which relies on a fixed number of haplotype clusters to form underlying hidden states in the Markov Chain, BEAGLE allows the cluster number to dynamically change to better fit localized linkage disequilibrium (LD) patterns (Pei et al., Reference Pei, Li, Zhang, Papasian and Deng2008). According to the recommendation by Browning and Browning (Reference Browning and Browning2007), the default 10 iterations are enough to obtain a high accuracy for BEAGLE. In this study, the program BEAGLE 3.3 was used and the number of iterations of the phasing algorithm was set to 20.
(3) findhap: Different from fastPHASE and BEAGLE, which mainly deal with a sample of unrelated individuals, a pedigree-based algorithm is implemented in findhap v2.0 (VanRaden et al., Reference VanRaden, O'Connell, Wiggans and Weigel2011). The program is designed to integrate the population with pedigree haplotyping. The process starts with dividing each chromosome into segments and creating a list of haplotypes from genotypes in the first round. In continued iterations, earlier created genotypes are matched again using haplotypes that occurred later. The first two iterations mainly focus on population haplotyping: only the highest density genotypes are used in the first iteration, and then all genotypes are used in the second iteration. After population haplotyping, haplotypes are matched by using both pedigree and population in the following two iterations. In this study, the program was run with 20 iterations to capture a higher accuracy. As reported by VanRaden et al. (Reference VanRaden, O'Connell, Wiggans and Weigel2011), the length of haplotype segments could affect the imputation accuracy and computing time. Here the maximum and minimum lengths of haplotype segments were defined as 100 and 50 for the scenarios with 20%, 40% and 80% missing SNPs and as 600 and 75 for the scenario with 95% missing SNPs, respectively.
Accuracy of imputation
In each replicate, imputation accuracy was measured as the percentage of correctly imputed genotypes in the test population. A correctly imputed genotype was defined as complete concordance between the original and the imputed genotype of a masked SNP locus. We calculated average imputation accuracy rate and standard error across all masked loci on each chromosome for 10 replicates.
Computing time of the three programs was measured in hours for fastPHASE and BEAGLE and in seconds for findhap on a Linux cluster (2.0 GHZ Intel Xeon processor and Redhat Enterprise 4.1) with three computation nodes.
Results
The detailed information of SNPs on BTA1, BTA16 and BTA28 is listed in Table 1. Generally, the three chromosomes have almost the same average interval between SNPs (about 56 kb apart), equal average SNP call rate (0.98) and similar average LD level (r 2) between adjacent SNPs (0.21 to 0.28). After randomly masking 20% to 95% of SNPs on each chromosome in the test population, the number of available SNPs ranged from 2301 to 143 for BTA1, from 1093 to 68 for BTA16 and from 658 to 41 for BTA28.
Table 1 Genomic information of three bovine chromosomes in Chinese Holstein
SNP = single-nucleotide polymorphism; LD = linkage disequilibrium.
Comparison of imputation accuracy
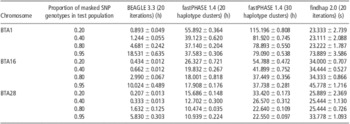
The results of comparison of BEAGLE, fastPHASE and findhap are shown in Table 2. In general, for all three methods, the imputation accuracy decreased along with the increase in the proportion of missing SNPs. BEAGLE performed best and yielded accuracies >90% in all cases. When the proportion of masked SNPs was low, for example, 20% or 40%, fastPHASE performed slightly better compared with findhap. However, when more SNPs were masked, fastPHASE performed worse than findhap. In particular, when the proportion of masked SNPs increases to 95%, the accuracy from fastPHASE is 20% and 14% lower than that of BEAGLE and findhap on average, respectively.
Table 2 Average imputation accuracy from BEAGLE, fastPHASE and findhap at different masked SNPs rate based on 10 replicates

SNP = single-nucleotide polymorphism.
In fastPHASE, haplotype clusters represent groups of closely related haplotypes. In this study, we set 20 and 30 haplotype clusters to determine their influence on the imputation accuracy of fastPHASE. As shown in Table 2, the imputation accuracy of fastPHASE could be improved by increasing the number of haplotype clusters, although the improvement was very slight in all situations; in addition, the computing time was doubled as shown in Table 3.
Table 3 Computing time of BEAGLE, fastPHASE and findhap at different masked SNPs rate based on 10 replicates
SNP = single-nucleotide polymorphism.
For each scenario, we made 10 replicates, and it is demonstrated that all imputation methods yield very small standard error in most situations, showing that these methods perform robustly in genotype imputation. Moreover, for each method, the imputation accuracies for the three chromosomes were almost identical in the case with the same proportion of masked SNPs. For instance, the accuracies for BTA1, BTA16 and BTA28 from BEAGLE were 0.986, 0.984 and 0.981, respectively, when 20% SNPs were masked. Similarly, fastPHASE and findhap showed similar robustness as well. This is expected as the average SNP interval, SNP call rate and LD level on the three chromosomes are almost equal (see Table 1).
Table 4 shows the performance of the three methods in imputing genotypes from Illumina Bovine3K (3k) and BovineLD (7k) to BovineSNP50 (50k). For all three approaches, accuracy of imputing genotypes from 3k to 50k was higher than for the scenario of randomly masking 95% SNPs. This could be because high MAF and higher concentrations at the ends of the chromosomes were criteria for SNP selection for the Illumina chips. When imputing genotypes from 7k to 50k, the accuracy of BEAGLE was >0.96 across three chromosomes, more accurate than that from 3k to 50k. This is similar to reports from Boichard et al. (Reference Boichard, Chung, Dassonneville, David, Eggen, Fritz, Gietzen, Hayes, Lawley, Sonstegard, Van Tassell, VanRaden, Viaud-Martinez and Wiggans2012). They reported that the accuracy of imputing genotypes from 7k to 50k was about 0.97 for Australian Holstein without a sire in the reference population (Boichard et al., Reference Boichard, Chung, Dassonneville, David, Eggen, Fritz, Gietzen, Hayes, Lawley, Sonstegard, Van Tassell, VanRaden, Viaud-Martinez and Wiggans2012). The performance of fastPHASE and findhap showed a similarity tendency, although their accuracies were still lower than that of BEAGLE. In all situations, BEAGLE yielded high and stable accuracy.
Table 4 Imputation accuracy from BEAGLE, fastPHASE and findhap at Illumina 3k (Bovine3K) and 7k (BovineLD) chip
SNP = single-nucleotide polymorphism.
Computing time
All three programs were run on a Linux cluster (CPU 2.0 MHZ) with three computation nodes. BEAGLE and fastPHASE can use only one processor, whereas findhap can utilize a maximum of seven processors simultaneously by implementing a parallel computing algorithm. The mean computing time and standard errors of different imputation algorithms for BTA1, 16 and 28 are listed in Table 3. fastPHASE required much more computing time than the other two methods, and its computing time increased markedly when the number of haplotype clusters increased from 20 to 30. findhap was the fastest and could accomplish imputation within 1 min in all cases.
The number of SNP markers also probably influences computing time. For example, BTA1 had 2054 more SNPs compared with BTA28, and hence the average computing time for BTA1 was greater than that for BTA28. Another factor affecting computing time is the proportion of masked SNPs in the test population. With 20% masked SNPs, fastPHASE needed much more computing time than with 95% masked SNPs. However, an opposite tendency was observed in BEAGLE, in which the time increased with the increase in masked SNP proportion. For findhap, the influence of masked SNP proportion was negligible when it was 20% to 80%. However, with 95% masked SNPs, findhap needed slightly more time than did other missing levels.
Scale of reference population
Reference population size was taken into account to evaluate the efficiency of imputation methods. As shown in Table 5, the imputation accuracy from BEAGLE and findhap was improved with increased reference population size. Particularly for BEAGLE, its accuracy increased from 0.68 to 0.90 when the reference population was increased from 87 bulls to 87 bulls and 1011 cows, whereas a smaller improvement by 6% was obtained for findhap. Compared with BEAGLE and findhap, performance of fastPHASE was very stable with the lowest accuracy in most situations; almost no differences were observed when the size of the reference population was increased. It is notable that the accuracy from findhap was 8% and 10% higher than those from fastPHASE and BEAGLE when the reference population was composed of 87 bulls only. One possible reason is that the 2021 cows in the test population are daughters of 13 bulls in the reference population, and findhap can utilize the pedigree information.
Table 5 Average imputation accuracy of BEAGLE, fastPHASE and findhap with different reference population size in scenario of randomly masking 95% genotypes on chromosome 16
Discussion
Imputation accuracy
There are already several reports on the performance of BEAGLE and fastPHASE (Pei et al., Reference Pei, Li, Zhang, Papasian and Deng2008; Li et al., Reference Li, Willer, Sanna and Abecasis2009; Marchini and Howie, Reference Marchini and Howie2010) that show that fastPHASE performs slightly better than BEAGLE in human populations. However, the population structure in cattle is different, and the data reported by Li et al. (Reference Li, Willer, Sanna and Abecasis2009) involved only 5% masked SNPs. In our study, we compared mainly BEAGLE, fastPHASE and findhap in scenarios with a high proportion of masked SNPs in order to evaluate their performance when imputing genotypes from low- to high-density genotyping platforms. Our results indicated that BEAGLE performed best and was most robust almost in all situations. fastPHASE was severely affected by the proportion of masked SNPs, especially when the masked SNP proportion was high. The observation that BEAGLE outperformed fastPHASE is consistent with the results in humans seen in the study by Browning and Browning (Reference Browning and Browning2007). The comparison of three methods when imputing genotypes from Illumina Bovine3K (3k) and BovineLD (7k) to BovineSNP50 (50k) further indicated that BEAGLE yielded higher and more stable accuracy. Our study also found that 7k chip is an ideal low-density genotyping platform for imputing.
Our results are very similar to those of Berry and Kearney (Reference Berry and Kearney2011), who imputed genotypes from the 3k panel to the 50k panel in Holstein–Friesian cattle using Beagle. The concordance between the actual and imputed genotypes in the test group of animals did not vary across chromosomes and was on average 95%. As they used a larger reference population with 4732 animals and 764 animals as the test group, the accuracy they obtained was slightly higher than ours. Similar to BEAGLE, fastPHASE also uses an HMM approach but with several differences that have implications for speed and accuracy. fastPHASE fixes the number of haplotype clusters in the model, whereas BEAGLE is more flexible and dynamically varies the number of clusters at each region. findhap was originally designed for genotype imputation in livestock and takes pedigree information into account. However, it seems that for dairy cattle these could not make it better than BEAGLE. The possible reason for BEAGLE's outperformance is that the HMM is to some extent superior to other algorithms (Li et al., Reference Li, Willer, Sanna and Abecasis2009), and the improvement in accuracy from pedigree information is tiny when LD is high enough.
Marker density
Some investigators observed that imputation accuracy increased with higher marker density (Pei et al., Reference Pei, Li, Zhang, Papasian and Deng2008; Druet and Georges, Reference Druet and Georges2010). With denser genotyped markers around missing SNPs, more information could be used to construct haplotypes and deduce the missing SNPs, and therefore better imputation efficiency is expected. As the slope of imputation accuracy decreased markedly with increasing marker density, the benefit of increasing marker density is more obvious for low-density regions (Druet et al., Reference Druet, Schrooten and de Roos2010).
The effect of marker density is essentially transformed into that of LD by the fact that denser markers usually cause stronger patterns of local LD, which will help improve imputation accuracy (Yu and Schaid, Reference Yu and Schaid2007). The result of imputation is population dependent, as different test populations have different LD levels. For example, the LD level (r 2) in Jersey is 0.38 (Weigel et al., Reference Weigel, Van Tassell, O'Connell, VanRaden and Wiggans2010), whereas it is about 0.25 in our test population. Using almost the same imputation approach (fastPHASE with 30 haplotype clusters), when masked SNP proportions were 20%, 80%, and 95%, the imputation accuracies reported by Weigel et al. (Reference Weigel, Van Tassell, O'Connell, VanRaden and Wiggans2010) were 0.017, 0.034, and 0.065 higher than those obtained by us, respectively.
Compared with the SNPs distributed in the middle of a chromosome, imputation errors appeared more often in SNPs located at the beginning or end of the chromosome. This is because the marker imputation relies on surrounding markers, whereas the imputation for SNPs at both ends can use information only from one side. Druet et al. (Reference Druet, Schrooten and de Roos2010) observed 2% higher error rates at both ends than in the middle of a chromosome in Dutch Holstein, especially for markers in the first or last 10 SNPs of a chromosome. In our study, we also found that the mean imputation error rate for markers at the first or last 5% SNPs of a chromosome was 0.04% to 0.4% higher than that for markers in the middle of the chromosome. Boichard et al. (Reference Boichard, Chung, Dassonneville, David, Eggen, Fritz, Gietzen, Hayes, Lawley, Sonstegard, Van Tassell, VanRaden, Viaud-Martinez and Wiggans2012) found that increased concentrations of SNPs at the ends of the chromosomes were helpful to improve imputation accuracy; it was an additional reason for BovineLD imputation to be more accurate than Bovine3K imputation, in addition to the increased overall density of the BovineLD chip compared with Bovine3K.
Computing time
The vital advantage of findhap is that it saves an enormous amount of computing time. VanRaden et al. (Reference VanRaden, O'Connell, Wiggans and Weigel2011) reported that findhap took 2 h for 33 414 Holsteins with 43 385 actual markers, and for the same population the time increased only by 2.5 h even with 500 000 simulated markers. Compared with findhap, fastPHASE and BEAGLE run much slower, as they are both localized haplotype clustering-based HMM approaches, and a large amount of time is required for Monte Carlo Markov Chains (MCMC) iterations. Between fastPHASE and BEAGLE, fastPHASE requires substantially more intensive computation, as it takes into account all observed genotypes when imputing each missing genotype, whereas BEAGLE usually focuses on genotypes for a small number of nearby markers when imputing each missing genotype, which makes BEAGLE computationally more efficient (Li et al., Reference Li, Willer, Sanna and Abecasis2009). This is further supported by our results. Moreover, the number of haplotype clusters also influences the computing time of fastPHASE severely. Our results showed that when the haplotype clusters were increased from 20 to 30 the computing time was doubled, although the improvement in accuracy was slight. Therefore, the balance between computing time and imputing efficiency for fastPHASE should be considered.
Generally speaking, the magnitude of the computing time in fastPHASE is due to its EM algorithm, which is used to estimate genetic parameters and haplotype frequencies, whereas BEAGLE just adapts empirical frequencies to save computing time. However, with less SNP genotypes, the step of EM to find final likelihoods and parameters accelerated in fastPHASE. Because BEAGLE produces posterior genotype probabilities for imputed genotypes, when the number of ungenotyped SNPs is increased, the amount of calculation, including sampling haplotypes and producing posterior genotype probabilities, is correspondingly increased. As shown in our results, although fastPHASE runs slowest in all situations, the computing time was shortened with the increase in the masked SNP proportion, whereas the computing time for BEAGLE and findhap was increased. One alternative solution to decreasing the computing time for BEAGLE and fastPHASE is parallel processing of the chromosome, as findhap implements a parallel computing algorithm.
Reference population size
For the situation with 95% missing SNPs, we changed the reference population size to investigate its influence on imputation accuracy. The size of the test population was correspondingly decreased when the reference population size was increased. The results showed that enlarging the reference population improved the imputation accuracy for BEAGLE but did not affect fastPHASE. Similar results were found by Zhang and Druet (Reference Zhang and Druet2010); in their study, the imputation accuracy of DAGPHASE (Druet and Georges, Reference Druet and Georges2010) increased when the number of reference individuals was increased,whereas with CHROMIBD (Druet and Farnir, Reference Druet and Farnir2011) almost no differences were observed. Druet et al. (Reference Druet, Schrooten and de Roos2010) observed only small gains in imputation accuracy when the reference population was enlarged with >1000 genotyped individuals. In addition to the reference population size, the relatedness among animals in the reference and test population also affects the imputation accuracy; although we did not consider it in this research, it can be done in future studies.
In summary, BEAGLE performed the best and was robust in genotype imputation compared with fastPHASE and findhap. In the scenario of low-masked SNP proportion, fastPHASE, findhap and BEAGLE were comparable, and findhap was more efficient because of its fast computing algorithms. Although fastPHASE and findhap performed worse with the increase in proportion of missing SNPs, BEAGLE continued to maintain higher accuracy in such situations; it is more reliable for imputing genotypes from low- to high-density genotyping platforms.
Acknowledgment
The project was supported by Ph.D. Programs Foundation of Ministry of Education of China (Grant No. 20110008110001) and the Recommend International Advanced Agricultural Science and Technology Plan of China (Grant No. 2011-G2A), National Dairy Industry System in Beijing Team, Scientific Research Foundation for Returned Scholars, Ministry of Education of China, Program for Changjiang Scholar and Innovation Research Team in University (Grant No. IRT1191).


 Open access