Culture is a multifaceted concept. But, one approach that has achieved some prominence in political science defines “culture” as the set of values that are salient within a given society. Building upon this idea, a heterogeneous nation like the United States could easily generate a variety of distinct and different value orientations within its population. If these differing value structures imply mutually exclusive social arrangements and societal goals, they could produce the kinds of fundamental disagreements that have been characterized as “culture wars” in recent scholarly and popular commentary. This article provides an empirical investigation of these ideas, using some unique data obtained from the 2006 Cooperative Congressional Election Study.
The analysis below will use individual value choices as the raw material to create a structural model of the predominant value preferences that exist within the American mass public. The model, itself, is a geometric representation with features that are fairly intuitive and easy to interpret. And, the elements of the model are amenable to systematic analysis using a set of statistical tools that are designed for use with angular data.
The results from the empirical analysis provide strong evidence for the culture wars hypothesis. Americans’ value choices are highly heterogeneous, with many conflicting preferences about fundamental principles like freedom, equality, and the like. Furthermore, the variability breaks down along social and political lines. These findings have important implications for understanding the nature of conflict and disagreements within the contemporary American political system.
The remainder of the article is organized as follows: The next section introduces the basic concepts addressed in this study and considers why existing research may leave some important questions unanswered. The two sections after that develop the geometric model used to represent individual value choices and describe the data that are used in the analysis. The three sections after that present the empirical analysis by estimating the geometric model of American political culture, examining the religious and political foundations of variability in value choices, and assessing the sources and magnitude of value conflict. Finally, the concluding section considers this study’s implications for scholarly understandings of values-based cultural disagreements and emphasizes the clearly political nature of the culture war that does seem to exist in twenty-first century America.
BACKGROUND
Culture is critically important to an understanding of public opinion because it provides the context within which political beliefs and attitudes exist (Bennett Reference Bennett1980). In effect, culture delimits the “boundaries” of legitimate opinions within a society (Wildavsky Reference Wildavsky1987). While such statements emphasize the importance of culture, they beg the question of what culture really is.
Culture, Values, and Politics
In fact, there are several theoretical perspectives on culture that exist within the political science literature. The classic description of American culture is liberalism tempered by democracy, as originally described in detail by Tocqueville and extolled by more recent theorists such as Hartz (Reference Hartz1955) and Katznelson (Reference Katznelson1996). Critics, however, charge that the emphasis on liberal democracy masks a variety of cultural challenges that have arisen throughout American history, generally from groups that do not enjoy the full benefits of liberal society. So, for example, Rogers Smith argues that “the distinctive feature of American political culture has not been its liberal, republican, or ‘ascriptive Americanist’ elements but, rather, (a) more complex pattern of apparently inconsistent combinations of traditions . . .(Reference Smith1993, 558).”
From an empirical perspective, Almond and Verba’s early (Reference Almond and Verba1963), but still influential, comparative work emphasizes societal orientations toward political contenders and the institutions of power within a polity. Culture, itself, emerges from the particular combination of individual orientations (which Almond and Verba classified as participant, subject, and parochial) that exists in a given society. Inglehart (Reference Inglehart1997) argues that cultures vary according to the degree to which basic human needs are met. Societies can be arrayed along a continuum that ranges from those in which attempts to address basic human needs dominate everyday life to cultures in which higher levels of socioeconomic well-being enable citizens to focus on post-material values of self-fulfillment. Still another distinctive view of culture is provided in the work of Douglas and Wildavsky (Reference Douglas and Wildavsky1982), who argue that societies inevitably experience two distinct dimensions of social organization, which they call “group” and “grid.” The former involves the degree to which people view themselves as individuals or members of a collective social entity, and the latter focuses on the degree to which people are autonomous decision-makers or limited by externally imposed constraints (e.g., Ripberger, Jenkins-Smith, and Herron Reference Ripberger, Jenkins-Smith and Herron2011).
The preceding theories all provide distinctive views of culture, and each has generated a voluminous literature. But, a common thread across these different lines of work is that culture is manifested in the values that are salient in a society. Values, themselves, are defined at the individual level as each person’s abstract conceptions about the desirable and undesirable end-states of human life (Rokeach Reference Rokeach1973; Schwartz Reference Schwartz, Seligman, Olson and Zanna1996; Schwartz and Bilsky Reference Schwartz and Bilsky1987). Thus, political culture could be viewed as the general framework of values that characterizes the orientations of a nation’s citizens.
Culture is also an important source of the issues that arise in day-to-day political life (e.g., Gastil et al. Reference Gastil, Braman, Jahan and Slovic2011). Within the bounds defined by cultural standards, there is likely to be conflict because the desirable end-states implied by values are, to varying degrees, mutually exclusive of each other. That is, the consequences of attaining one value (e.g., freedom) will almost certainly restrict the degree to which some other desirable end-state is achieved (e.g., equality).
This basic tenet of societal interaction explains why values are of fundamental importance to politics. Philosophers, collective action theorists, and policy analysts agree that issue conflict inherently involves clashes of competing value systems (e.g., Berlin Reference Berlin1969; Chong Reference Chong2000; Stone Reference Stone2012). As stated in David Easton’s well-known phrase, politics involves disagreements about the “authoritative allocation of values (Easton Reference Easton1965, emphasis added).”
Culture War?
Despite the potential for conflict based upon values, the traditional view is that the United States is characterized by a general consensus on fundamental orientations (Dahl Reference Dahl1989; Devine Reference Devine1972; McClosky and Zaller Reference McClosky and Zaller1984). Recently, however, the existence of this societal consensus has been called into question. Various commentators have suggested that a “culture war” exists, in which “. . .Americans are taking sides in a civil war between incompatible views of the American way of life (Baker Reference Baker2005, p. 65).” Sociologist James Hunter provided one of the first systematic statements of the culture wars hypothesis: “The divisions of political consequence today are . . .the result of differing worldviews. . . . (The conflict revolves) around our most fundamental and cherished assumptions about how to order our lives—our own lives and our lives together in this society (Reference Hunter1991, p. 42).” Thus, Hunter succinctly points out that the culture war is disagreement about basic value orientations and also that it has immediate political consequences.
The idea of a culture war definitely has had great resonance in American electoral politics over the past two decades. In his famous speech to the 1992 Republican National Convention, Patrick Buchanan stated:
There is a religious war going on in this country. It is a cultural war, as critical to the kind of nation we shall be as the Cold War itself. For this war is for the soul of America.
While more recent candidates have not used the specific term as freely, they have focused directly on many of the themes associated with cultural conflict, such as abortion, contraception, gay rights, global warming, and traditional lifestyles. As evidence of this, the 2012 primary battles within the Republican party were often heralded by the press as a direct manifestation of the culture war (e.g., Henderson Reference Henderson2012; Schlesinger Reference Schlesinger2012). Journalists continued using this theme on into the general election campaign (e.g., Gerson Reference Gerson2012; Stein and Terkel Reference Stein and Terkel2012), with a prominent New York Times article declaring that the culture war has now moved in “from the fringe” to become a central issue in American electoral politics (Nagourney Reference Nagourney2012).
Outside the electoral setting, the rise of the Tea Party movement can be seen as another manifestation of themes often associated with the culture war. Meckler and Martin (Reference Meckler and Martin2012) and Skocpol and Williamson (Reference Skocpol and Williamson2012) both emphasize that Tea Party activism stems from a belief that American society has abandoned the ideas espoused by the founders. The Tea Party perspective is a distinctive worldview among a subset of American society, organized largely around opposition to other subgroups that they believe to be fundamentally inconsistent with traditional American values and culture—in short, precisely the same idea that is subsumed within the current usage of the term, “culture war.”
While there has been a substantial literature devoted to the culture war hypothesis, the empirical evidence that has been mustered and the scholarly interpretations that have been offered are highly mixed. For example, some researchers identify fundamental contradictions in the moral and religious orientations of subgroups within the American population. These differences are rooted in conceptions about the nature and objectives of human life (e.g., Barker, Hurwitz, and Nelson Reference Barker, Hurwitz and Nelson2008; Barker and Tinnick Reference Barker and Tinnick III2006; Guinness Reference Guinness1993; Hunter Reference Hunter1991; Lakoff Reference Lakoff2002). Similarly, a number of political scientists have pointed to sharp increases in the polarization of recent American political discourse and attitudes within the mass public (e.g., Abramowitz and Saunders Reference Abramowitz and Saunders2008; Layman, Carsey, and Horowitz Reference Layman, Carsey and Horowitz2006) as symptomatic of unusually profound disagreements about the direction in which American society should be moving. Barker and Carman (Reference Barker and Carman2012) make an even broader argument that the culture war has profound effects on public understandings of politics, creating sharp and consequential differences in preferences for representational styles.
In contrast to these findings of conflict, a number of sociologists raise pointed questions about the validity of the culture war hypothesis (e.g., Williams Reference Williams1997; Wolfe Reference Wolfe1998). For example, Evans (Reference Evans1996) argues that traditional theories about differences among status groups account for patterns of opinion disagreement more accurately than do accounts of fundamentally conflicting worldviews across polarized segments of society. Similarly, both DiMaggio, Evans, and Bryson (Reference DiMaggio, Evans and Bryson1996) and Davis and Robinson (Reference Davis and Robinson1996) provide evidence that the extent of polarization has been overstated, with sharp disagreements confined only to specific issues with explicit religious implications. From a somewhat different perspective, Baker (Reference Baker2005) employs the World Values Survey to show that Americans are united on fundamental principles and he concludes that “. . .the culture war is largely a fiction (p. 109).”
Some political scientists also emphasize the continued importance of centrism for understanding American public opinion. Fiorina, Abrams, and Pope (Reference Fiorina, Abrams and Pope2006) have been the most vocal advocates of this position, stating that allegations of a culture war in America “. . .range from simple exaggeration to sheer nonsense (Reference Fiorina, Abrams and Pope2006, 8).” Gelman (Reference Gelman2008) similarly questions the validity of dividing the United States into a dichotomy of “red states” and “blue states.” He argues that a more accurate picture of electoral conflict would emphasize the mixed orientations that characterize virtually all parts of the country.
Limitations of Previous Research
Scholars definitely express strong disagreements about the existence of a culture war. But, none of the previous efforts have really gotten to the heart of the issue, for several reasons: First, it is difficult to deny that some polarization exists in public opinion and political preferences. And while this could be a manifestation of a culture war, it may also have arisen from other causes. For example, Levendusky’s (Reference Levendusky2009) theory of partisan “sorting” provides an explanation for the existence of greater ideological clarity in Democratic and Republican ranks that does not require stronger contrasting views on the two sides.
Second, a culture war may not be manifested clearly in political issues. Skocpol and Williamson (Reference Skocpol and Williamson2012) show that Tea Party activists often support policies and legislation that are not associated with conservatives (e.g., Social Security, Medicare, and generous benefits targeted toward identifiable needy groups in society), despite their distinctive views about the problems of American society and politics. Thus, it is not entirely clear that disagreements about specific policy issues map cleanly onto the divisions that should be associated with a culture war.
Third, most of the research on polarization in American politics focuses on unidimensional ideological or partisan conflict. However, fundamental sociopolitical orientations are typically depicted with multidimensional structures. For example, the value configurations presented by Rokeach (Reference Rokeach1973) and Schwartz (Reference Schwartz, Seligman, Olson and Zanna1996) are both two-dimensional, with the former organized according to support for liberty and equality, and the latter structured by support for change and relative concern for self versus others. Several researchers have also argued for multidimensional conceptions of ideology, with distinctions between economic cleavages on the one hand and moral/social distinctions on the other (Swedlow and Wyckoff Reference Swedlow and Wyckoff2009; Treier and Hillygus Reference Treier and Hillygus2009). Similarly, culture theories generally posit multiple cleavages that exist simultaneously. So, Inglehart (Reference Inglehart1997) finds two dimensions, tapping distinctions between religious versus secular and traditional versus post-material societies. And, the Douglas-Wildavsky (Reference Douglas and Wildavsky1982; Wildavsky Reference Wildavsky1987) culture theory uses the group and grid dimensions to identify four separate, potentially conflicting, citizen orientations that exist simultaneously: hierarchs, individualists, egalitarians, and fatalists. The problem is that it may not be possible to transform these kinds of complex preferences and orientations onto a single bipolar dimension like the liberal-conservative continuum. If so, then research that focuses on the latter will inevitably miss elements of any culture war that may exist.
Fourth, works that have approached the culture war hypothesis from a perspective based on values may have measured the latter in ways that are not fully consistent with the ways that values impinge on human behavior. Much of the social scientific research on values and public opinion is based upon data in which people rate the importance of individual values (e.g., Feldman Reference Feldman1988; Baker Reference Baker2005; Goren, Federico, and Kittilson Reference Goren, Federico and Kittilson2009). The problem with this approach is that longstanding psychological theories hold that specific values do not operate in isolation from other values. Instead, people maintain feelings about multiple values, with comparisons between values providing the cues for how to behave in any situation where the values have relevance (e.g., Rokeach Reference Rokeach1973; Schwartz Reference Schwartz, Seligman, Olson and Zanna1996; Schwartz and Bilsky Reference Schwartz and Bilsky1987; Verplanken and Holland Reference Verplanken and Holland2002). This view is becoming increasingly prominent in political science as well (e.g., Ciuk and Jacoby Reference Ciuk and Jacoby2014; Davis and Silver Reference Davis and Silver2004; Inglehart Reference Inglehart1997; Jacoby Reference Jacoby and Sniderman2006; Peffley, Knigge, and Hurwitz 2001; Searing Reference Searing1978; Sniderman et al. Reference Sniderman, Fletcher, Russell and Tetlock1996; Swedlow and Wyckoff Reference Swedlow and Wyckoff2009).
In order for values to provide such guidance, people must have feelings about the relative importance of different values. And, since it is assumed that people have feelings about multiple values, this leads naturally to the idea that they possess rank-ordered value structures in which values are mentally arrayed from most important to least important. The exact ranking of the values differs from one person to the next (Rokeach Reference Rokeach1973); that is precisely what leads to variability in human behavior. Individuals engage in activities that promote values near the top of their own importance ranking and avoid activities associated with values near the bottom of their respective hierarchies (Schwartz Reference Schwartz, Seligman, Olson and Zanna1996).
Extrapolating from individuals to the societal level, a nation’s political culture is characterized by the value structures that predominate within its society. If these structures are similar from one person to the next, the political culture will be consensual. But, if structures vary markedly—producing serious disagreements about which values are important and which values are not—then it could signal the kind of fundamentally conflicting worldviews that characterize a culture war. Again, however, none of the previous research on this topic has examined directly the structure of value choices in the American public.
A GEOMETRIC MODEL OF INDIVIDUAL VALUE CHOICES
In order to construct a model of political culture (or at least that component of political culture that is rooted in values), we must have information about the individual value structures that exist within the society under investigation. These value structures are manifested in each person’s importance rankings for a common set of values, all of which are salient within the culture. The analytic problem is to represent individuals’ rank-ordered value choices across the entire mass public in a compact and comprehensible manner.
I will use a geometric approach to accomplish the preceding objective: Values will be shown as points and individuals as vectors within a common space. The points and vectors are arranged so that, to the greatest extent possible, each vector points toward the values that the individual believes are most important, and away from those that he or she considers to be least important. More precisely, each person’s vector will be oriented such that his/her importance ratings for the values are monotonically related to the order in which the value points project onto his/her vector.
Figure 1 shows a very simple example of such a model, based upon hypothetical information about two individuals’ (labeled “1” and “2”) feelings about three values (labeled “A,” “B,” and “C”). A table containing the raw data is shown in the top half of the figure. There, we can see that individual 1 says value A is most important, value C is second-most important, and value B is least important. In contrast, individual 2 rates B, A, and C, from most to least important. The bottom half of the figure shows a two-dimensional geometric space that is consistent with the information from the individuals’ rank-orders for the values; the space contains three points representing values A, B, and C along with two vectors for individuals 1 and 2. The dotted line segments running from the value points to the two vectors show the perpendicular projections.Footnote 1 Notice that, starting from the terminal point of each vector (i.e., the end with the arrowhead), the order of the projections corresponds to the entries in each row of the data matrix. On individual 1’s vector, the projection for value A comes first, followed by C and then B. On individual 2’s vector, the projection for value B is closest to the tip, followed by those for values A and C, respectively.

FIGURE 1. Hypothetical Example of Geometric Model to Represent Value Importance Rankings
Any real model will contain far more than two vectors and more than three points. In fact, a much larger dataset than this simple example is necessary in order to fix the relative positions of the vectors and points. But, the basic principle for locating these geometric elements remains the same: The vector orientations relative to the point locations must conform to the individuals’ rankings of the values.
This kind of model has several advantageous features. First, the structuring of the values (as represented by the point configuration) is determined empirically; it is not based upon any a priori specification of how the values differ from each other. This is important because it ensures that the model represents the ways that people actually do think about the respective values, rather than the researcher’s preconceived theoretical expectations. Second, the model incorporates and represents each person’s full importance ranking across the entire set of values. This is critical because it provides a succinct depiction of individual value structures which, when aggregated, characterize the predominant culture within a society. Third, the input data for the model are simple rank-orders, which should be fairly easy for survey respondents to provide. But, the projections from the value points onto the individual vectors have metric properties, which means that they reveal information about relative degrees of importance that individuals assign to the respective values. Finally, the individual vector orientations comprise directional data which possess features (to be explained below) that facilitate analysis of variability in value preferences.Footnote 2
DATA
The vector model of value choices will be fitted to data drawn from the 2006 Cooperative Congressional Election Study (CCES), an internet survey carried out by Polimetrix, Inc. The component of the survey used here involves a nationally representative sample of 1,000 American adults.Footnote 3 The CCES interview schedule contains items that elicit information about respondents’ general political orientations, issue attitudes, and sociodemographic characteristics. But, more important for present purposes, the post-election wave of the 2006 CCES asked respondents to rank-order the importance of seven values: Freedom; equality; economic security; morality; social order; individualism; and patriotism. These particular values were used because of their relevance to the philosophical foundations of the American political system along with their salience in contemporary political discourse.
The procedure for obtaining rank-ordered value choices was first used in a political science context by Jacoby and Sniderman (Reference Jacoby and Sniderman2006). During the internet survey, the CCES respondents were presented with a screen showing the following statement:
On the next few screens, we will show you a list of values, such as freedom, equality, and so on. Nearly everyone agrees that all of these values are important. However, sometimes we have to choose one value over another. From the list of values, please select the single value that you think is the most important.
Starting with the next screen, respondents used radio buttons to select the most important value from the list that appeared on the screen. The order of the values in the list was randomized for each respondent. But, the contents of the list for the full set of seven values is shown in Table 1. After selecting the most important value from the list of seven, the respondents were shown another screen that started with the question, “Now, of the values that remain, which one would you say is the most important?” The question was followed by a list of the six values that were not chosen on the preceding screen. This process was repeated, successively eliminating chosen values from the list, until respondents were asked to choose from a list of only two values. Of course, the final, nonchosen value falls at the bottom of each respondent’s rank-order.
TABLE 1. Values and Definitions Shown to Respondents in Post-Election Wave of the 2006 Cooperative Congressional Election Study. In the Actual Administration of the Survey, the Order of the Values was Randomized Across Respondents

As Table 1 shows, respondents were also given a brief definition of each value. Obviously, these values represent very complex and multifaceted ideas; it is almost certainly impossible to encapsulate a complete understanding of any one of these values into a single short phrase. But, it seems likely that most citizens react to these values as symbols with heuristic utility (e.g., Bennett Reference Bennett1980) rather than as highly nuanced philosophical constructs. Still, individuals could vary widely in their personal ideas about the meanings of specific value terms. Such interpretational variability could be confounded with variability in the feelings of personal importance about the values. To avoid this problem, it has become accepted practice in empirical values research to provide definitions for values, in order to reduce extraneous variability in the responses (Sears, Huddy, and Schaffer Reference Sears, Huddy and Schaffer1983).
The empirical analysis will be confined to the 775 CCES respondents who gave complete rank-orders. Among these, there are 623 distinct orderings that show up in the data. Thus, there is a great deal of heterogeneity in choices across individuals.
Some scholars have expressed concerns that rank-orders may force respondents to choose among values that they believe to be equally important (e.g., Alwin and Krosnick Reference Alwin and Krosnick1985; Maio et al. Reference Maio, Roese, Seligman and Katz1996). Fortunately, this does not appear to be a serious problem, either as a general aspect of value rankings or with the particular rank-orders used in the present study. Ciuk and Jacoby (Reference Ciuk and Jacoby2014) use the method of triads (i.e., respondents are presented with all subsets of three values from a set of values, and asked to identify the most- and least-important value in each subset) on national-level survey data obtained through the TESS Program to obtained replicated comparisons between pairs of values. Their results show that the vast majority of survey respondents provide value choices that are consistent across replications and transitive across choices, neither of which would be the case if people feel indifference or ambivalence and, therefore, are unable to make “real” choices (also see Jacoby and Ciuk Reference Jacoby and Ciuk2014). Furthermore, inconsistent and intransitive value choices are most likely to occur among less sophisticated respondents—precisely where the quality of survey responses is most likely to be compromised (Jacoby Reference Jacoby and Sniderman2006). Jacoby (Reference Jacoby2011) also exploits the panel study nature of the 2006 CCES to show that the value rankings used in the present study (which were collected during the second panel wave) are highly consistent with rankings constructed from the same respondents’ pairwise value choices obtained in the first panel wave using the method of triads. In summary, individual value rankings do appear to provide reasonably accurate empirical representations of the respondents’ “true” value choices.
Table 2 provides some initial descriptive information. Specifically, the table gives the distribution of rank scores for each of the values. For a given value, the rank score gives the number of values that are ranked lower than that value in an individual’s full rank-order. Freedom is the most popular value, with the highest percentage of placements in the most important position (25.81%) and the fewest in the least important position (only 8.9%). In contrast, individualism has the largest percentage of least important placements (by a wide margin, at 33.55%) and the smallest number of placements in the most important position (only 4.9%). It is difficult to perceive any clear patterns in choices among the values that fall between these two extremes. Instead, it is probably accurate to say simply that nontrivial percentages of the respondents placed each of the values at each of the possible positions within the rank-order hierarchy. Is there any systematic structure within the full set of individual value choices? This is where the multidimensional preference model should provide useful insights, through its ability to represent succinctly the large amount of information contained in the 775 rank-orders.
TABLE 2. Distribution of Importance Ranks for the Seven Values

Note: Cell entries in table are column percentages. The number of observations is 775. For each value, the rank score indicates the number of values that were ranked lower than that value in an individual’s importance ranking for the full set of seven values.
EMPIRICAL RESULTS
Preliminary analysis indicated that a two-dimensional model would be appropriate for the CCES data on value choices. The R 2 for the two-dimensional representation is 0.804, showing that it accounts for four-fifths of the total variance in the optimally scaled value importance rankings.Footnote 4 The two-dimensional model is advantageous because it is amenable to visual inspection. In order to facilitate interpretation, the individual vectors are adjusted to a length of one. Hence, the vector terminal points will all fall along a unit circle. This adjustment has no substantive effect since the order in which the value points project onto the vectors is the same, regardless of the vector lengths.
The Configuration of Values
The estimated model is shown in Figure 2. Looking first at the value point configuration (shown by the labeled, solid points), the general rule for interpretation is that the distances between the points are related to the similarity with which the corresponding values are rated by the CCES respondents. Points that are close together represent values that receive similar importance rankings; those that are far apart tend to fall at markedly different positions in the importance ranks. From the figure, it appears that the seven values fall into three clusters (although one of these clusters is composed of a single point). First, freedom, equality, and economic security form a group near the right side of the central region. This is perfectly reasonable, since the first two values comprise the central elements in the American creed (e.g., Devine Reference Devine1972, McClosky and Zaller Reference McClosky and Zaller1984) while economic security is increasingly recognized as a vital precondition for achieving the maximum benefits from American society (e.g., Gilens Reference Gilens2012; Hochschild Reference Hochschild1995).
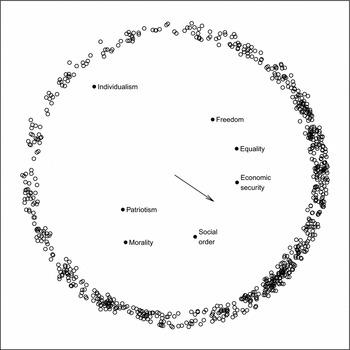
FIGURE 2. Full Model of Value Preferences
Notes: Value points are shown as solid circles. Only the terminal points of the individual respondent vectors are shown (as open circles). Vector terminal points are jittered to facilitate visual perception of relative concentrations of vectors around the unit circle. Figure also shows the mean direction vector, which is oriented about 34 degrees below the horizontal (or − 0.594 radians). The mean resultant length, ${\Rbar}$
, is 0.321.
${\Rbar}$
, is 0.321.
A second group falls in the lower-left area, with patriotism and morality falling quite close to each other, and social order a little farther away, but still part of this cluster. This grouping, too, is understandable. Patriotism and morality are themes that play a prominent role in conservative rhetoric (e.g., Critchlow Reference Critchlow2011). And while social order is generally desirable for most people, it has long been a more salient concern on the political right than on the left (e.g., Rossiter Reference Rossiter1962).
Finally, the point for individualism is widely separated from the others, in the upper left of the space. This distinct positioning is due to the low rankings that it received from most of the respondents.Footnote 5 Nevertheless, it is slightly closer to the first group of points than to the second, perhaps reflecting the fact that individualism is also an important element of American cultural symbolism (Kluegel and Smith Reference Kluegel and Smith1986; McClosky and Zaller Reference McClosky and Zaller1984).
Individual Importance Rankings
Figure 2 also shows the terminal points for the vectors representing the individual respondents. (The shorter vector shown explicitly in the figure will be explained in the next section). Again, they are arrayed around a unit circle in the same space as the value points. Each vector terminus is shown as a small open circle; note that the terminal points are jittered to break up the exact plotting locations. This makes it easier to discern the variations in the concentrations of vectors around the space.
As already explained, the order of the projections from the value points onto each vector corresponds to that individual’s ranking of the values’ importance. For present purposes, we are particularly interested in the angular separations between vectors. The smaller the angle between any two vectors, the more similar the value rankings of the two individuals and vice versa. In fact, the cosine of the angle between any two vectors is equal to the correlation in the predicted value rankings for those two people. Hence, vectors separated by angles less than 90 degrees represent positively correlated rankings while those separated by angles greater than 90 degrees correspond to negatively correlated rankings. Two collinear vectors pointing in the same direction (i.e., an angle of zero) would indicate a correlation of 1.0, while two collinear vectors pointing in opposite directions (i.e., an angle of 180 degrees) would indicate a perfect negative correlation, − 1.0.
The most prominent feature in the figure is the extreme variability in value choices, represented by the spread of vectors around the entire circumference of the circle. Far from consensus on basic values, the estimates in this model suggest that there is widespread disagreement about which values are more or less important. Looking closely at the jittered vector terminal points, there appear to be three areas that have relatively dense clusters of vectors. One of these occurs in the upper right quadrant of the unit circle, around the “2:00 position.” People represented by vectors in this area rank freedom, equality, and economic security highest, followed by social order, and then some combination of individualism, patriotism, and morality. A second concentration of vectors falls in the lower right quadrant, between the 4:00 and 5:00 positions. While there is quite a bit of variability within this group, these people tend to rank social order highest, followed by morality and economic security. Patriotism and equality come next, with freedom just below that, and individualism once again appearing at the lowest position within most of their rank orders. The third cluster of vectors falls in the lower left quadrant; again, there is some variation within this general concentration, with one group near the 7:00 position and others spread out almost to the 9:00 position. The individuals in this general cluster are distinctive in that they rank morality, patriotism, social order, and individualism over the other three values.
The three clusters of individual vectors in Figure 2 are consistent with the culture theory of Douglas and Wildavsky (Reference Douglas and Wildavsky1982; Wildavsky Reference Wildavsky1987) and its relationship to ideology. For example, the first grouping of vectors (in the upper-right) reflects their individualistic and egalitarian orientations, with the former on the upper side of the cluster (i.e., closer to the 12:00 position) and the latter on the lower side (closer to the 3:00 position). The value rankings in the second cluster (i.e., within the lower-right of the figure) are consistent with the hierarchical orientation. The third cluster—the vectors arrayed within the lower-left of the figure—does not fit neatly into the fourfold classification from culture theory. But, it may reflect the separate communitarian perspective that was suggested by Janda, Berry, and Goldman (Reference Janda, Berry and Goldman2002) and confirmed empirically by Swedlow and Wyckoff (Reference Swedlow and Wyckoff2009).
Culture and Heterogeneity in Value Choices
If culture is defined by the predominant value choices of a society, then how can this be operationalized in the geometric model of value importance rankings? Here, the analysis relies on statistical tools designed specifically for directional data (Schiffman, Reynolds, and Young Reference Schiffman, Reynolds and Young1981). And, since the vectors are normalized to unit length, they are frequently called “circular” data (Gill and Hangartner Reference Gill and Hangartner2010). The approach I will use is to summarize the myriad value choices represented in Figure 2 by taking the mean direction of the individual vectors.Footnote 6 As with any other average, the mean direction is intended to provide the single orientation that “best” reflects the orientations of the full set of vectors.
The length of the mean direction vector (called the “mean resultant length” and denoted $\skew2\overline{R}$
) is also important because it is inversely related to the amount of angular separation in the set of vectors over which the mean is calculated. Because the individual vectors are set to unit length,
$\skew2\overline{R}$
) is also important because it is inversely related to the amount of angular separation in the set of vectors over which the mean is calculated. Because the individual vectors are set to unit length, $\skew2\overline{R}$
can range from 0 to 1. If there is no variation in the directions, then the vectors will all be perfectly collinear, and the mean resultant length will be equal to that of the vectors themselves, or 1.0. Conversely, there are a number of situations that will result in a mean resultant length of zero; for example,
$\skew2\overline{R}$
can range from 0 to 1. If there is no variation in the directions, then the vectors will all be perfectly collinear, and the mean resultant length will be equal to that of the vectors themselves, or 1.0. Conversely, there are a number of situations that will result in a mean resultant length of zero; for example, $\skew2\overline{R} = 0$
when half of the vectors have mirror image vectors that point in exactly the opposite direction. Thus, the smaller the mean resultant length, the greater the heterogeneity in value choices.
$\skew2\overline{R} = 0$
when half of the vectors have mirror image vectors that point in exactly the opposite direction. Thus, the smaller the mean resultant length, the greater the heterogeneity in value choices.
Along with the terminal points for the individual vectors, Figure 2 shows the actual mean vector for the full set of CCES respondents. Perhaps the most salient feature of the mean vector is its short length, at $\skew2\overline{R} = 0.321$
. This figure just confirms the previously noted existence of broad heterogeneity in feelings of value importance. There is little in the way of overall consensus about what is most important and what is least important in basic value orientations. American society is characterized by extreme levels of value disagreement rather than broad adherence to a set of common fundamental principles.
$\skew2\overline{R} = 0.321$
. This figure just confirms the previously noted existence of broad heterogeneity in feelings of value importance. There is little in the way of overall consensus about what is most important and what is least important in basic value orientations. American society is characterized by extreme levels of value disagreement rather than broad adherence to a set of common fundamental principles.
The value points project onto the mean vector with economic security first (i.e., most important), followed fairly closely by social order. Equality comes next, followed by freedom, morality, and patriotism; note that these three project very closely to each other, making their relative positions nearly indistinguishable. Individualism falls in last place, by a wide margin. This ordering of the mean importance ranks suggests that, to the extent that there is any common ground at all, the values component of American culture is dominated by the kinds of practical concerns associated with an orderly society in which peoples’ material needs are met, rather than lofty principles, codes of conduct, or feelings of obligation to society.
The array of value projections along the mean vector is somewhat surprising in terms of prior theory. For example, the trailing position of individualism contradicts the salience that this value is generally assigned in the American creed (Kluegel and Smith Reference Kluegel and Smith1986; McCloskey and Zaller Reference McClosky and Zaller1984). Similarly, the clear dominance of economic security belies the post-material nature of American society articulated by Inglehart (Reference Inglehart1997). On the other hand, the results presented here do align nicely with the recent work which demonstrates that Americans really are more sensitive to economic concerns and material well-being than was previously believed to be the case (Gilens Reference Gilens2012; McCall Reference McCall2013). And, the wide variability around the “average” value hierarchy is certainly consistent with the view that American culture is composed of disparate and often-conflicting elements (Smith Reference Smith1993; Wildavsky Reference Wildavsky1987).
RELIGIOUS AND POLITICAL DIFFERENCES IN VALUE CHOICES
But, do these obvious differences in value choices provide evidence of conflict in fundamental value orientations? In other words, is this evidence of a culture war in American society? If so, then the value rankings should vary along systematic and identifiable lines. Some likely axes of conflict include religion (both denomination and degree of commitment) and political orientations (party identification and ideology).
In order to investigate these possibilities, we can examine the mean vectors of subgroups defined by the preceding variables. And we can also exploit the properties of directional data to generate criteria for evaluating the statistical significance of the subgroup differences. The angular variation in a set of vectors can be divided into additive within-group and between-group components; these components can be used to perform an “analysis of angular variation” or ANAVA that is directly analogous to a typical analysis of variance or ANOVA (Schiffman, Reynolds, and Young Reference Schiffman, Reynolds and Young1981).
The results for these subgroup comparisons are shown in Figures 3 and 4. Each panel of the respective figures shows the mean vectors for a particular set of subgroups. Operational definitions for the variables used to create the subgroups are provided in the Appendix. Just as with the vectors for individuals, the differences of the mean value preferences across the groups are summarized in the angle between the respective groups’ vectors; correlations in the mean rankings are still shown as the cosines of the angles between the mean vectors. And, the mean resultant length of each subgroup vector is inversely related to the heterogeneity of the value choices within the subgroups. Note that each of the figures shows exactly the same geometric space. But, the arrowheads of the group vectors and the terminal points of the individual vectors are omitted, and the value points are made smaller in order to emphasize the positions of the subgroup vectors in each panel.

FIGURE 3. Geometric Model of Value Preferences, Showing Mean Vectors for Religious Affiliations and Levels of Religious Commitment

FIGURE 4. Geometric Model of Value Preferences, Showing Mean Vectors for Party Identification and Ideology
Figure 3 illustrates how religion affects value choices. The first panel shows denominational differences in the mean vector orientations. Here, self-identified Protestants and Christians rank social order, economic security, and morality at the high end. In contrast, the mean vector for people with no religious affiliation shows greater emphasis on equality and freedom, along with economic security. Catholics, Jews, and people who placed themselves in the “Other” category fall in between these patterns, with the former two denominations more like Protestants and other Christians, and the latter more like the nonaffiliated. The differences are statistically significant, with an observed probability value from the ANAVA that is effectively zero. But, even though the value rankings of the denominations differ, it is not entirely accurate to say that they conflict.
The logic behind the previous statement is as follows: Differences in value rankings exist anytime the correlation between two rank-orders is less than 1.0. But, positive correlations indicate that the two value orderings are relatively similar to each other. That is, values that fall at high positions in one ranking also tend to fall at high positions in the other ranking, and vice versa. The values just do not all fall at exactly the same position in both rank-orders. Geometrically, positively correlated rank-orders imply that the angle between the two vectors is greater than zero but less than 90 degrees. On the other hand, conflict in value rankings occurs when the rank-orders are negatively correlated with each other, indicating that values falling at high ranks in one ordering tend to fall at low ranks in the other ordering (and vice versa). The latter would be represented in the geometric model as vectors separated by angles larger than 90 degrees.
Returning to the first panel of Figure 3, the angles between the mean vectors for all denominational groups are less than 90 degrees. This shows that each religion’s average value choices are different from, but not opposed to, those from other religious groups. In fact, the smallest correlation in average value rankings is still a fairly robust 0.290 for Protestants and those with no affiliation. Thus, even the biggest differences in value orientations across religions are just not that pronounced.
The differences show up more starkly when we turn to religious commitment in the second panel of Figure 3. This variable measures the salience of religion in the respondents’ lives, and for purposes of the figure, it has been collapsed to four categories. The resultant mean vectors show clearly that value orientations change systematically across different levels of religious commitment. People who report little involvement with religion place equality, economic security, and freedom at the top of their importance hierarchies, with individualism, patriotism, and morality near the bottom. In contrast, heavily committed individuals tend to rank morality and social order highest (by a substantial margin) with freedom and especially individualism at the lowest levels importance, also widely separated from the other values. The differences across the groups are definitely significant (ANAVA observed probability value of 0.000). But, the most contrasting average value hierarchies are more accurately characterized as unrelated, rather than actively opposed: the correlation between the mean vectors for people with the lowest and highest levels of religious commitment is − 0.061.
The results in Figure 3 are particularly interesting, because religious orientations are frequently identified as the basic foundation of the culture war in modern America. Based upon this evidence, such an interpretation seems to be overstated. It is certainly the case that people with different religious backgrounds value different things. But, it would be an exaggeration to say that their values are fundamentally opposed to each other.
Figure 4 breaks down the individual value hierarchies according to symbolic political orientations. This is where clear evidence of opposing value hierarchies comes to the forefront. In both cases, the differences are statistically significant (the observed probability values for the ANAVA F statistics are effectively zero). The mean vectors for the opposing political groups are separated by angles that are substantially greater than 90 degrees, showing that their average value rankings are negatively correlated with each other. Specifically, the correlation between the mean value hierarchies for Republicans and Democrats is − 0.446, while that for liberals and conservatives is − 0.380. Notice, too, that independents and moderates fall in between the respective opposing groups. But, independents are much more like Democrats than Republicans, and moderates are more like liberals than conservatives.
So, it seems that the clearest evidence for value conflict is associated with differences in political loyalties and orientations. Republicans and conservatives are particularly distinctive from the rest of society in the importance they assign to morality, patriotism, and social order. Democrats and liberals, along with partisan and ideological centrists, place greater emphasis on economic security, equality, and to a somewhat lesser extent, freedom.
Another interesting feature of the two graphs in Figure 4 is the fact that the vectors for Democrats and liberals are both longer than those for Republicans and conservatives, respectively, showing that the former groups are more unified in their value choices than are the latter. At first, this may seem surprising since the Democratic party is often characterized as a coalition of diverse interests, in contrast to a unified Republican party. Nevertheless, the heterogeneity revealed by the relatively short vector for Republicans in Figure 4A could perhaps be a precursor to the extended competition between the conservative and moderate wings of the Republican party during the 2012 presidential primary campaign (Skocpol and Williamson Reference Skocpol and Williamson2012). Similarly, the conventional understanding holds that liberals are much more likely to experience value conflict than conservatives (Feldman and Zaller Reference Feldman and Zaller1992). But, Ellis and Stimson (Reference Ellis and Stimson2012) show that “symbolic” conservatives are actually very heterogeneous in their “operational ideologies,” with many expressing preferences for liberal policy stands on specific issues. The value heterogeneity among conservatives shown in Figure 4B may, in fact, provide a foundation for the varied issue attitudes of self-styled conservatives.
THE SOURCES AND MAGNITUDE OF VALUE CONFLICT
The subgroup comparisons presented so far provide some interesting initial evidence about the ways that religious and political characteristics are related to value orientations. But, they are not sufficient in themselves because they represent bivariate relationships. Furthermore, the subgroups used to break down value choices in Figures 3 and 4 are correlated. Therefore, it is important to examine the simultaneous effects of these and other variables in order to determine whether some combination of them operates jointly to differentiate individual value structures.
In order to evaluate this possibility, I will employ a regression model which explicitly takes into account the fact that the important information about the dependent variable is the angular separation of the respective vectors around the unit circle. This approach, called “circular regression,” was developed by Fisher and Lee (Reference Fisher and Lee1992) and it is presented in a political science context by Gill and Hangartner (Reference Gill and Hangartner2010).Footnote 7
Table 3 contains the maximum likelihood estimates for the circular regression model predicting the orientation of the individual vectors as a function of a set of explanatory variables (definitions for all of the independent variables are provided in the Appendix). Initially, the model also included regressors for gender, race, family income, religious denomination, and region. But, preliminary estimates showed that none of these additional variables have any effect once those in Table 3 are taken into account. Therefore, they are omitted from the reported model.
TABLE 3. Circular Regression Showing the Effects of Social and Political Characteristics on Individual Preference Vector Orientations
Note: Cell entries are maximum likelihood coefficient estimates, standard errors, and probability values for one-sided test of H 0: β j = 0, obtained from circular regression procedure developed by Fisher and Lee (Reference Fisher and Lee1992) and presented by Gill and Hangartner (Reference Gill and Hangartner2010).
The coefficient estimates are treated in a manner similar to any other regression model. μ is the intercept, so it shows the mean vector orientation (in radians, measured from the 3:00 position) when all of the independent variables equal zero. Given the coding of the variables, this would be a nonleaning independent with moderate ideology, of average age, with no college, and the lowest level of religious commitment. Because circular regression is a generalized linear model, the exact values of the other coefficients are not immediately interpretable. But, positive values indicate movement in a counterclockwise direction from μ around the unit circle, while negative values indicate that the variable moves the dependent variable vector around in a clockwise direction.
The empirical results from the circular regression make a great deal of sense in substantive terms. The baseline, μ, is − 0.95. This corresponds to a vector pointing toward the lower right, close to the 5:00 position. Turning to the regression coefficients (all of which are statistically different from zero at the 0.01 level in a directional test), those for the two education variables both have positive values. This shows that any education beyond high school corresponds to counterclockwise movement in the mean vector, or higher importance rankings for economic security, equality, and freedom relative to social order, morality, and patriotism. The remaining four coefficients are all negative, meaning clockwise movement in the mean vectors. Based upon the coding of the variables, this means that older people, those with greater religious commitment, stronger Republican (or weaker Democratic) identifications, and more extreme conservative (or less liberal) self-placements all tend to place greater importance on social order, morality, and patriotism rather than any of the other values.
The independent variables are measured in different units, and education consists of two dummy variables. Therefore, it is tricky to measure the sizes of the respective variables’ effects on value rankings. The easiest way is to simply take the coefficient value times the range for each variable as an estimate of the maximum possible difference in vector orientations due to that variable. Using that strategy, the effect sizes are − 0.53 for age, 0.43 for education (i.e., the coefficient for college graduates, which represents the maximum difference from the omitted reference category of high school graduates or less education), − 0.24 for religious commitment, − 0.65 for party identification, and − 0.84 for ideology. Notice that the variable associated with religion—often identified as the main source of the culture war in America—actually has the weakest net relationship to individual value choices. In contrast, the explicitly political variables, party identification and ideology, have the largest effects, followed by age and education.
While the preceding variables contribute to heterogeneity in feelings about values, are the differences really large enough to justify the claim of a culture war in American society? It is difficult to answer such a question using only the information in Table 3, since the coefficients are not directly interpretable. Instead, we can look at the predicted mean vectors for hypothetical individuals defined by interesting combinations of the independent variables. Specifically, we will begin with the vectors for the two most extreme cases. On one side, there is the youngest strong Democrat, extremely liberal, college graduate with the lowest level of religious commitment; such an individual should produce the largest value for the predicted vector orientation. On the other side, there is the oldest strong Republican, extremely conservative, with a high school education (or less), who is maximally committed to his/her religion; this person would produce the smallest predicted value. After finding these two most extreme vectors, we can take the bisector between them. Then we can take the mean direction of the actual vectors that fall on either side of this bisector. This procedure gives an easy and reasonable way to summarize the extent to which social and political characteristics result in differing value choices.
Figure 5 shows the configuration of value points with the two most extreme vectors and their bisector shown in gray and the mean vectors on each side of the bisector shown as heavy black line segments. Obviously, the two mean vectors point in very different directions; the angle between them is very large, at 130.28 degrees. The projections from the value points onto the two vectors can be interpreted as each value’s average importance for the respective subsets of people. On the right side of the bisector, the mean vector lies approximately in the “2:30” direction; equality projects first on this vector, followed closely by economic security and freedom. Social order falls at an intermediate position, while the projections from individualism, patriotism, and morality all intersect at much lower positions. On the left side of the bisector, the mean vector points in approximately the “7:00” position. Here, morality, patriotism, and social order come first, with the remaining four values projecting at much lower positions. The correlation between the two sets of projections is − 0.646. It is not an exaggeration to say that the most important values for one of these subgroups tend to be the least important for the other subgroup.

FIGURE 5. Geometric Model of Value Preferences, Showing Mean Vectors on Either Side of the Bisector Between the Two Most Extreme Predicted Vectors from the Circular Regression of Vector Positions on Social and Political Characteristics
Note: In this figure, the two most extreme vectors and the bisector between them are shown in gray. The two vectors shown in black are the mean vectors of all individual vectors positioned on either side of the bisector.
Note also that the subgroup mean vectors are both quite long: The vector to the right of the bisector has length 0.735 and the one to the left of the bisector has length 0.682. Recall that the overall mean vector was quite short, with $\skew2\overline{R} = 0.321$
. This is important because mean resultant length is inversely related to the angular separation among the vectors used to calculate the mean. So, these results show that the two subgroups exhibit far less variability in their value importance rankings than does the public as a whole. American public opinion contains two fairly unified sides characterized by value orientations that average out to be near mirror images of each other. This comprises strong empirical support for the culture war hypothesis.
$\skew2\overline{R} = 0.321$
. This is important because mean resultant length is inversely related to the angular separation among the vectors used to calculate the mean. So, these results show that the two subgroups exhibit far less variability in their value importance rankings than does the public as a whole. American public opinion contains two fairly unified sides characterized by value orientations that average out to be near mirror images of each other. This comprises strong empirical support for the culture war hypothesis.
CONCLUSIONS
In this article, I have developed a geometric model to represent the structure of Americans’ choices among a set of core values. The empirical results create a picture of extreme heterogeneity that contradicts any notion of widespread agreement on a set of fundamental principles. The situation does not merely represent differences of degree; instead, the variability in the value rankings is great enough to represent differences in kind. There are widely distributed, almost diametrically opposing views about which values are important and which are not. It seems reasonable to characterize such sharp differences in feelings about fundamental values as the existence of a culture war.
From a theoretical perspective, the results obtained here contradict views of American culture that are based upon widespread consensus regarding a set of core principles (e.g., Devine Reference Devine1972; Hartz Reference Hartz1955). And, they cast serious doubt on arguments that political conflict in America takes place within relatively narrow boundaries of acceptable discourse (e.g., McClosky and Zaller Reference McClosky and Zaller1984, 4). The high average importance rankings for economic security and social order also suggest that the United States has not yet completed the transition to post-materialism (Inglehart Reference Inglehart1997).
On the other hand, the current findings share common ground with theories of culture that posit the existence of mutually conflicting worldviews within society (Douglas and Wildavsky Reference Douglas and Wildavsky1982; Wildavsky Reference Wildavsky1987). This is, in turn, consistent with both pluralistic interpretations of American democracy (Dahl Reference Dahl1989) and the “multiple traditions” perspective on American liberalism (Smith Reference Smith1993). If, as the latter views suggest, widely disparate value preferences have always existed within American society, then why is it appropriate to characterize the situation in the first decade of the twenty-first century as a distinctive “culture war”? I contend that the answer lies in the clarity with which differences in value choices are connected to sociopolitical characteristics of the American mass public.
When subjected to multivariate analysis, several elements of the “conventional wisdom” about an American culture war do not stand up to scrutiny. For one thing, value orientations are not tightly connected to religious affiliations. And, they are only weakly related to the fervor with which individuals commit themselves to religion. So, the empirical evidence just does not signal the presence of a culture war that emanates from a religious divide between fundamentalists and the rest of the American population (e.g., Hunter Reference Hunter1991). At the same time, race—the focus of enormous attention in the political world for many years—does not lead to clear divisions in value choices. This is surprising precisely because there definitely are broad racial differences in opinions on political issues and public policy (e.g., Kinder and Winter Reference Kinder and Winter2001). Nevertheless, basic ideas about the relative importance of core values do not seem to be at the heart of these racial differences.
Several other characteristics that are often believed to correspond to political divisions also show little or no connection to values. For example, there are no systematic differences in the value orientations of males and females, despite ongoing evidence of a gender gap in various elements of American electoral politics (e.g., Kaufmann Reference Kaufmann2006). And, any differences corresponding to income levels or geographic regions disappear once controls are introduced for other factors (McCarty, Poole, and Rosenthal Reference McCarty, Poole and Rosenthal2006). These findings offer a strong counterpoint to recent work that suggests the existence of class warfare (Murray Reference Murray2012) or profound differences due to regional political cultures (Chinni and Gimpel Reference Chinni and Gimpel2010).
In contrast, the analysis shows several ways that values do respond to socialization. There are fairly pronounced differences in value choices across age and education levels. While it is only possible to speculate about the exact causes of these effects, it does seem reasonable to suggest that the time period during which a person “comes of age” has an impact on what he or she believes to be the most important ideas to pursue in life (Jennings Reference Jennings2002). The significant effects of the variables gauging schooling beyond high school indicate that higher education does more than merely provide substantive information and knowledge; apparently, it also instills distinctive ideas about the relative importance of different values (Nie, Junn, and Stehlik-Barry Reference Nie, Junn and Stehlik-Barry1996).
Perhaps the most striking findings involve the strong effects of party identification and ideology. This confirms that personal value hierarchies can serve as structuring principles to organize political ideas. In the past, values were regarded as an alternative to ideology, providing organizational parsimony for political attitudes among people who did not conceptualize the world in abstract terms (Feldman Reference Feldman1988). To the contrary, the present findings suggest that value orientations actually reinforce ideological distinctions. They provide a substantive foundation for what Ellis and Stimson (Reference Ellis and Stimson2012) call “symbolic” ideology. In other words, the consistency between feelings about value importance and liberal-conservative self-placements shows that the latter are not mere labels, unconnected with other orientations.
The results obtained here also reiterate the explicitly partisan nature of political differences in American society; it appears that the two major parties truly do serve as the focal points for the polarization that many observers have identified in recent American politics (e.g., Bafumi and Shapiro Reference Bafumi and Shapiro2009). In fact, the close association between individual values and political orientations may help explain why the polarization, itself, is so pronounced. Stated simply, there is a lot at stake if people connect their partisan affiliations and issue preferences to their basic beliefs about what is good and bad in the world.
Finally, it is reasonable to ask why this study produced such strong evidence for the existence of serious value conflict when a number of other analyses have reached the opposite conclusion, that the culture war is a myth, or at least, largely exaggerated. The main reason for this important departure from previous work lies in the measurement of value choices. The individual rank-orders used in this analysis come much closer to the theoretical concept of personal value structures than do the approaches used by most other researchers. And, psychological theories of values have long asserted that it is structured choices among competing values, rather than individual values considered singly, that make the difference for human behavior. The results presented here bear out that theoretical stance very nicely.
In conclusion, the geometric model developed in this article relies upon relatively complete depictions of individual value choices to produce an empirical representation of a central component in American political culture. In the past, researchers were hesitant to examine rank-ordered value choices because of the apparent difficulties involved in analyzing such data. But, the model here shows that individual differences in value structures can be represented in a very parsimonious manner by the varying orientations of the individual vectors in the value space. It is precisely the wide dispersion of the individual vectors that provides forceful empirical evidence for the existence of a culture war in American public opinion.
APPENDIX OPERATIONAL DEFINITIONS FOR INDEPENDENT VARIABLES
-
Age: Respondents gave their year of birth; that value was subtracted from 2006 to give the age. For the regression analysis, the age variable was centered by subtracting the mean age from each value.
-
Education: Respondents placed themselves into six categories for not completing high school, high school graduate, some college, a two-year college degree, a four-year college degree, and a post-graduate degree.
-
Religious affiliation: Respondents identified themselves as Protestant, Catholic, Jewish, no religion, other Christian, other, and Muslim. Dummy variables were created for the first five denominations. Since there were only two Muslims in the CCES sample, the last two categories are combined.
-
Religious commitment: A summary variable is created by fitting a nonparametric IRT model (i.e., a Mokken scale) to five survey items. The first asked, “Is religion an important part of your life or not?”, the second asked “How many times per week do you pray?”, the third asked “Which of the following statements comes closest to your feelings about the Bible?” (with three possible responses, varying between “The Bible is a book written by human beings” and “The Bible is the actual word of God”), the fourth asked “Do you attend religious services beyond weddings, baptisms, and funerals?”, and the fifth asked “How frequently do you go to religious services?” The commitment variable takes on integer scores from 0 to 12, with larger scores indicating stronger commitment. The full version of the variable is used for the circular regression, but it is collapsed into four categories for the bivariate graphical presentation.
-
Party identification: Branching questions were used to create the standard seven-point party identification variable with successive integers assigned to categories from − 3 = strong Democrat to 3 = strong Republican. For the bivariate graphical presentation, the variable is collapsed to three categories, with partisan leaners coded as independents.
-
Ideology: Respondents located themselves along a 0 to 100 scale (presented as a number line on the computer screen) ranging from 0 for “extremely liberal” to 100 for “extremely conservative. The variable is used in its relatively continuous form for the circular regression (recoded to range from − 3 to +3), but it is collapsed into three categories for the graphical presentation, with liberals as anyone coded 40 or less, moderates from 41 to 59, and conservatives from 60 to 100.
Supplementary Materials
To view supplementary material for this article, please visit http://dx.doi.org/10.1017/S0003055414000380.