


Introduction
In 1995, the USDA Forest Service (FS) reported that there were about 730 million recreation visits annually to National Forest System (NFS) lands, or just under three visits per capita for the U.S. population (U.S. Forest Service 1995). This visitation level implied that recreation accounted for more than 75 percent of the job and GDP effects of all Forest Service programs combined. Unfortunately, the visit figure was readily determined to be not just erroneous but wildly overstated. To the agency's credit, the decision was made to scrap the existing system for reporting visitation and start afresh with a science-based process. That process is the National Visitor Use Monitoring (NVUM) program (English et al. Reference English, Kocis, Zarnoch and Arnold2002). The current NVUM recreation estimate is about 150 million visits annually.
The NVUM program serves two concurrent goals: (1) to estimate the volume of recreation visits to units of the NFS, and (2) to describe salient characteristics of those visits, including activity participation, visit duration, visitor demographics, and visitor satisfaction. The NVUM data are also used to develop estimates of local economic contribution and of consumer surplus values via Travel Cost Modeling. Because it pursues both goals through one sampling effort, the NVUM program is widely recognized as the best and most complete effort of its kind.
Every NFS unit participates in NVUM on a regular 5-year schedule. Visitation is estimated for the entire unit for the entire year. Each year, roughly 23,000 recreation visitors are surveyed. National summary reports are made available as they are completed at https://www.fs.fed.us/about-agency/nvum. Results for each completed survey iteration for each national forest can be viewed through the publicly available results application at https://apps.fs.usda.gov/nvum/results. Tabular displays of visit estimates, as well as all of the visitor descriptions, can be viewed or downloaded. Persons wishing to request individual recreation survey data for their own research efforts can do so via that same application.
In this article, we summarize the NVUM program and some of the ways the data have been used in economic analyses. Specifically, we (1) outline the sampling and visit estimation approaches employed by the program, (2) describe the process used for estimating market (i.e., job and income) effects of recreation visits and describe the process for evaluating the market effects of area closures due to natural disasters, and (3) review use of the NVUM data to estimate nonmarket value of recreation access to national forests.
NVUM Approach
Sampling Frame
A great strength of the NVUM program is its sampling approach. The approach mirrors other agency monitoring, such as for estimating timber volumes or the size of wildlife populations. That is, the NVUM sampling frame is defined temporally and spatially. Estimates of the size of the population of recreation visits is built up from samples drawn from within this sampling framework. The spatial dimension defines the access points that the public uses to get to places to recreate. The temporal dimension is each day in the fiscal year for which visit estimates are developed. The combination of location and time (a site-day) is the primary sampling unit for NVUM.
Recreation staff on each forest follow a consistent process to create the sampling frame for their forest. Using local knowledge of the timing and locations of the pulse of recreation, NVUM gains local acceptance and incorporates unique aspects of each forest. Recreation staff first define the set of sites where traffic could be monitored to estimate visitation. Typically, individual units identify somewhere between 150 and 300 visitor intercept sites.
Four types of sites are recognized in NVUM. Two are for developed sites with moderate to high degrees of development (Figure 1). Day use sites include picnic areas, ski areas, visitor centers, swimming areas, shooting ranges, and swimming areas. Overnight use sites are places used mostly for lodging, such as campgrounds, cabins, lodges, and some privately operated resort facilities located on FS lands.
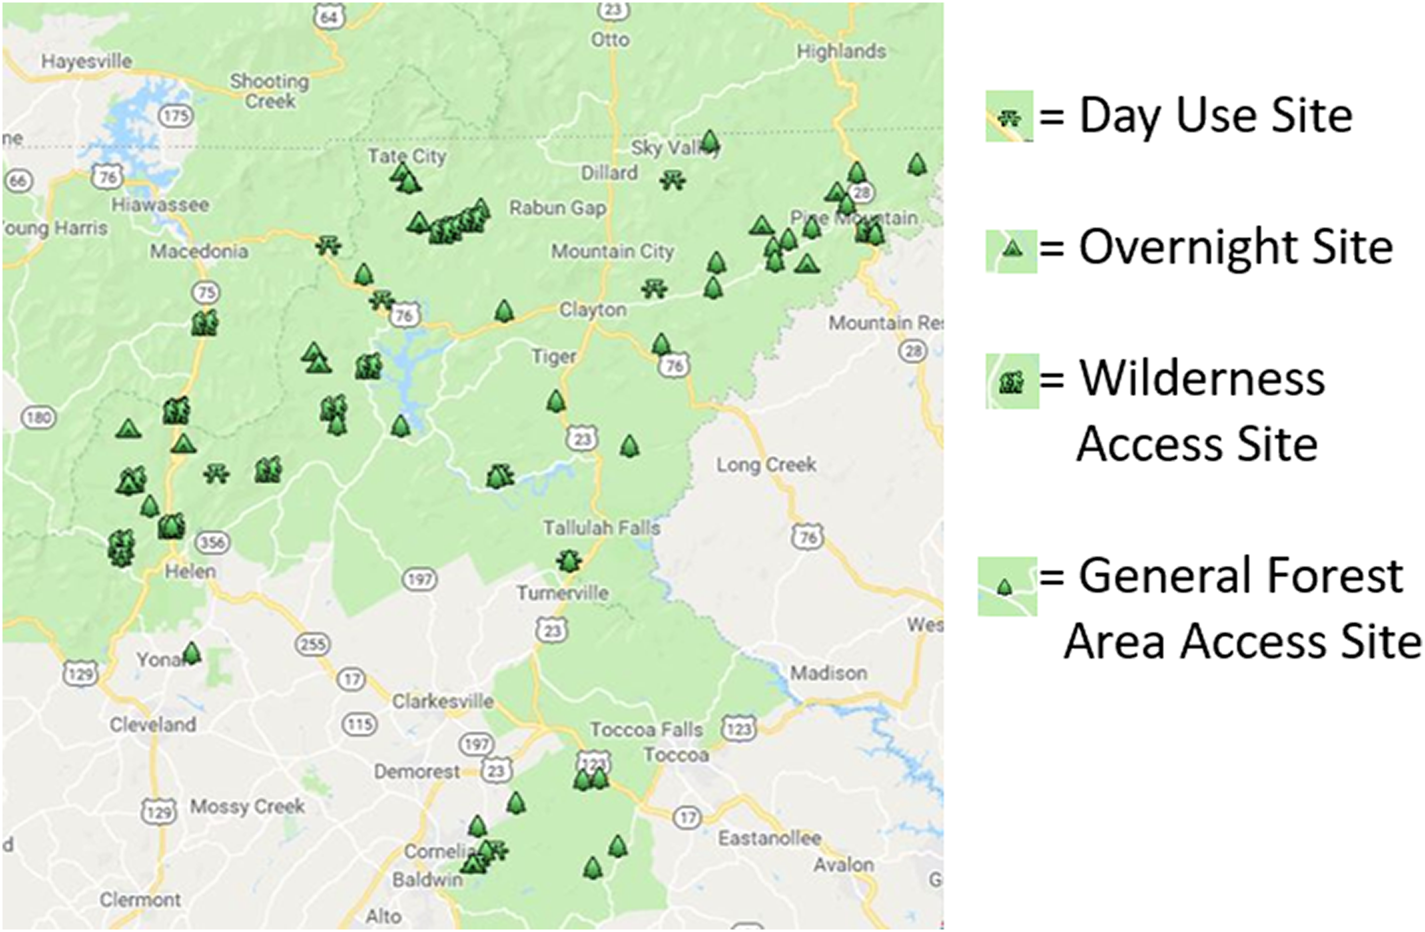
Figure 1. NVUM Sites, Chattooga River Ranger District, FY2019
There are two types of access points to dispersed recreation opportunities. Access points to designated Wilderness and some Wild and Scenic Rivers are included. These special areas are included to be able to specifically estimate their recreation visitation. The final category represents access points to all other areas of the forest: “General Forest Areas (GFA).” These GFAs account for the vast majority of the NFS. These are the access points to the forest landscape where most people hike, bike, fish, etc.
The NVUM process measures visits as they end. A visit ends when the visitor leaves the unit being sampled for the last time prior to spending the night off the national forest. Each visit can only end once; by measuring at the visit's ending, respondents know how long they were there, what activities they did, and how happy they were. The NVUM process recognizes that the volume of visitation can vary quite greatly from weekday to weekend and from season to season. Accordingly, each day of the fiscal year, for each potential sample site, is classified into one of five levels of exiting recreation traffic volume: None/closed, Low, Medium, High, and Very High. Within general guidelines, forest staffs define the thresholds between levels and apply them consistently across all days for each site of the same type on that forest. Each combination of site type and exit volume level (e.g., GFA low) represents one of the NVUM sampling strata.
Figure 2 shows the exit volume assignments for one GFA site on the Chattooga River District for FY2019. This site shows no exiting traffic (gray) weekdays from early November through late April. Low exiting traffic (green) occurs weekdays in October and mid-April to mid-May. Medium exiting recreation traffic (blue) occurs weekends in October through April, and weekdays from mid-May though September. High exiting traffic occurs on weekends starting in the middle of May and continuing through September.
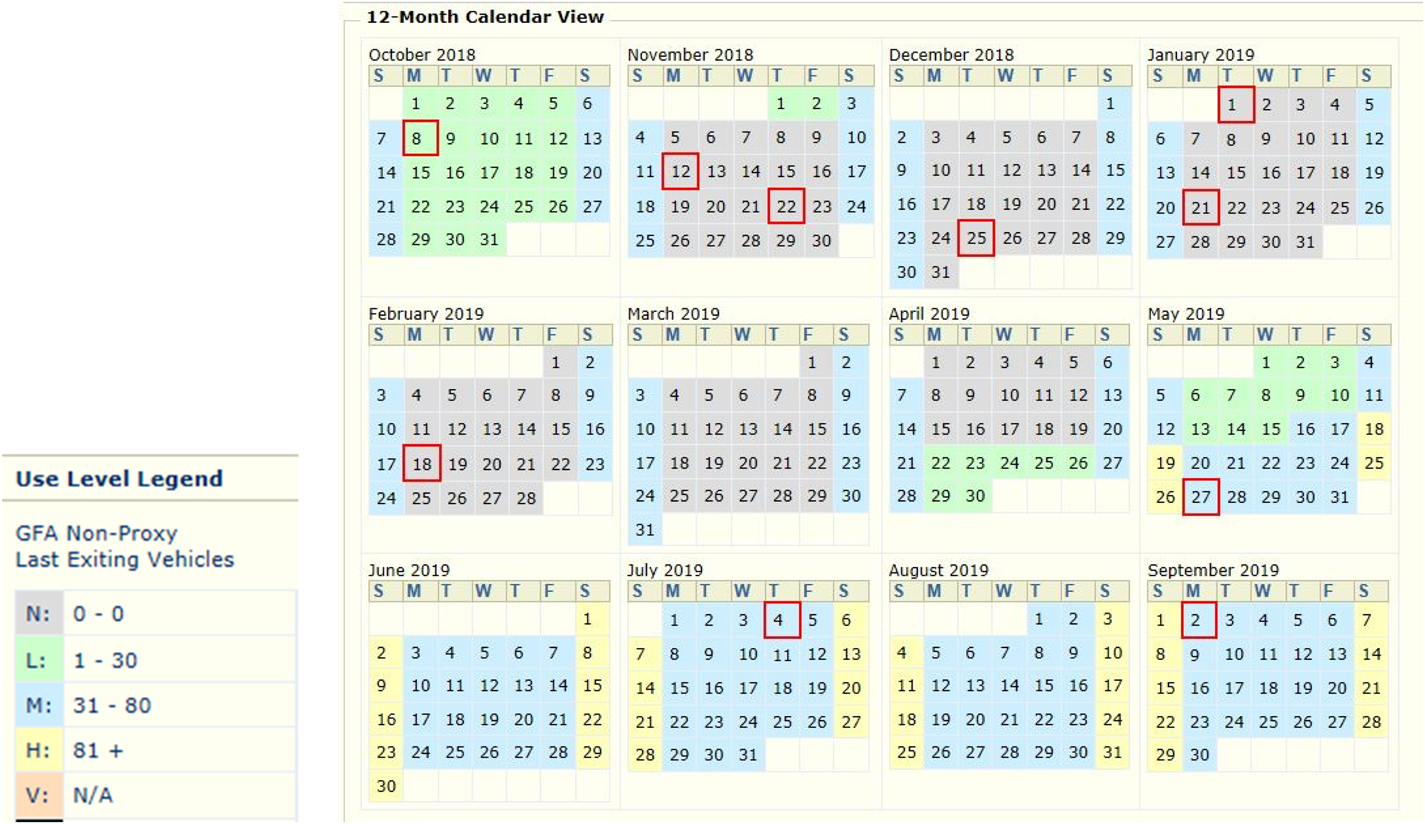
Figure 2. Exiting Recreation Traffic Volumes, Wildcat Road GFA Site, Chattooga Ranger District
For a number of developed sites and a few dispersed access points, there are administratively available counts that: (1) are directly related to visitation, (2) cover all or large portions of the fiscal year, and (3) represent all users of the site or area. Good examples include counts of skier visits at downhill areas maintained by ski resorts, site usage reports from campground concessionaires, and permanent traffic counters at Forest Service visitor centers. Such counts are typically available quarterly or annually. These visitation proxy measures are employed wherever possible to greatly improve the accuracy of the forest-wide visitation estimate. For these types of sites, the relevant stratification is by the type of count obtained and, consequently, the information needed to convert that count to a visit count.
The NVUM sampling approach is easily adapted to spatial intensification to develop visit estimates at spatial resolutions finer than the entire administrative unit. Spatial intensification of sampling has been done in order to obtain estimates of visitation and visitor characteristics for several National Recreation Areas that exist within national forests (e.g., Moosalamoo, Spring Mountains), National Monuments within national forests (e.g., Mount St. Helens Volcanic Monument), Wilderness Study Areas (Hyalite-Porcupine-Buffalo Mountain), and for several reporting units wanting to distinguish between spatially separate portions of the administrative unit (e.g., the National Forests in Florida, Cimarron-Comanche National Grasslands, the National Forests in North Carolina).
Field Sampling Effort and Data
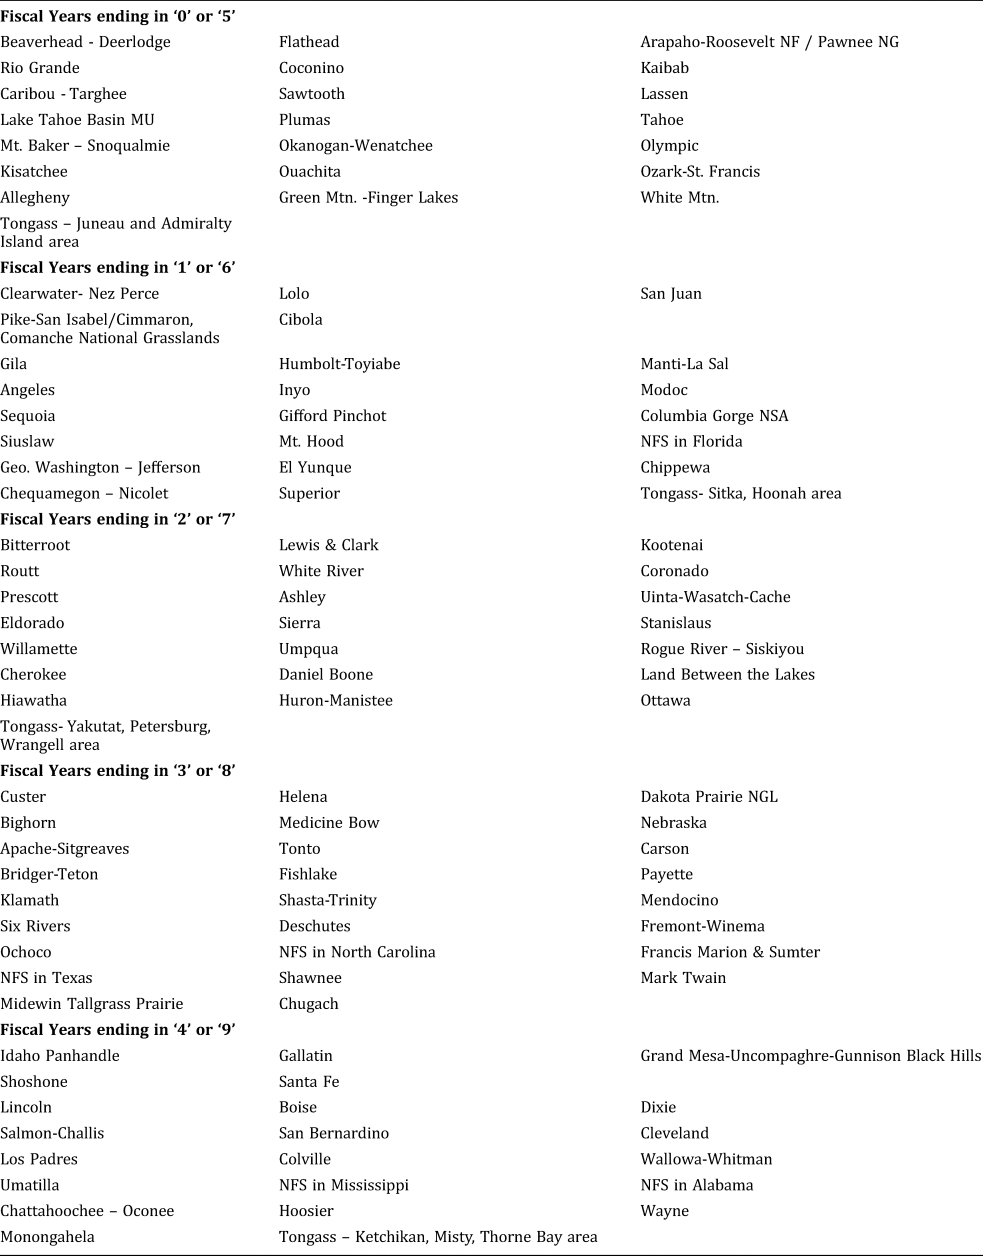
Field data are collected on about 5,800 sample days per year or 230 to 240 sample days per NFS unit. Table 1 shows the schedule of forest data collection. The range is from about 75 sample days on the small Midewin Tallgrass Prairie to over 300 sample days on some larger forests, such as the National Forests in North Carolina. Forest units that have recently been combined from two previously separate units, such as the Fremont-Winema National Forest, may have around 400 or so sample days assigned to them.
Table 1. NVUM Schedule of Field Data Collection
The sampling schedule for any forest is a stratified random sample of the population of site-days within each sampling stratum. For visit estimation purposes, the spatial and temporal distribution of the sample days in any stratum is immaterial. However, it is important to ensure adequate representation of visitor characteristics that often vary across seasons and/or parts of the forest. As a result, the algorithm that selects the set of sample days accounts for the spatial and temporal distribution of the population of site-days in each stratum.
On an assigned sample day, the person doing the data collection is to be at the assigned sample site for a 6-hour period. During that time, there are two tasks: counting exiting traffic and surveying as many of the exiting people as can be accomplished (Figure 3). The observed counts of exiting traffic are expanded to estimate the total exiting count from the site for the calendar day.
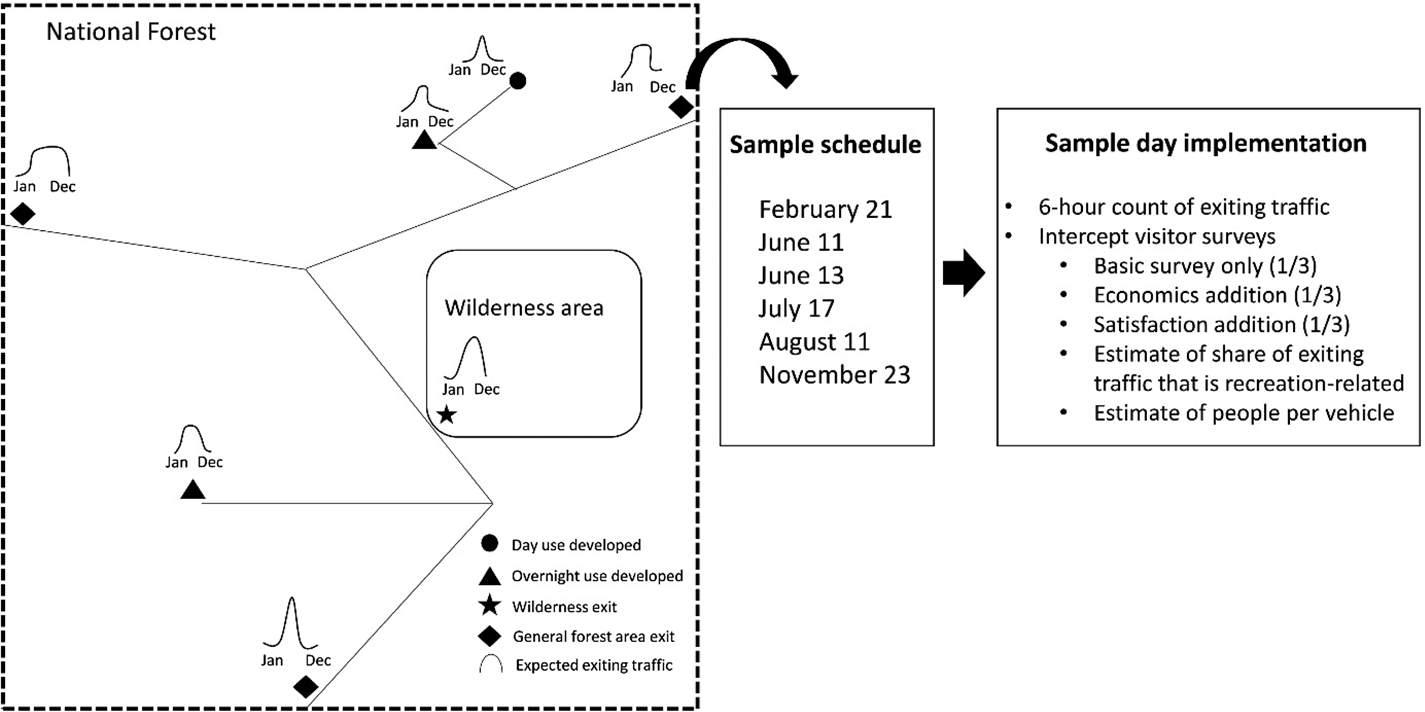
Figure 3. Schematic of NVUM Sample Approach
Surveys are administered in order to collect the data needed to calibrate the total exiting count to exiting recreation visitation. Not all exiting traffic has a recreation purpose and not all exiting recreation traffic is completing their visit for the day. Those respondents who are not recreating or not completing their visit answer only a few screening questions. Those respondents who are completing a recreation visit to the site are asked additional questions that are used to describe the population of recreation visits.
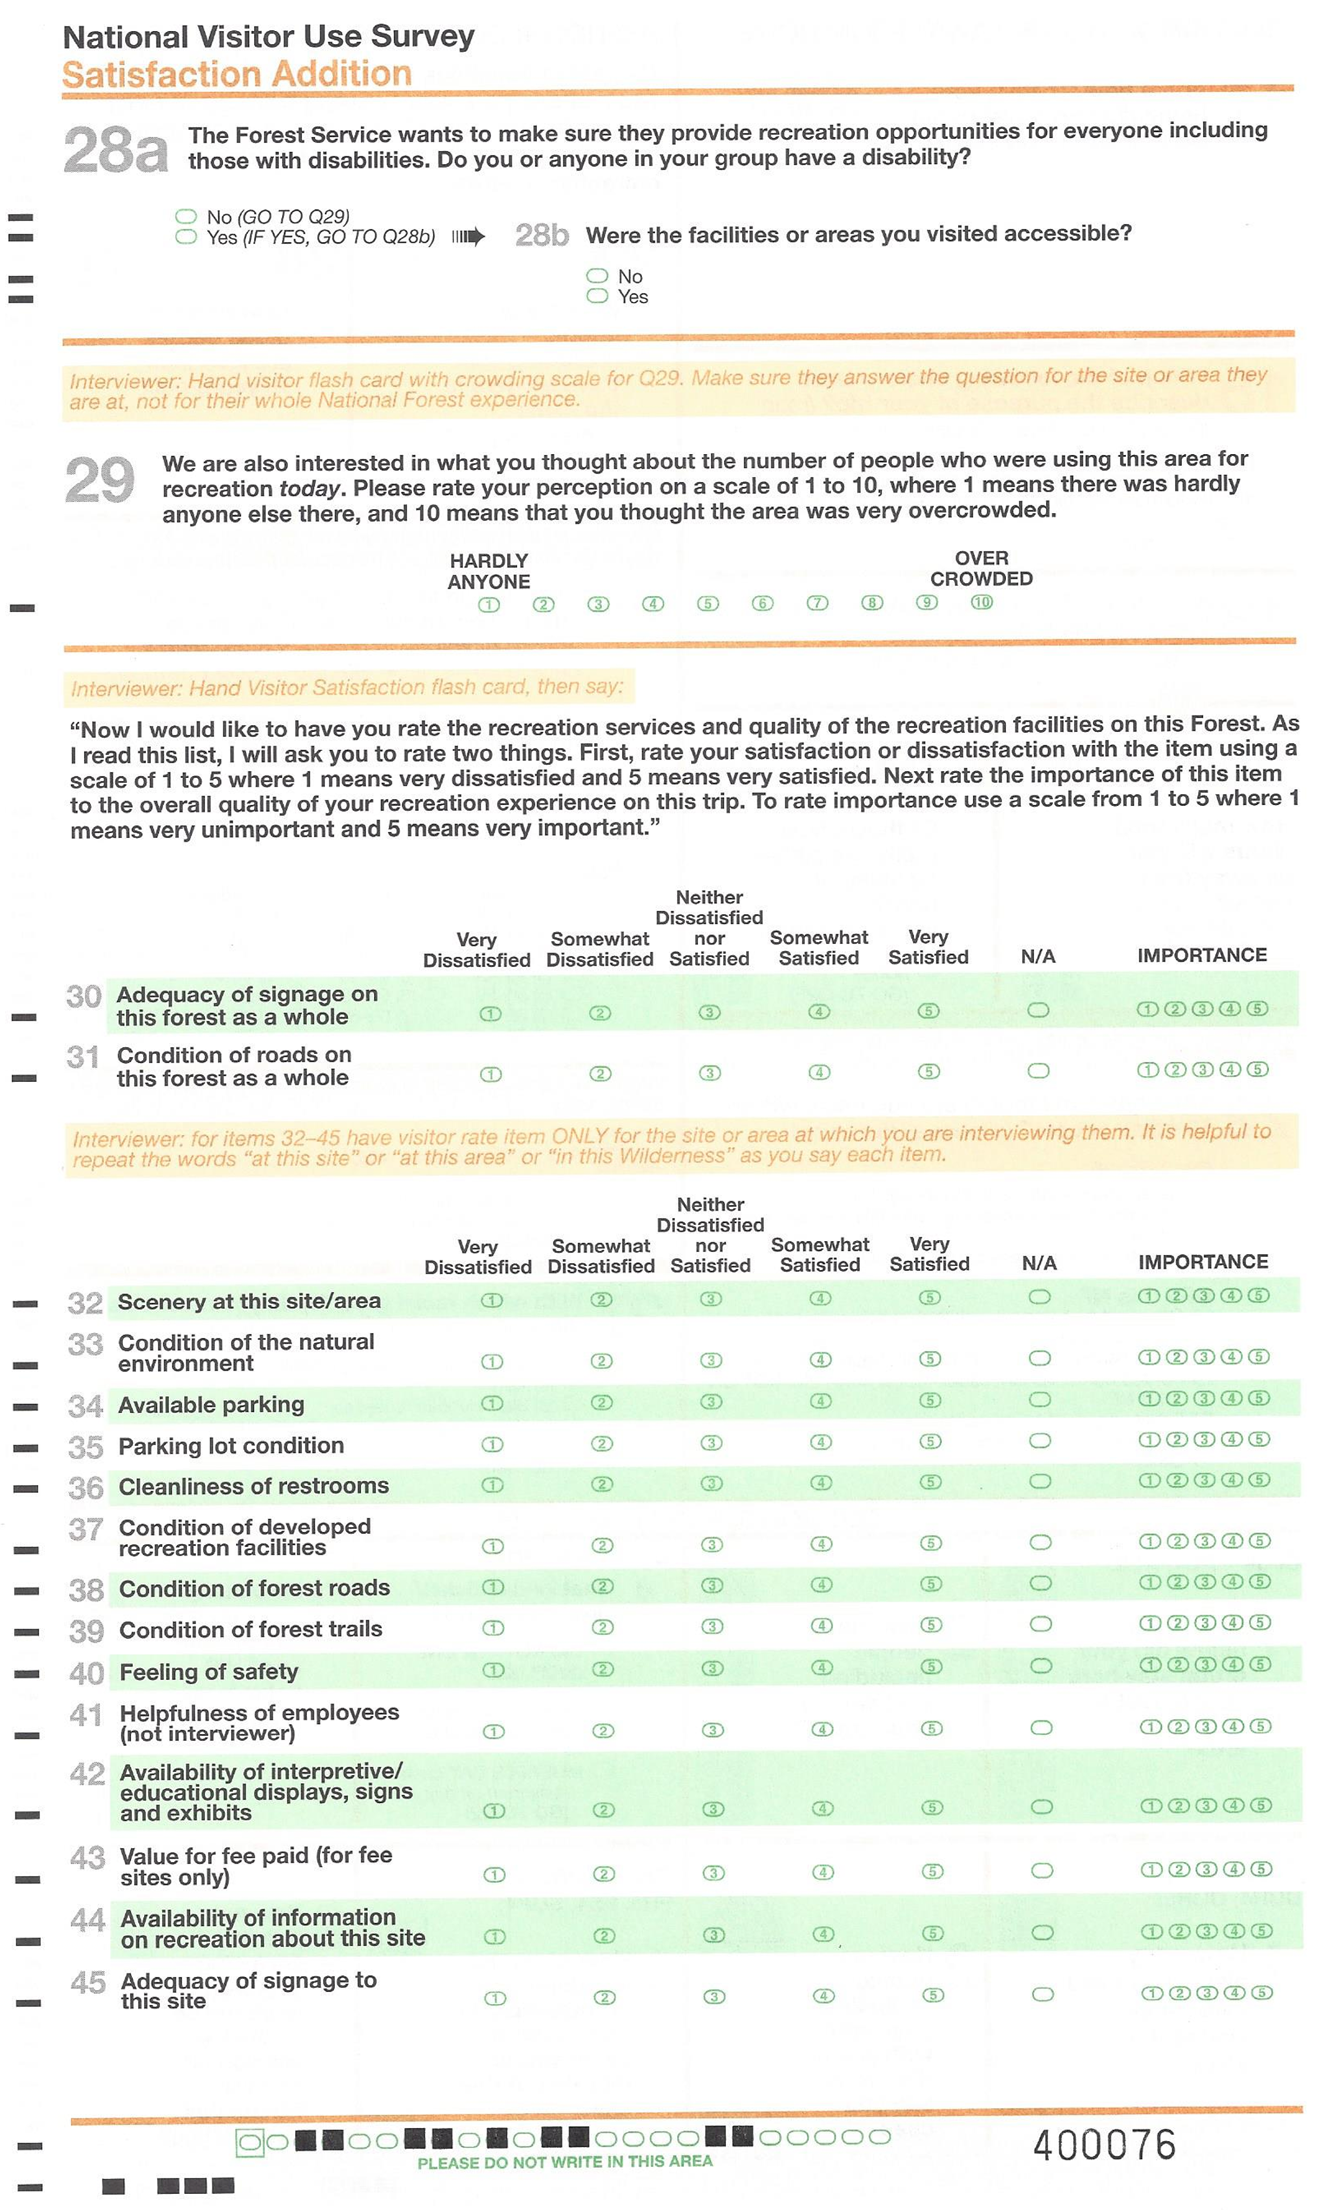
To limit respondent burden and minimize partial responses, NVUM employs three survey types. All respondents receive questions for estimating visitation volume, demographics, visit duration, and activity participation that occur on the first three pages of the survey form. About one-third of respondents receive a survey that contains a fourth page of economics questions needed for estimating market and nonmarket effects, including trip spending, household income, substitute activity, and distance to substitute sites. A final one-third of respondents receive a fourth page of satisfaction and importance questions about 14 different aspects of the site visited, including scenery, facility condition, employee helpfulness, and perception of safety. The availability of visitor stated importance and performance for the 14 satisfaction aspects is intended to help forest managers decide where to focus limited resources across various elements of site quality. Appendix A shows the four-page economics survey form used in FY2019 as well as the fourth page of the satisfaction survey version.
Unobserved recreation
For safety reasons, field data (traffic observation and surveys) are collected only during daylight hours. As a result, any visits wherein the person is exiting the site or area before sunrise or after dark are missed. An example would be deer hunters who stay on a hunting stand until dark and then leave. In addition, only public access points are included in the sampling frame. Adjacent landowners who have informal or exclusive access routes onto NFS lands are also not captured in the sampling frame. Exits from NFS land that lead to other public land (e.g., a state park) are often included in the sampling frame.
Because the sampling frame ties to a specific location on a specific day, the desire is that anyone passing through that location on that day participates in a survey. However, anecdotal observation suggests that repeat users of the same sites or travel routes are unlikely to stop to participate more than once per survey year. We liken this to the “trap shyness” phenomenon known in studies of wildlife populations using mark-and-recapture techniques. For NVUM, stopping for the survey is the analog to entering the trap. Both recreation and non-recreation visits are subject to this form of trap shyness; it is assumed that the two roughly balance each other so that estimates of the proportion of exiting traffic that is finishing a visit are unbiased. This means that although we do not interview trap shy visitors, we do count their recreation traffic and we assume that recreation and non-recreation respondents are trap-shy in equal proportions.
Estimating Visits
Let Ts = the mean daily exiting traffic calculated over the sampled days in stratum s;
Ps = the proportion of exiting vehicle/groups surveyed in stratum s that were finishing a recreation visit;
PVs = the mean number of people in recreating vehicles/groups surveyed in s;
SFs = the mean number of different sites visited per group during their NF recreation visit.
Site visits (SV) per day in s = Ts * Ps * PVs
NF visits per day = SV per day / SFs
Total visits for any stratum are the daily visit estimates (developed from the sample day count and survey information) times the number of site-days in the stratum. Once the total visits in a stratum is computed, it is possible to determine the sampling rate of recreation visits in the stratum. Because of the sampling approach, every recreation survey observation is associated with a specific sampling stratum. Weighting the recreation responses to expand to the population of visits is simply the inverse of the sampling rate (visits in the stratum/number of surveys obtained in that stratum) combined with a simple correction for oversampling of those respondents who went to multiple sites during their visit. Consequently, weighted analyses using recreation responses from across all sampling strata will represent the entire forest's population of visits. Weights so constructed do not represent the population of visitors who make the visits to NFS lands. To create a weight to represent persons, the visit expansion weight should be divided by the reported number of times the individual visits the forest in a year.
Over a 5-year national cycle of sampling, more than 100,000 recreation visitor surveys are gathered (Table 2). In most regions, more than half of these are obtained in the busiest recreation quarter of the fiscal year, from July through September. In the southern part of the country, a greater portion of both visitation and sampling effort occurs in the fall and winter quarters.
Table 2. Recreation Visitor Responses, FY2014-2018, by Forest Service Region and Fiscal Year Quarter

Estimating Market Effects of Recreation Visits
Estimating the economic activity from recreation visits and associated visitor spending requires an estimate of total spending by visitors within a specific geography and a modeling system, or parameters, to translate a change in final demand because of recreation spending into economic activity within that geography. The NVUM survey data are used to estimate the average spending of visitors which is combined with NVUM visitation figures to estimate total visitor spending at the forest level. In Forest Service applications, that total spending is then combined with the input-output (I-O) model IMPLAN to estimate economic effects.
Compared to recreation benefit value estimation, the peer-reviewed guidance for measuring visitor trip spending with visitor surveys is very limited (Stynes and White Reference Stynes and White2006). The general goal for developing estimates of average spending of visitors is to estimate average spending for a group of mutually exclusive visitor segments that have meaningfully different spending patterns and for which use estimates can be developed (White and Stynes Reference White and Stynes2008). Prior to NVUM, the Forest Service developed estimates of average spending for visitors engaged in specific activities using data collected from the PARVS and CUSTOMER recreation monitoring programs. With the advent of the NVUM Program, the Forest Service began estimating average visitor spending for visitors in a group of seven mutually exclusive segments based on the type of recreation trip (Table 3). This was consistent with the approach used by the National Park Service (Stynes Reference Stynes2011). Six of the segments are based on whether the resident has traveled more than 30 miles from home to the recreation site (non-local versus local) and whether the trip to the area was (1) a day trip, (2) an overnight trip with nights spent on the national forest, (3) an overnight trip with nights spent off the national forest but in the nearby area. A seventh segment is created for those visits where the reason for the trip was something other than visiting the national forest (see White Reference White2017). This approach takes advantage of the power of trip type in explaining variation in recreation visitor spending (White and Stynes Reference White and Stynes2008).
Table 3. National Forest Visitor Spending Profiles by Trip-Type Segment and Spending Category, Dollars Per Party Per Tripa
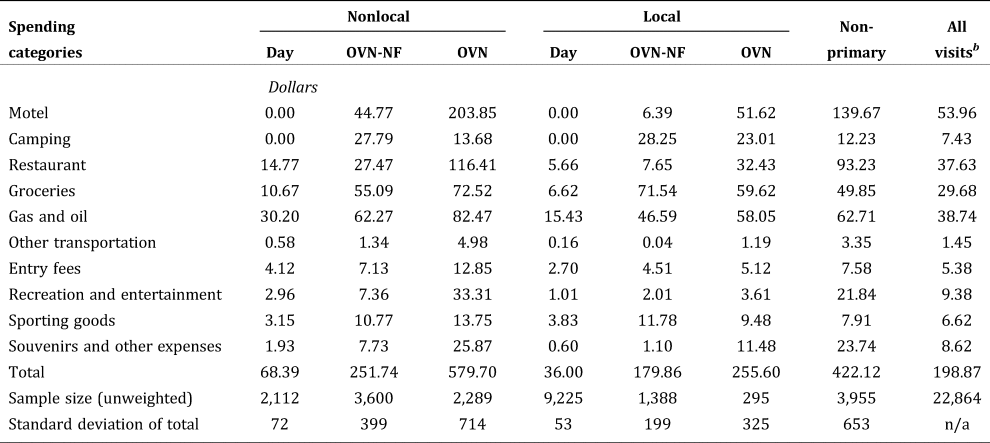
Source: White Reference White2017
a Outliers are excluded and exposure weights are applied in estimating spending averages. All figures expressed in 2014 dollars. These averages exclude visitors who claimed their primary activity was downhill skiing.
b The all-visit averages are computed as a weighted average of the columns using the national trip segment shares for nondownhill skiing as weights.
Non-primary Visits
Like the approach used in consumer surplus estimation, we focus on estimating the economic activity that results from the existence of the recreation resource. In the NVUM analysis, we identify the primary reason the survey respondent left home on the present trip using a question about the trip purpose. Those who identify any primary trip purpose other than recreating at the destination national forest are classified as “non-primary” visits, and their spending is used only in constructing the average spending for the “non-primary” visitor segment. Although we compute that average spending of non-primary visitors for completeness, in Forest Service economic contribution analyses, we apply the average spending of local day visitors to non-primary visits. In a pure economic impact analysis, the spending of non-primary visits (and visits by local residents) would be excluded entirely from the analysis (Watson et al. Reference Watson, Wilson, Thilmany and Winter2007). But for the purpose of an economic contribution analysis, we believe adding the marginal expenses associated with visiting the forest while already in the local area (i.e., local day trip spending) is a conservative approach to accounting for the small amount of spending on non-primary trips attributable to the presence of the national forest.
Our approach to isolating primary purpose trips for economic contribution analysis is similar to how benefit estimation focuses solely on primary activities and primary-purpose trips. However, unlike traditional consumer surplus estimation approaches, we do not account for the presence of substitute recreation sites in developing the average spending estimates. If one wanted to account for the presence of substitutes, one could adjust the visit estimate downward for those who identified the presence of a recreation substitute. That approach would be consistent with how we estimate the loss of economic activity from closures related to natural disturbances (see below).
Activity-Specific Spending Profiles for Focused Analyses
Recreation consumer surplus estimates are often reported for distinct primary activity sets (e.g., Rosenberger et al. Reference Rosenberger, White, Kline and Cvitanovich2017). For visitor spending, the primary recreation activity has a relatively small role in determining overall trip spending. For Forest Service visitors, recreation activity explains only about 3 percent of the variation in individual spending (White and Stynes Reference White and Stynes2008). In comparison, the type of recreation trip (i.e. local/non-local, day/overnight) explains about 21 percent of variation in trip spending. Ultimately, an angler on a day trip has expenditures in the area around the recreation destination that are more similar to a cross-country skier on a day trip than to an angler on an overnight trip. This is because lodging, gasoline, and food and drink account for the majority of trip expenditures and activity-specific expenses, such as sporting goods and equipment rental account for relative small shares of trip expenses. A key exception to this general pattern is downhill skiing and snowboarding. Expenses for access and equipment rental can account for large shares of expenses and lead to meaningfully different spending patterns.
Although activity plays a relatively small role in determining visitor spending, many project planning and management efforts focus on one or more specific activities. To facilitate those efforts, we develop spending averages for 11 activity groupings. These averages are still computed within trip type and using national-level data sets. The activity-specific spending averages are likely the appropriate ones to use in project analyses that estimate both economic benefit and economic contribution for specific activities. For the Forest Service, we use the same group of activity sets in the consumer surplus estimates (Rosenberger et al. Reference Rosenberger, White, Kline and Cvitanovich2017) and visitor spending estimates (White Reference White2017).
Average Spending Patterns
Average spending of national forest visitors ranges from about $36 ($2014) per party for those on day trips who live in the local area to nearly $580 per party per trip for those traveling from outside the local area and staying overnight in privately owned accommodations in town (Table 1). Non-local visitors and overnight visitors have greater spending than their local and day trip counterparts. Those who are visiting the national forest secondary to some other trip purpose spend about $422 per party per trip and have spending patterns that are more consistent with general tourism rather than outdoor recreation. Across all segments, lodging, food in restaurants and grocery stores, and gasoline account for the majority of recreation trip expenses. The prominence of these types of expenditures explains why trip type is the most effective predictor of recreation visitor trip spending.
Downhill skiers and snowboarders have spending averages that range from about $60 per party for those on day trips who live in the local area to nearly $745 per party per trip for those staying overnight locally. The greater trip spending by skiers and snowboarders can be traced primarily to greater expenses for entry fees and recreation and entertainment (i.e., gear rentals). In addition, skiers and snowboarders tend to spend a little more than other visitors in restaurants and a little less in grocery stores and, for those on overnight trip types, on gasoline.
Stability Over Time
The NVUM Program and data provide the ability to examine patterns in recreation visitor trip spending over time. Over 10 years, average spending within trip type by visitors to Forest Service lands have remained generally consistent from year to year (Figure 4a). This time range includes periods of economic growth and downturn. Estimating the spending averages within trip type allows for one to explore patterns in expenditure patterns without the potential confounding factor of changes in trip type (e.g., substituting local day trips for distant overnight trips when the economy is poor) caused by changing macroeconomic conditions. In addition to stability in the amount spent during national forest recreation trips, we have also found general stability in the mix of expenses during recreation trips (Figure 4b). Lodging, gasoline, and food have consistently accounted for the largest shares of expenses over the 10-year period. Further, the relative shares spent on those items (and others) have remained mostly stable over the period. We have observed non-local overnight visitors spending a slightly larger share of their expenses on lodging and non-local day visitors spending a slightly larger share of their expenses on gasoline and slightly lower share on restaurant food.
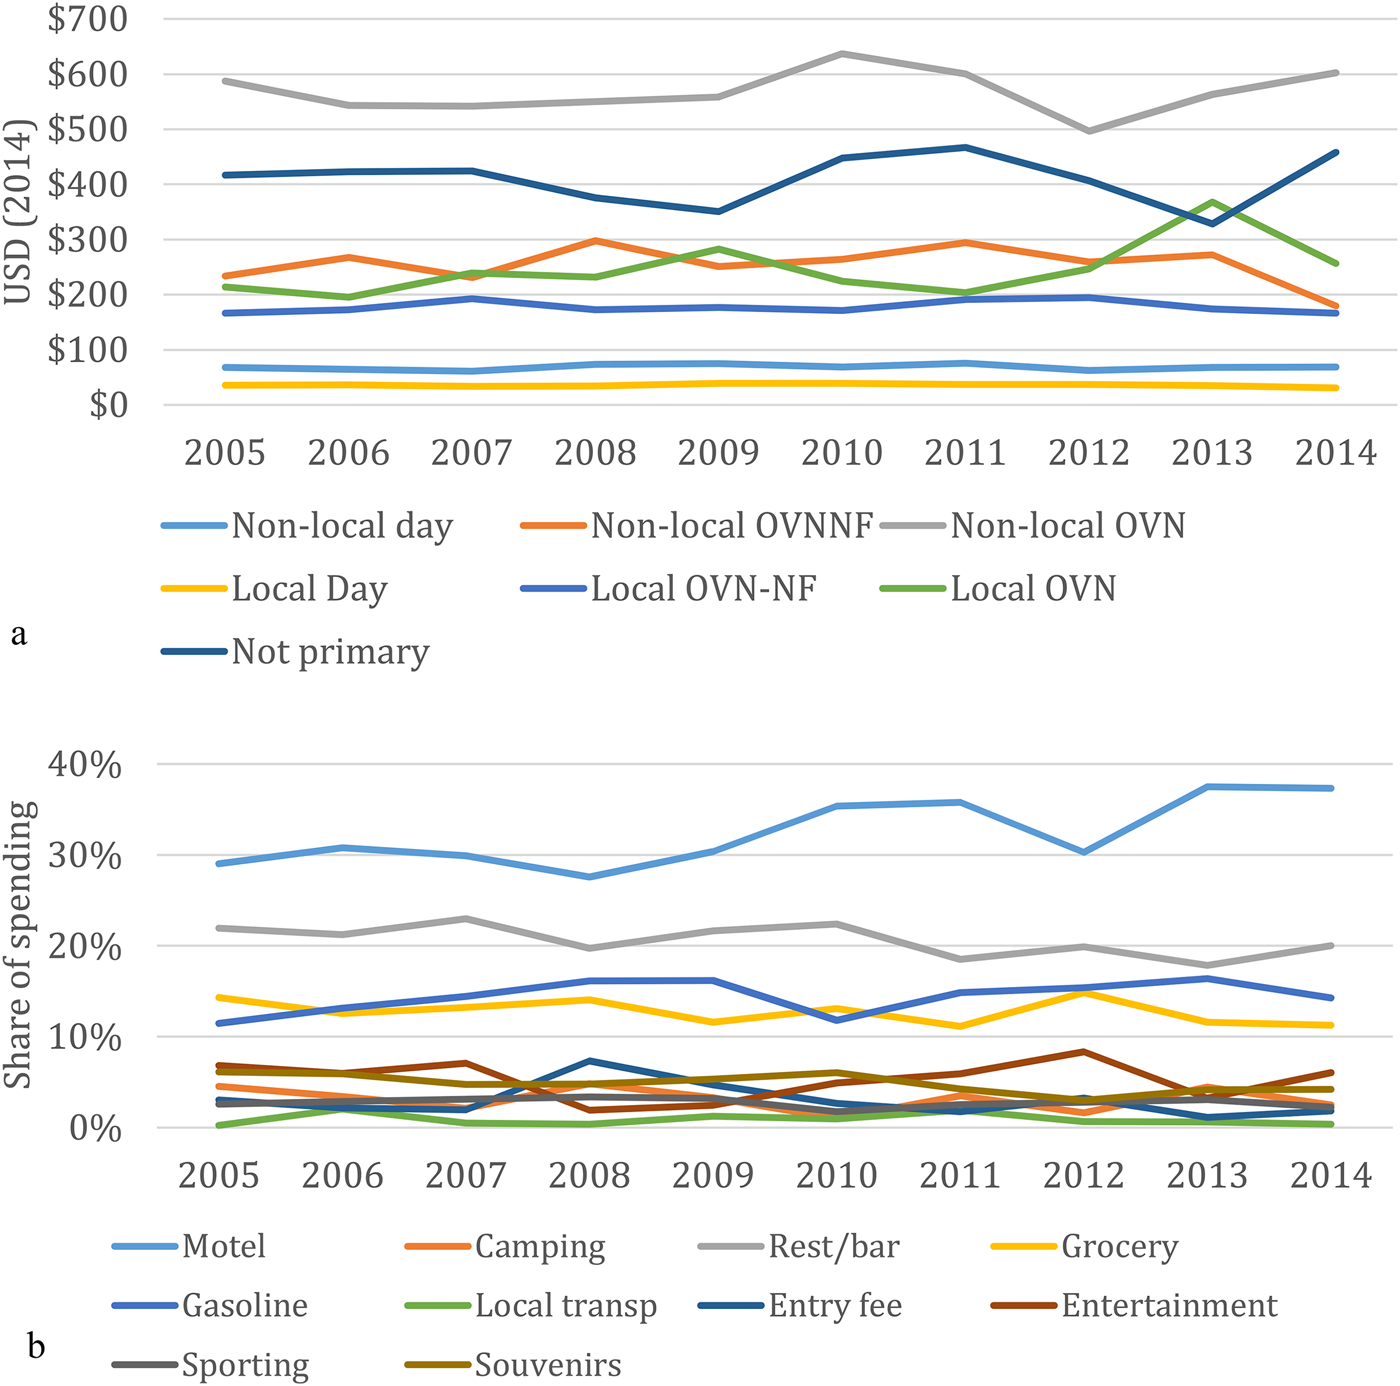
Figure 4. Visitor spending over time: Trip spending within 50 miles of the recreation site for seven types of recreation trips (a) and shares of expenses in specific categories for non-local overnight-off-forest visitors (b).
Sample Size Limitations
Although hundreds of economic surveys may be collected from visitors to each forest in every NVUM round, those sample sizes are typically inadequate for developing reliable forest-specific spending averages within trip type and after excluding outliers and contaminants (see White Reference White2017). Instead, visitor spending averages for the seven trip types are developed using data collection across all NFS units. To accommodate the variation in opportunities to spend money and local prices around national forests, we also compute “high” and “low” spending profiles to accommodate above- and below-average spending areas. We develop those profiles using visitor survey data collected on subsets of national forests where visitor spending observations are statistically higher or lower than the national averages. See White et al. (Reference White, Goodding and Stynes2013) for a detailed description of the process. We identify individual NFS units that appear to have above- or below-average spending in the guidance (White Reference White2017) on how to apply the Forest Service spending averages. In addition to those forest-level analyses, the high and low spending profiles may be used for analyses in areas that have above- or below-average spending opportunities or prices. This is somewhat similar to potentially modifying average consumer surplus estimates developed from meta-analysis to reflect above- or below-average site quality (e.g., Rosenberger) or doing direct value transfer using sites of similar high- or low-quality.
Updating Parameters
There are several parameters that must be combined with the NVUM spending profiles to compute total spending by visitors to a national forest or other geography. Estimates of the percent of all visits that fall into each trip type are used to split the single NVUM visit estimate for the NFS unit into the number of visits in each of the seven segments. Average party sizes are then used to convert those segment visits into party visits in order to be consistent with the units of the spending averages. Alternately, we could place spending on a per person basis, but because spending is better evaluated on a per party basis (Stynes and White Reference Stynes and White2006), we elect to compute party visits. Parameter estimates are computed at the NFS unit level. National-level party-size averages are substituted for individual trip-type segments on NFS units with insufficient sample sizes. Parameter estimates are updated annually incorporating the most recent five years of NVUM data. Because of the stability in spending patterns noted above, the NVUM spending averages are updated every few years.
Economic Area of Influence
Visit numbers, trip-type, and trip spending data are used to estimate the economic contribution of recreation on national forests and grasslands as well as the economic impact of proposed alternatives for recreation management. Input-output models are used to describe local economies and the effects of recreation spending, but the credibility and value of I-O analysis is in large measure dependent upon using the right geographic (analysis) area. Retzlaff (Reference Retzlaff2008) provides the conceptual guidance used by the Forest Service in defining analysis areas. The paper emphasizes that a critical step is determining the area that provides functional economic integrity so that the effects of spending and re-spending recreation-related expenditures is fully captured. An updated set of processes is outlined in U.S. Department of Agriculture - Forest Service (2018). The delineation of small or very rural analysis areas is more demanding than those of large areas. A limited economic base and weak labor flows among rural counties can provide a challenge for identifying areas with economic integrity. On the other hand, a highly developed, urban economy close to, or encompassing, national forests may be so large and complex that it is difficult to identify the area within it that is directly affected by the spending of visitors. A county containing NFS recreation sites may be good a place to begin the delineation process, but it is not a reliable guide for the final delineation. The analysis area must contain counties with cities and towns where actual recreation-related transactions are likely to occur. Recreationists spend money in gateway communities that may be in a different county than their recreation site. Though the NVUM survey question asks visitors to identify expenditures made within 50 miles of the recreation site, analysts usually look for gateway communities within 50 miles of the forest boundary for simplicity.
Estimating Nonmarket Values
Survey data from NVUM have been used to describe the demand and ultimately derive a nonmarket monetary value for recreation access on national forests. The principal methodology for these studies has been travel cost modeling (TCM) wherein a price-quantity relationship or a demand curve is derived (Cho et al. Reference Cho, Bowker, English, Roberts and Kim2014; Freeman, Herriges, and Cling Reference Freeman, Herriges and Kling2014). Annual visits to a national forest are regressed upon a number of relevant factors, including a composite variable of travel costs (e.g., pecuniary cost per travel mile, opportunity cost of travel time, access fees, guide fees) and a number intercept shifters such as demographic characteristics, income, site characteristics, main activity, and substitute sites. Because NVUM is an on-site survey of last-exiting recreation visitors, the analysis must account for the integer counts of trips, zero truncation (respondents report at least one trip), and endogenous stratification (sample probability is correlated with visits) (Landry et al. Reference Landry, Lewis, Liu and Vogelsong2016).
The first NVUM-based study to estimate nonmarket values associated with national forest recreation access (Bowker et al. Reference Bowker, Starbuck, English, Bergstrom, Rosenburger and McCollum2009) employed TCM to estimate per visit recreation access values at national and regional scales across 14 commonly reported main activities. Models allowed activities to have unique price coefficients. A number of sensitivity analyses were conducted based on various assumptions about pecuniary costs, wage rates, travel distances, and other factors. Using the most conservative assumptions at the national level, consumer surplus ranged from $25 pppt (per person per visit, 2003 dollars) for developed camping to $117 pppt for snowmobiling.
Sardana, Bergstrom, and Bowker (2016) also used NVUM data with TCM to estimate national forest demand and per trip consumer surplus by setting type in Forest Service Region 8. The settings-based approach may be better for multiple purpose visits than an activity-based approach. Their model was a Poisson lognormal estimated corrected for truncation and endogenous stratification to and found consumer surplus for access to designated wilderness ($86 pppt, 2015 dollars) in Southern national forests was generally higher than developed day use sites ($62 pppt), overnight developed sites ($50 pppt), and general forest areas sites ($63 pppt). This study is especially important for land managers who typically manage settings and not activities, especially on a long-term or strategic basis. Long-term planning to optimize all benefits (and costs) requires information on recreation benefits and how they may vary by altering the provision of forest settings. Preliminary results were also used to develop visitation models used to project recreation visitation on Southern national forests to 2050 as part of the Southern Forest Futures Project (Bowker et al. Reference Bowker, Askew, Cordell, Bergstrom, Wear and Greis2013). These projection models are now being refined for the Forest Service 2020 Resource Planning Act (RPA) Assessment.
More recently, studies applying TCM to NVUM data have been conducted looking at issues related to settings and activities. Landry et al. (2018), incorporate an incomplete demand systems approach into a TCM specified as a truncated Poisson weighted to account for avidity bias to examine demand for recreation access to forest service designated wilderness by region and ecosystem type. Preliminary findings reported in Bowker et al. (forthcoming) indicate a national consumer surplus of $72 pppt (2016 dollars). Shifters positively correlated with visits included age, male gender, and ecoregions including the Great Plains (Boundary Waters) and North American Deserts (Colorado, Montana, New Mexico, Wyoming), and Marine West Coast Forests. A common travel cost variable precluded price response or consumer surplus differentiation by ecoregion.
Chapagain et al. (2017 and 2018) examined non-motorized boating and downhill skiing and snowboarding on national forests. For non-motorized boating, TCM models were developed at the national level and used to test whether Congressional Wild and Scenic designation affected consumer surplus derived from recreation on rivers within the national forest system. Preliminary findings indicate that on rivers in the national forest system, there was no statistical difference in demand or consumer surplus for recreation access based on Congressional designation. In both cases, annual mean consumer surplus ranged from $66 to $87 pppt (2016 dollars).
Chapagain et al. (Reference Chapagain, Poudyal, Bowker, Askew, English and Hodges2018) also used TCM models for downhill skiing/snowboarding to address the effects of projected climate change on demand and aggregate consumer surplus. Their model incorporated site-level data on elevation, snow depth, seasonal temperature and seasonal precipitation. They developed relationships and simulated changes in the climate-related variables entering their TCM model using past and projected future climate conditions from RPA climate models. Their findings for consumer surplus pppt trip were consistent with those of Bowker et al. (Reference Bowker, Starbuck, English, Bergstrom, Rosenburger and McCollum2009), ranging from $91 to $185 pppt depending on assumed time costs. However, given the change in projections for climate variables significant in their TCM model, they found that future skiing visitation would decline sufficiently to reduce aggregate consumer surplus for skiing access on national forests by up to 9 percent or by nearly $400 million.
Data Issues
The NVUM data are generally amenable to developing TCM models subject to the usual difficulties associated with on-site sampling. However, a number of issues and compromises remain in addition to the usual ones which plague TCM. First, as only about one-third of those surveyed receive the questions about income and proxy substitute variables, they must be omitted or estimated for the rest of the respondents. This can also be a limiting factor if travel costs include considerable fees on-site above and beyond mileage costs, e.g., downhill skiing. While these additional on-site fees can be estimated or imputed similarly to income, there is a trade-off between sample size and issues associated with the randomness of the missing observations. Second, respondents are asked about their trips to the specific national forest in the past 12 months and not to the specific site where they are intercepted. The individual is also asked about group composition, main/secondary activities, and time on site. The individual is also asked about visits in the past 12 months for the same main activity. Often researcher judgment is required to formulate a dependent variable appropriate for the specific analysis. Finally, there is the issue of weighting. The studies cited above incorporate some form of weighting which accounts for avidity bias. However, given that the NVUM protocol involves internal expansion weights, it is not clear that simply weighting observations by the inverse of annual visits is the best approach.
Conclusions and Future Opportunities
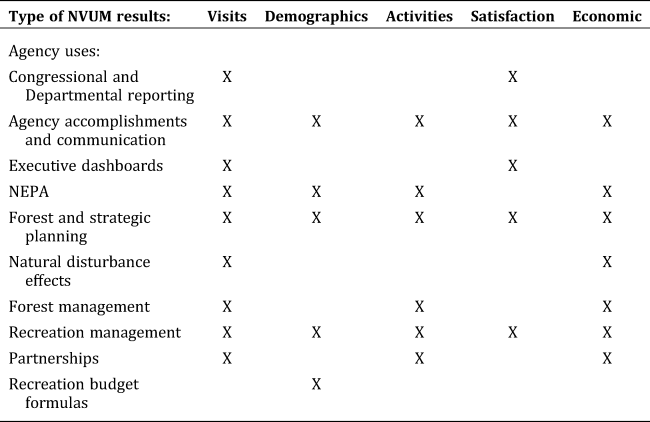
The Forest Service uses results from the NVUM process in a number of ways (Table 4). The most widely used result is the volume of visitation. Expanded emphases on customer satisfaction has led to including satisfaction information in the suite of executive dashboards developed in 2019 by the Department of Agriculture. Activity participation is a key element in many forest and strategic planning documents. Concern with rural economies means that most uses of economic results have focused on market effects rather than consumer surplus measures.
Table 4. Forest Service Uses of NVUM Results, by Results Category
Policy-makers and managers desire information on the economic losses from natural disturbances that alter the conditions or availability of recreation resources. Losses might be estimated for specific events, such as major fires or the Deepwater Horizon oil spill (Tourangeau et al. Reference Tourangeau, English, McConnell, Cervantes, Horsch, Meade, Domanski and Welsh2017), or more general changes, such as those from climate change (Kanazawa, Wilson, and Holmberg Reference Kanazawa, Wilson and Holmberg2018). Because of how the visit estimates are developed, NVUM data have been used internally within the Forest Service to estimate the loss in recreation visits in response to wildfires and post-fire area closures.
The NVUM process has led to consistency in how the Forest Service estimates and describes recreation visitation, both across forests and through time. The approach taken has highlighted the primacy of recreation in dispersed settings. Prior to the NVUM program, information about visitors’ activities and satisfaction was based on anecdotal observations or a disconnected set of studies at self-selected locations. Through NVUM, the Forest Service has data that defines its niche in the provision of recreation opportunities, provides estimates of surplus values for use of its lands, and allows accurate evaluation of the contribution of recreation use as a driver of rural economic activity. Yet additional uses of the NVUM data could still be made.
Three visit estimates, spanning a 10-year period, will be available for all forests soon. Opportunity exists for analysis of how recreation use of national forests responds to a wide array of effects. Forest-specific effects could include major fires or weather events. Regional effects might target growth or change in the population in nearby communities. Societal level effects might include economic downturns or widespread changes in gasoline prices. Such intertemporal comparisons lead to better forecasting and ultimately to improved forest planning.
Over the past several years, there has been increasing interest in using social media and crowd- sourced data to estimate recreation use at public facilities (Sessions, et al. Reference Sessions, Wood, Rabotyagov and Fisher2016; Wood et al. Reference Wood, Guerry, Silver and Lacayo2013). To date, much of the work has focused on improving the results drawn from the digital data. An area being explored is how to blend such digital data with more on-site or traditional methods such as in NVUM (Fisher et al. Reference Fisher, Wood, White, Blahna, Lange, Weinberg, Tomco and Lia2018). Potential benefits include improving the information used to define the NVUM sampling frame or in interpolating visit estimates in the five years between NVUM data collections.
An issue assumed away within the NVUM program is any bias associated with a “trap-shyness” phenomenon. Either or both visitation volume or visitor characteristics could be affected. Studies that would attempt to quantify the magnitude or direction for any bias associated with NVUM and similar on-site recreation studies would be valuable additions to the research literature.
Studies of visitor spending patterns on NFS lands has shown them to be fairly stable across activities, region, and types of sites (White and Stynes Reference White and Stynes2008). Similar work with nonmarket values has been more limited. Identifying a typology of visit types that have relatively homogeneous market and nonmarket effects would be helpful in a wide array of benefit-transfer applications where both market and nonmarket results are of interest.
The NVUM data represents an extensive set of results on recreation use of national forests from 2005 through the present. Each national cycle contains between 95,000 and 105,000 surveys of recreation visitors to NFS lands. The strength and extent of its sampling plan sets this effort apart. Case weights are used to expand the sample to the population of visits. Modified weights can be constructed to represent the population of people who visit. Visitor data from NVUM has been used to estimate both the market effects and nonmarket values associated with recreation on NFS lands. Researchers who want to use these data are well served to invest time in learning about the sampling framework. This primer on the NVUM program and its foundations provide a first step for wider application of the data in addressing economic issues of recreational use of NFS lands.
Appendix A: NVUM Survey Form


 Open access