


Introduction
The continual decline in the number of farmers in most developed countries has generated concern about its impact on the vibrancy of the agricultural sector and rural communities. Farm numbers in Canada have fallen steadily from 733,000 in 1941 to 194,000 in 2016 and the overall trend suggests farm exits dominating with few new entrants. The decline in the relative number of new entrants is partially responsible for an increase in the average age of farm operators. For example, the average age of Canadian farm operators has increased from 47.5 years in 1991 to 55 years in 2016 (Statistics Canada 2018). Farmers under 35 years of age represented just 9.1 percent of the total of 271,935 farm operators in 2016, down from 14.8 percent in 1991 (Statistics Canada 2018).
The aging distribution of the farm population is viewed by some as an indication of concern about the future viability of the sector and the subsequent need for policies to foster entry, particularly of young people, into farming (Katchova and Ahearn Reference Katchova and Ahearn2017; Featherstone Reference Featherstone2018). One stream of literature describes the impediment facing new farmers, particularly nontraditional ones, and the need to increase their access to capital and financing (Laforge et al. Reference Laforge, Fenton, Lavalée-Picard and McLachlan2018; Carlisle et al. Reference Carlisle, De Wit, DeLonge, Calo, Getz, Ory, Munden-Dixon, Galt, Melone, Knox, Iles and Press2019). Financial incentives are available to attract new farmers in many jurisdictions (i.e., farmgrants.ca) and May et al. (Reference May, Arancibia, Behrendt and Adams2019) found that the Young Farmer Payment in the European Union increased the willingness of young farmers to stay on the farm. If indeed there is a desire to increase the number of entrants into farming, it is necessary to not only attract new farmers but also retain them within the sector and prevent exit. Programs to support new farmers include the Beginning Farmer and Rancher Development Program in the United States and FarmStart in Ontario. Goetz and Davlasheridze (Reference Goetz and Davlasheridze2017) found extension programs to be a cost-effective means of keeping U.S. farmers in the sector and reducing the rate of farm exit.
Rather than seek ways to reduce the exodus out of agriculture, the alternative view is that business exits are part of a natural adjustment within a market economy (Decker et al. Reference Decker, Haltiwanger, Jarmin and Miranda2014). The replacement of exiting farms by new entrants allows for the introduction of productivity enhancing technology and practices (Hoppe and Korb Reference Hoppe and Korb2006). The net change in farm numbers over time reflects market, technological, and institutional developments. The subsequent policy concern should be on how to aid exiting farmers transition out of the sector as well as the affected rural communities faced with a declining population base (Gale Reference Gale2003; Goetz and Davlasheridze Reference Goetz and Davlasheridze2017).
The design of effective policies to either attract new farmers or smooth the withdrawal by current ones requires an understanding of the determinants of the entry into and the exit out of farming. Previous studies provide guidance on the role of price, operator characteristics, and institutional barriers in the entry and exit decisions of farmers. However, these studies have limitations on the extent of analysis either in terms of sector or time frame or focus. Several of the studies are for only one sector (i.e., von Massow, Weersink, and Turvey Reference Von Massow, Weersink and Turvey1992; Zepeda Reference Zepeda1995; Dong et al. Reference Dong, Hennessy, Jensen and Volpe2016), while others are limited by the time frame for the analysis. Kimhi and Bollman (Reference Kimhi and Bollman1999) used the 1966 and 1971 Canadian census to study exit only, and a single period of the USDA's ARMS data set was used by Mishra, Fannin, and Joo (Reference Mishra, Fannin and Joo2014) and Dong et al. (Reference Dong, Hennessy, Jensen and Volpe2016), which limits the impact of changes over time. Hoppe and Korb (Reference Hoppe and Korb2006) use data from five censuses (1978 to 1997), but the sector has changed significantly over the last two decades (Weersink Reference Weersink2018). Katchova and Ahearn (Reference Katchova and Ahearn2017) use data from four more recent censuses (1997 to 2012) to provide a more accurate estimates on entry and exit in the U.S., but the analysis relies on descriptive statistics rather than regression.
The major contribution of this study is the determination of the factors of retention of the new entrants and the evaluation of exit decisions of incumbent farms through a detailed panel data set on Canadian agriculture. The Canadian Longitudinal Census of Agriculture (CL-CEAG) links micro-data collected on census farms across census years and, thus, allows one to track the entry and exit of farms over time along with the range of variables collected on each census observation. The dynamics of entry and exit are examined across four groups of farms (entering farms that stay, entering farms that exit by the next census, continuing farms that stay, and continuing farms that exit). The decomposition highlights the differences in the groups of farms and provides information affecting the exit decisions of farms beyond what can be inferred from net exit numbers. In addition, the paper compares the different types of exiting farms, contrasting the traditional analysis that groups exit farms together.
The net decline in farm numbers between census years is consistent with the perception that larger operations acquire farms exiting the sector and entry is limited to the next generation of those continuing farms. However, the micro-data reveals that approximately one-third of farms in a given census are new entrants, but only half of these will be in operation by the time of the next census. The high rate of entry and exit between census years is hidden if only the net reduction in farms numbers is examined. This article examines the factors that distinguish between continuing and exiting farms with particular focus on different types of exiting farms.
Data
The CL-CEAG data set is the source of the data used in the analysis. The CL-CEAG is conducted every five years, and the data set links micro-data collected on census farms across census years starting in 1991 and up to the census conducted in 2016. A unique identifier is attached to each census farm, which has been self-classified as a farm based on the intent of the operator to sell agricultural produce (Poon and Weersink Reference Poon and Weersink2014). There is no minimum threshold of sales for an operation to be classified as a farm for Canadian census purposes, which is designed to gather information on total production levels.
The identifier given to each farm record allows the operation to be tracked through time. In addition to descriptors of the farm, characteristics of the operator(s) are collected from the census. Socioeconomic variables for the census consolidated subdivision (CCS) in which the farm is located are also matched for each farm observation. The over one million observations in CL-CEAG encompass the whole Canadian farm population and includes a wide range of variables that characterize the dynamics of the choice to farm (Nagelschmitz et al. Reference Nagelschmitz, Frenette, Brown and Prasil2016).
Dependent Variables
Four farm categories can be defined using CL-CEAG for a given census using information of past, current, and future census periods: (1) a Continuing: a farm in the previous (Farmt -1), current (Farmt), and next census (Farmt +1), (Farmt +1|Farmt|Farmt -1); (2) an Entry-Stay: a farm not in the previous census, but in the current and next one (Farmt +1|Farmt|NoFarmt -1); (3) an Old Exit: a farm in the previous and current census, but not in the next one (NoFarmt +1|Farmt|Farmt -1); and (4) an Entry-Exit: a one-census farm (NoFarmt +1|Farmt|NoFarmt -1) (see Table 1). An Entry-Exit farm qualifies both as an entrant farm and an exit farm in a given census year. Thus, entry farms (Entrant) are the farms that appear for the first time in the census database in a given census year (Entry-Stay plus Entry-Exit), while exit farms (Exit) are the farms that appear for the last time in the census database in a given census year (Old Exit plus Entry-Exit).
Table 1. Categorization of farms in a given census based on status in the prior, current, and future census periods
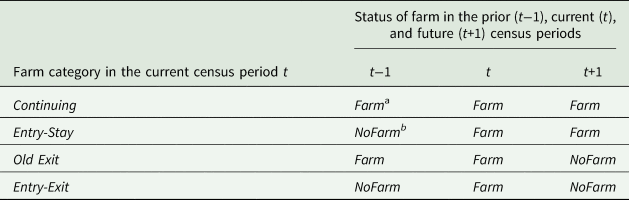
a Farm—farm operated in the associated census,
b NoFarm—farm did not operate in the associated census.
Over the last 25 years, the number of farms in the latest census has fallen by approximately one-third from 280,043 in 1991 to 193,492 census farms in 2016 (see Table 2). To illustrate the four categories of entry/exit farms in relation to the values reported in the census, note that the number of farms in census t (Farm Numberst) is given by

For example, the 205,730 farms in the 2011 census year is equal to


There were 33,488 new farms in the 2011 census (=16,759 (EntryStay 2011) + 16,729 (EntryExit 2011)), but 57,131 farms from the 229,373 in the 2006 census exited the sector (=40,519 (Old Exit 2006) + 16,612 (EntryExit 2006)), resulting in a net decline of 23,643 farms between the 2006 to 2011 census periods.
Table 2. Continuing, Old Exit, Entry-Stay, Entry-Exit, and total farm numbers in Canada, 1991–2016
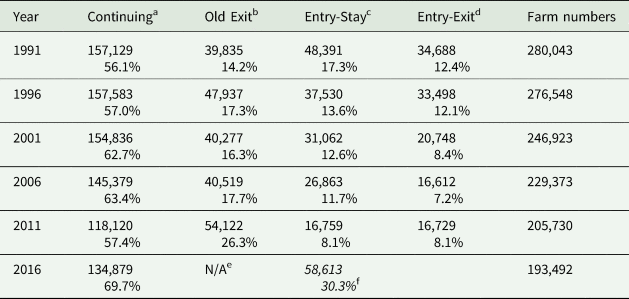
a Continuing are farms in the previous census (t−1), the current one (t), and the next one (t+1).
b Old Exit are farms in the previous census (t−1) and current census (t), but not in the next one (t+1).
c Entry-Stay are farms not in the previous census (t−1), but in the current (t) and the next census (t+1).
d Entry-Exit are farms not in the previous census (t−1), but in the current one (t) and not in the next one (t+1).
e It is not known which of the farms in the 2011 and 2016 census will exit the sector by the next census in 2021.
f The values represent the number of new entrants in total. It cannot be broken up into EntryStay and EntryExit until the next census in 2021.
It is not known which of the 193,492 farms in the 2016 census will have exited farming by the time of the next census in 2021. As a result, we are unable to determine the values for Continuing 2016, Old Exit 2016, EntryStay 2016, and EntryExit 2016. Although the two types of entrants are unobservable, we do know the total number of entrants and are, thus, able to calculate the number of the farms in the 2016 census through [1] as


Note that the percentages listed in Table 2 for each of the four farm categories do not total to 100 since the sum of all farms in a census period is not the simple sum of the number of farms in each category but rather covers both the current and the previous census periods as defined above.
The number of new entrants fell by almost 60 percent from 1991 to 2011 (83,079 to 33,488), although the number jumped significantly in the last census to 58,614. The number of exits has also fallen over time due partially to the lower number of the total farmers, but generally between one-quarter to one-third of census farms exit the sector before the next census. A significant portion of entrants into agriculture are not in operation by the time of the next census (Entry-Exit in Table 1). For example, half (16,729) of the 33,488 farms who started farming between the 2006 and 2011 census had left farming by the 2016 census.
Explanatory Variables
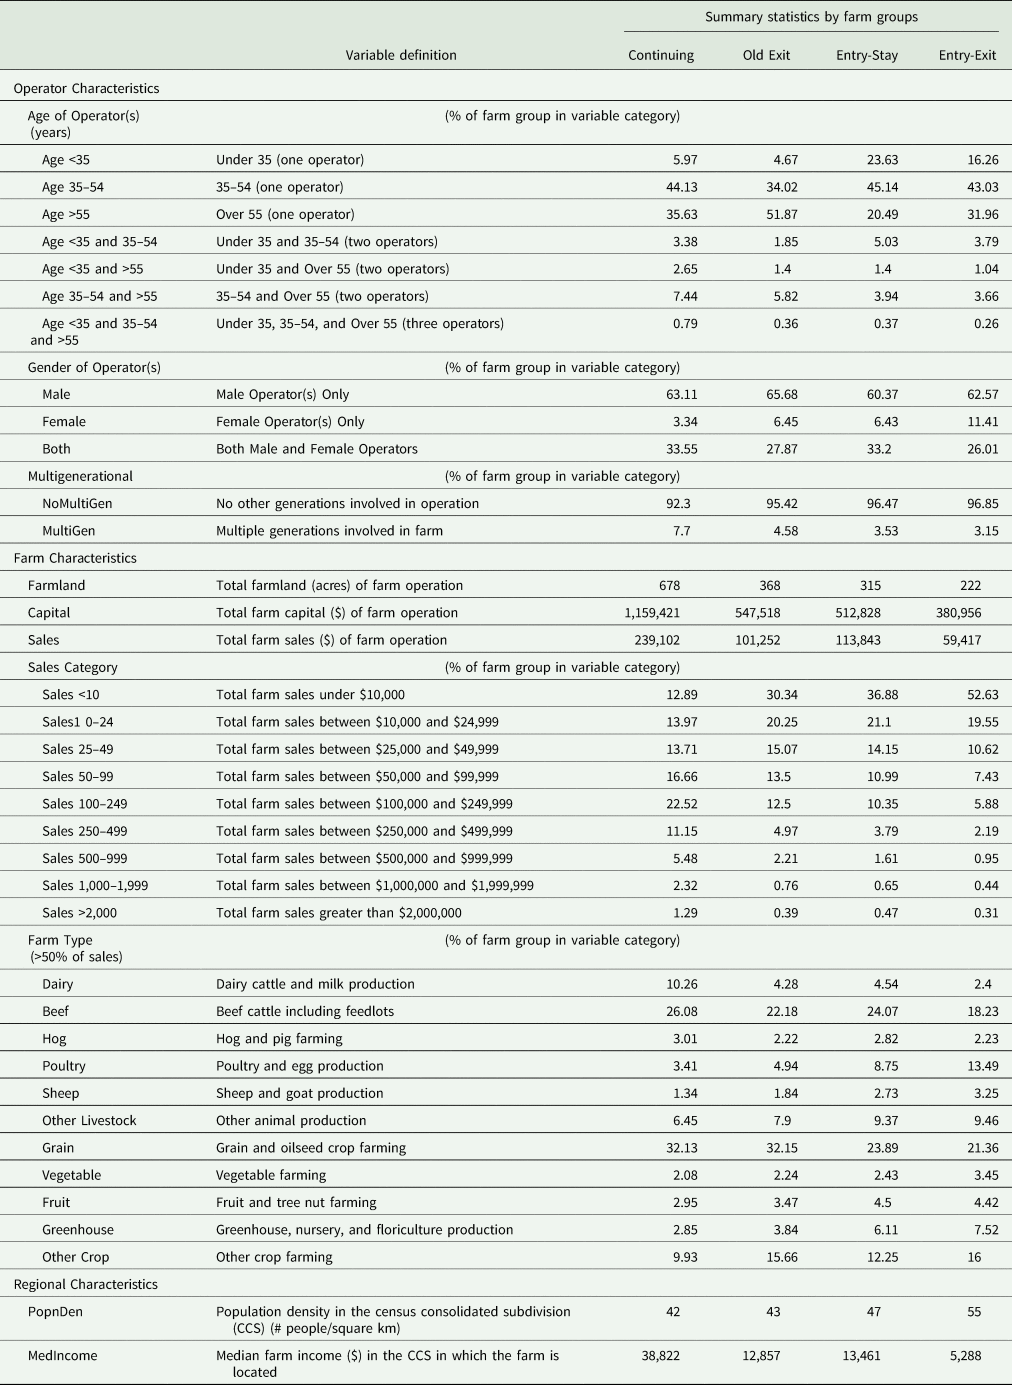
Kimhi and Bollman (Reference Kimhi and Bollman1999) and Kimhi (Reference Kimhi2000) develop a model using neoclassical human capital theory in which an individual weighs the present value of utility of either exiting (entering) agriculture as compared with the present value of utility from staying in (out of) farming. Based on this conceptual model and previous literature, the set of independent variables on exit decisions is categorized into three groups: operator characteristics (O), farm characteristics (F), and regional market characteristics (R). Definitions for the explanatory variables within each category are given in Table 3 along with the associated average value by type of farm defined by the four categories of farm groups.
Table 3. Definition and average value (or percentage of farm numbers) of explanatory variables by farm group, 1991–2016
Operator characteristics include variables for age, gender, and multigenerational farming. Their hypothesized relationships with the outcomes vary between the entry and the exit decisions. Similar to other types of businesses, people tend to enter farming when they are young (Hoppe and Korb Reference Hoppe and Korb2006). While younger individuals are more likely to enter farming, the relationship between age and exiting is hypothesized to be ambiguous. Farmers will eventually retire from farming, so on the one hand, the likelihood of exit would be expected to increase with age. However, many farmers can remain as part of an operation well past the normal retirement age (Gale Reference Gale2003), and a high proportion of new entrants, hypothesized to be younger generally, will drop out of farming. In addition, Katchova and Ahearn (Reference Katchova and Ahearn2016) find that younger new entrants are more likely to operate larger farms and likely to grow over time, which may put them at more financial risk. Thus, the sign of the correlation between age and exit is expected to be ambiguous. There are seven categorical age variables defined in CL-CEAG (see Table 3) that allows for three age groupings for single or multiple operators of the farm.
More women are involved in farming than in previous generations due to changing attitudes (Ahearn and Newton Reference Ahearn and Newton2009). Thus, female operators are assumed to be more likely to enter farming over time ceteris paribus (not that more females are expected to enter than males). Similar to age, the relationship between gender and exit is expected to be ambiguous. Multigenerational operations are assumed to have higher entry rates as the adjustment cost of entry is lower and the farming returns to established units are higher than for new operations. For the same reasons, retention rates for multigenerational farms are assumed to be higher and the exit rates consequently lower (Dong et al. Reference Dong, Hennessy, Jensen and Volpe2016).
Higher net farm income is hypothesized to increase the entry rate and slow the exodus from farming (i.e., von Massow et al. Reference Von Massow, Weersink and Turvey1992; Gale Reference Gale1993; Mishra, Fannin, and Joo Reference Mishra, Fannin and Joo2014). Farm characteristic variables include farm size (farmland area), capital, sales, and farm type. It is assumed that new operations are more likely to be smaller and focused on the production of goods with lower adjustment costs. Several studies, including Mishra, Fannin, and Joo (Reference Mishra, Fannin and Joo2014), have found that part-time farming eases the entry into and out of farming. Farm types with lower adjustment costs that increase the rate of entry are also likely to slow the rate of exit. For example, crop farms tend to be more amenable to entry through the ability to work both on and off the farm due to fewer labor requirements than livestock operations. In addition to labor requirements, the entry may be lower in sectors with high barriers to entry in the form of quotas (i.e., poultry and dairy). Farm size and sales are indicators of farm profitability and potentially technical efficiency and are, thus, assumed to be negatively correlated with exit (Kimhi Reference Kimhi2000; Dong et al. Reference Dong, Hennessy, Jensen and Volpe2016).
In addition to regional dummy variables, the regional market characteristics consist of two other variables: the population density and the median income of the CCS in which the operation is located. While population density may increase farmland values and, thus, the adjustment costs of entry, it may also increase the demand for local produce that can be met by small operations selling through local farmer markets (Govindasamy, Hossain, and Adelaja Reference Govindasamy, Hossain and Adelaja1999). While this may have a positive effect on entry, off-farm employment opportunities and the associated wage rates are higher in more densely populated regions, thereby increasing the relative returns to staying out of farming. Thus, the expected sign of the relationship between population density of the CCS and entry is ambiguous. Similarly, its relationship with exit is unknown a priori. The median farm income is an indicator of the importance of agriculture within the CCS. As with farm price, we expect higher farm incomes increase the relative attractiveness of farming and, thus, increase (decrease) the likelihood of entry (exit).
Empirical Model
Econometric Model
A linear probability model (LPM) is used to assess the determinants of the outcome variables in two scenarios: (1) farms that exit between the current and next census (Old Exit) compared with those not exiting (Continuing) conditional on both groups farming in the previous census or NoFarmt +1|Farmt|Farmt -1 versus Farmt +1|Farmt|Farmt -1, and (2) new entrants that exit (Entry-Exits) compared with new entrants that continue farming into the next census (Entry-Stay) or NoFarmt +1|Farmt|NoFarmt -1 versus Farmt +1|Farmt|NoFarmt -1.
To illustrate the model for the two scenarios, we begin with the specification of the dependent variable for the exiting farm analysis for scenario (1) on exiting versus continuing farms conditional on both farming in the previous census.

The LPM, which is an ordinary least squares model with a binary dependent variable, is defined as follows:

where γ0 represents the intercept and δ's are the vectors of parameters associated with the vectors of explanatory variables, O, F, and R that are defined in the next section. T is a vector of indicators for census years. Lastly, ɛ is the robust standard error with mean zero.
Similarly, the dependent variable for the other regression model that compares the two types of entrants is defined as

The LPM is used as the main model given its ease of interpretation and that the predicted probabilities of Old Exit and Entry-Exit lie well within the unit interval, which is an important condition for the unbiasedness of the LPM (Horrace and Oaxaca Reference Horrace and Oaxaca2006). Given the binary dependent variables, we show results from the logit model in the Appendix for robustness.
Note that each of the two regressions are conditional regressions that rely on specific subsamples of the data set. The Old Exit regression is based on the subset of farms that existed in the previous census period, while the Entry-Exit regression is based on the subset of farms that did not exist in the previous census period t−1 and started to appear from census period t. This approach of focusing on exit decisions and defining exiting farms as opposed to continuing farms is based on the nature of the census data that do not include information on the potential entrants and is consistent with the approach taken by previous studies by Ahearn and Newton (Reference Ahearn and Newton2009) and Katchova and Ahearn (Reference Katchova and Ahearn2017).
Summary Statistics of Explanatory Variables by Entry/Exit Category
An overview of the independent variables used in the analysis is summarized by farm groups (Continuing, Entry-Stay, Old Exit, and Entry-Exit) in Table 3. The independent variables are grouped into three categories: operator characteristics (O), farm characteristics (F), and regional characteristics (R).
Operator Characteristics (O)
Across all farm categories, the majority of the census farms consist of one operator between the ages of 35 and 54. An exception is exiting farms that have been in operation for at least one census period (Old Exit) for which more than half are farms operated by a single farmer who is over 55. Continuing farms are more likely to have multiple operators (around 14 percent of its total), whereas around 9 percent of both types of exiting farms involve multiple operators. The two groups of entering farms tend to be significantly younger than Continuing or Old Exit farm groups. For example, one-quarter of Entry-Stay farms and 16 percent of Entry-Exit farms are operated by a single farmer who is younger than 35, compared with only around 5–6 percent for Continuing and Old Exit farms.
The majority of census farms are operated by a single male with the highest rate (65.7 percent) for farms that were in the previous census but have exited (Old Exit), while the share of farms managed by a single female is the highest for Entry-Exit farms (11.4 percent). The percentage of entrants that are operated by single females has increased over time, suggesting that there is a change in the traditional role of gender within agriculture as females are more likely to be active participants. The share of farms with both male and female operators is the highest on those farms that will continue to be in operation in the next census (either Continuing or Entry-Stay), which may be due to the size of the operation and/or the effectiveness of both genders contributing to the continued success of a farm operation.
The vast majority of census farms do not involve multiple generations consistent with the number of operators discussed above. The highest percentage of farms with multiple generations is for Continuing farms (7.7 percent) as expected since the involvement of parent(s) and the next generation increases the likelihood of continual operation over several census periods.
Farm Characteristics (F)
Farm characteristics differ significantly between the four farm groups. Continuing farms tend to be the largest while entering farms, particularly Entry-Exit farms are the smallest in size. For example, the average farmland of Continuing farms (678 acres) is more than double the average land base of Entry-Stay (315 acres) and is more than triple the average size of Entry-Exit farms (222 acres). Size measured in terms of capital reveals a similar pattern with Continuing farms having the largest average asset base (over $1.1 million). This is double the average value of capital for Old Exit farms. There is also a significant difference in capital base among the entrants; the average value of capital for Entry-Stay is more than $0.5 million, but it is $380,000 for Entry-Exit farms.
Sales reveal a similar pattern as asset base. Average farm sales are significantly higher for Continuing farms ($239,102)—it is more than double the average revenue for Old Exit farms ($101,252) and four times the average sales for Entry-Exit farms ($59,417). Sales for Entry-Stay farms ($113,843) are less than Continuing farms but much larger than the two exiting farm groups. Sales for entrants in the 2016 census is significantly higher than the other categories and approximately $40,000 less than Continuing farms.
Farm sales are also organized into nine categories to illustrate the size distribution across farm type. As discussed in Weersink (Reference Weersink2018), the majority of sales are concentrated in a small proportion of farms. For example, the average sales for Continuing farms is approximately $240,000 but less than one-quarter of these farms have sales greater than $250,000. More than one-third of Entry-Stay and one-half of Entry-Exit farms have sales less than $10,000. Approximately 7 percent of Entry-Stay and Old Exit farms and 4 percent of Entry-Exit farms have revenue greater than $250,000, which is a threshold often used to categorize commercial farms. Entering farms that will be in the next census (Entry-Stay) are significantly larger than the farms that will leave by the next census (Entry-Exit), and similarly, continuing farms that are in the next census (Continuing) are larger than the ones not in the next census (Old Exit).
There are relatively small differences in terms of farm type across the groups. The four most common farm types (beef, other livestock, grain, and other crop farming) total nearly three-quarters of all census farms within each of the farm groups. Dairy farms make up nearly 10 percent of Continuing farms but represent a much smaller proportion for the other farm groups, particularly Entry-Exit farms (2 percent). The distribution of farm types is different for those farms that were in the census the previous period (Continuing and Old Exit farms) and for those farms that entered farming in this census period (Entry-Stay and Entry-Exit). While producing less dairy and beef as a share of their total, the two groups of entering farms are more likely to produce a variety of livestock than Continuing and Old Exit farms. Similarly, entering farms are more likely to be involved in a broader range of crops than more established farms that are more likely to grow the traditional grains.
Regional Characteristics (R)
The population density of the census subdivision (CCS) in which the farm is located is significantly higher for the two entering farm groups than for the two groups that were in the previous census. The population density was the highest (excluding entry-2016) for the Entry-Exit (55 people/km2) followed by Entry-Stay (47 people/km2), while the values were lower and similar for Continuing farms (42 people/km2) and Old Exit farms (43 people/km2). Continuing farms are in regions with the highest average median farm income of $38,822, while the median income in the CCS for Entry-Stay and Old Exit farms is significantly lower at $13,461 and $12,857, respectively. The Entry-Exit farms are on average located in the CCSs with the lowest median farm income of $5,288, whereas entrants in 2016 in the CCSs have a median farm income of $28,508.
Results
Old Exit versus Continuing Farms
The results on the probability of being an exiting farm versus a continuing farm conditional on both farming in the current and previous census (equation 4) are reported in column (1) of Table 4. In the case of single operator farms, the operator being younger than 35 is significantly associated with a 1 percentage point increase in the probability of a farm that has been in operation for the current and previous census exiting by the next census compared with the age between 35 and 54, while those with an operator older than 55 years are associated with a 9.6 percentage point increase in the probability of exiting rather than continuing. In the case of farms with two operators, having one of the operators older than 55 is significantly associated with an increase in the probability of exiting farming rather than continuing.
Table 4. Linear probability model (LPM) regressions results for Old Exit and Entry-Exit
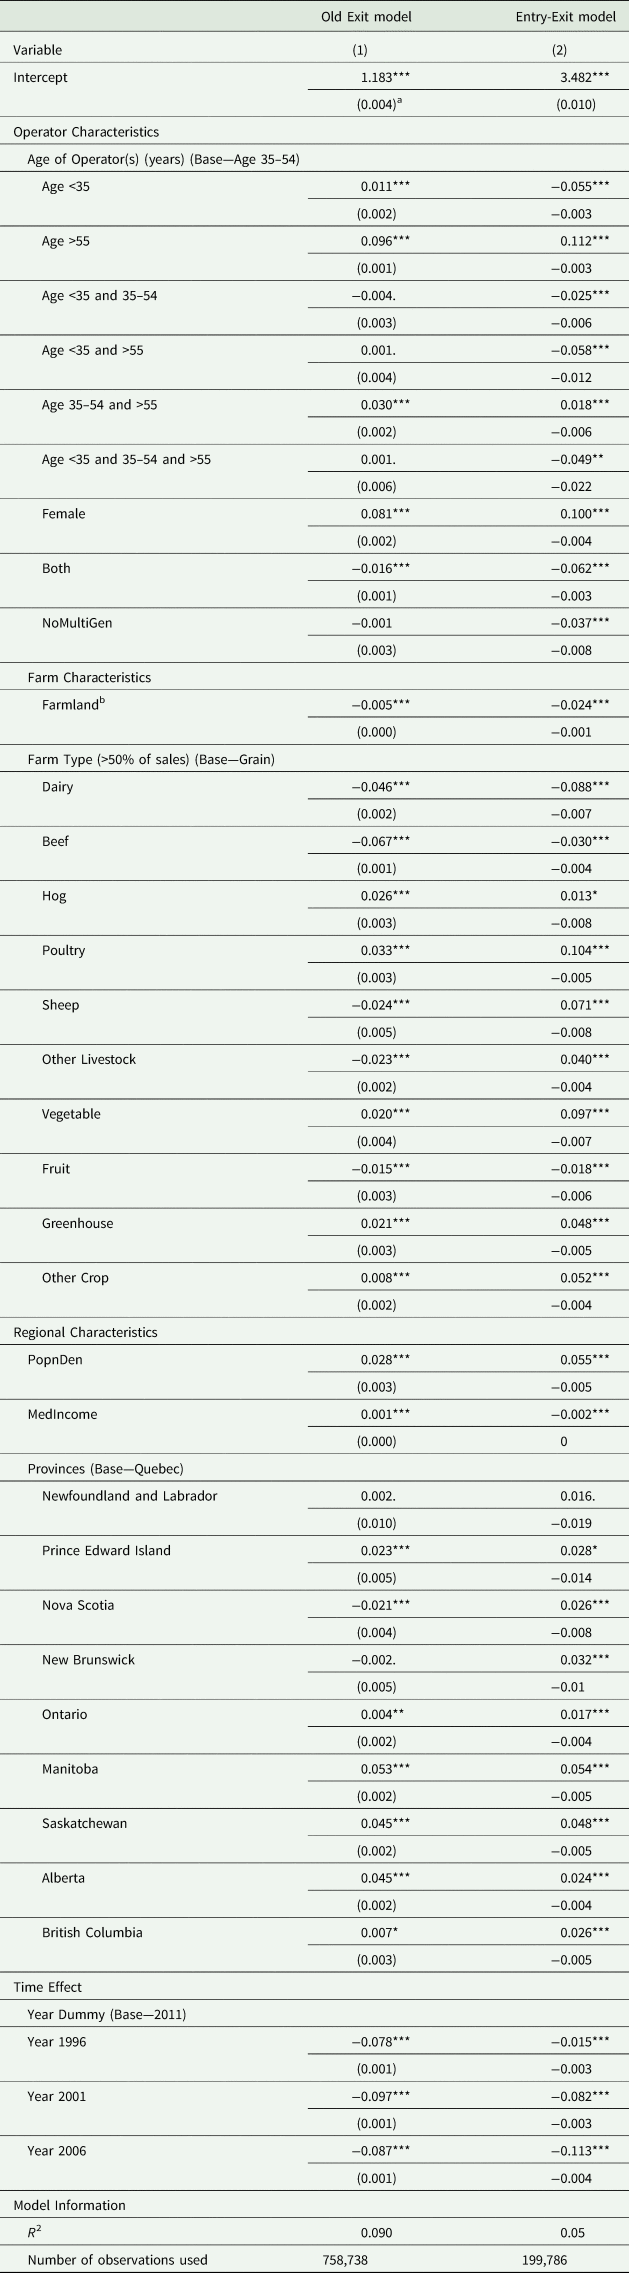
*Significant at a 10 percent level; **Significant at a 5 percent level; ***Significant at a 1 percent level.
p-value > 10 percent (insignificant).
a Standard Errors are in parentheses.
b The units of measurement for three variables are adjusted. These are Farmland (1,000 acres), PopnDen (1,000 ppl/km2), and MedIncome ($1,000).
The farm operator being a female is significantly associated with an 8 percentage point increase in the probability of exiting farming rather than continuing, compared with a farm operated by a male. The result is consistent with the findings of Hoppe and Korb (Reference Hoppe and Korb2006). Having both male and female operators is significantly associated with a 1.6 percentage points decrease in the probability of exiting farming, compared with a farm operated by a male. The results confirm the important role of a spouse in continuing a farm operation as found by Mishra, Fannin, and Joo (Reference Mishra, Fannin and Joo2014). Having only a single generation of operators is significantly associated with a lower probability of exiting farming, compared with a farm operated by multiple generations, but the result is not statistically significant.
Greater farm size is significantly associated with a decrease in the probability of exiting farming as hypothesized earlier and consistent with Dong et al. (Reference Dong, Hennessy, Jensen and Volpe2016). In Table 4, capital and sales revenue are dropped from the set of independent variables given the concern of endogeneity. Results with various specifications with and without sales and capital are presented in Supplementary Table A1 in the Appendix. The results in Table 4 and Supplementary Table A1 consistently indicate that greater capital and farm size and are both associated with a decrease in the probability of exiting. Supplementary Table A1 also indicates that sales lower than the base category of $250,000–$499,000 are each significantly associated with a greater probability of exiting, whereas sales higher than the base category are each significantly associated with a lower probability of exiting. Also, we can see that the higher the sales category, the lower the probability of exiting, in a monotonic manner.
In Table 4, column (1), dairy, beef, sheep, other livestock, and fruit farms are less likely to exit than grain farms conditional on these farms operating in the current and last census. The greater labor demands and resulting commitment may explain the lower likelihood of those type of farms compared with grain operations. In contrast, hog, poultry, vegetable, and greenhouse farms as compared with grain farms are more likely to be associated with exit than continuing farms. These types of farms are more often associated with niche markets than grain farms that tend to grow commodities such as corn and wheat. In addition to the larger size, many grain farms are managed by operators with off-farm jobs but living on the farm on which the grains and oilseeds are grown, which may explain the lower rate of exit.
Exits tend to happen more in the CCS with a greater population density. The probability of exit increases with an increase in the median farm income for the region. The result contrasts with the findings of Mishra, Fannin, and Joo (Reference Mishra, Fannin and Joo2014) and Katchova and Ahearn (Reference Katchova and Ahearn2017) that higher farm income, either directly through the market or through farm support programs, discourages farm exits. The results obtained here suggest the demand for farmland from nonfarm sources as proxied by population density and from other farmers as measured by farm income may increase the value of farmland and, thus, the likelihood of selling the high-value assets and exiting.
Aside from operations in Nova Scotia, farms that have been in business in the current and previous census are more likely to continue operating if they are based in Quebec compared with the other Canadian provinces. Quebec was used as the base of comparison given its efforts to attract and retain young farmers and it suggests that the policies have some impact on reducing the likelihood of exit. However, the magnitude of the difference across regions is relatively small, suggesting the relative importance of underlying farm market conditions on farm dynamics.
Year dummies indicate that census years 1996, 2001, and 2006 are each associated with a lower probability of exiting farming compared with the census year 2011, which is the most recent census year. This is consistent with the general decline in overall farm numbers over time.
Entry-Exit versus Entry-Stay Farms
A surprising revelation in the presentation of the entry and exit numbers was that approximately one-quarter of all census farms have entered the sector since the last census but nearly half of those will have exited by the time of the next census. To examine the determinants of leaving the sector so quickly, a LPM is estimated with Entry-Exit farms equal to one in the binary dependent variable and Entry-Stay farms equal to zero (equation 5). The regression results comparing the two types of entrants are listed in column (2) of Table 4.
Age is positively related to the likelihood of exit among entrants. In the case of single operator farms, the operator being younger than 35 is associated with a 5.5 percentage points decrease in the probability of exiting after a single census year compared with farms with a single operator in the base age category (35–54). In contrast, the operator being older than 55 is associated with an increase of 11.2 percentage points in the probability of exiting after a single census year. In the case of multiple farm operators, the presence of an operator younger than 35, even if the second operator is older than 55, is associated with staying in farming for longer than a single census period.
Given all other factors constant, the operator being a female is associated with a 10 percentage points increase in the probability of being an Entry-Exit instead of an Entry-Stay farm compared with a farm operated by a male. While a female-operated farm is more likely to be a new entrant compared with a male-operated farm, they are also more likely to be the ones leaving the sector after one census period—the turnover rate is higher for female operators. Joint operation of farms by both male and female decreases the probability of exiting after one census period, which suggests that the additional operator can provide support to the long-term success of the farm through additional financial, operational, and management support.
Entrants involving a single generation of operators are slightly less likely to exit after a single census period than entrants involving multigenerational operations. This appears contradictory to the results for exit in column (1), but note that multigenerational operation is only about 3 percent of the total entrants (as shown in Table 3) and the size of the coefficient estimate is small.
Entry-Exit farms tend to be smaller than Entry-Stay farms. The probability of Entry-Exit decreases with farmland. Similar results are found for capital and sales as shown in Supplementary Table A3. Less amount of capital and sales lower than the base category of $250,000–$499,000 are each correlated with a greater probability of Entry-Exit rather than Entry-Stay.
Entry-Exit farms are more likely to involve operations with smaller time commitments. For example, dairy farming reduces the probability of Entry-Exit by 8.8 percentage points compared with grain farmers who have entered at the same period. Beef and fruit farming also reduce the probability of exiting after one census period, while hog, poultry, sheep, other livestock, vegetable, greenhouse/horticulture, and other crop are more likely to be identified as Entry-Exit farms compared with grain operations. Notably, poultry and vegetable farming each increases the probability of being Entry-Exit farms by 10 percentage points as both are conducive to operating at a small scale for niche markets such as local and/or organic.
Population density of the CCS in which the farm is located increases the probability of being a new entrant but also increases the chance that a given entrant will have exited the sector by the next census period. Entrants are more likely to be transitory in higher population areas that provide greater opportunity for operations to meet niche demands for farmer's markets and other direct marketing methods (Govindasamy, Hossain, and Adelaja Reference Govindasamy, Hossain and Adelaja1999). In contrast, entrants are more likely to stay in the sector if the farm is located in traditional agricultural areas as proxied by greater median farm income for the region.
New entrants are more likely to continue operating in Quebec as compared with the majority of the rest of the country. While Quebec's policies have not affected the relative rate of entry, those policies appear to be increasing the retention rate of those entrants. Lastly, over time, the likelihood of entry and then exit has increased.
Robustness
Capital and sales variables are dropped in Table 4 given the concern of endogenous explanatory variables. Supplementary Tables A1 (Old Exit) and A2 (Entry-Exit) present the full set of results with and without capital and sales revenue. The results are robust to including capital and sales. Supplementary Tables A3 and A4 in the Appendix show the same set of results corresponding to Supplementary Tables A1 and A2, respectively, but using the logit model instead of the LPM and including time trend rather than year dummies. The signs of the coefficient estimates are largely consistent with the results from the LPM.
Conclusion
The steady gradual fall in farm numbers over time, combined with an increase in the average age for the remaining farmers, suggests a sector in decline, with the only new entrants being those transitioning into an existing family operation. However, the average 10 percent decline in farm numbers between census periods in Canada hides a sector much more dynamic than implied by the net values. Approximately one-quarter of the farms in a given census were not in operation five years previously and over one-third of the total farms in that same census will not be in business by the time of the next census. While the extent of entry indicates that it is possible to get into farming, the likelihood of these new farms being successful is low—less than half of the new entrants are out of the sector before the next census.
The relatively large number of entry and exits within the total number of farms is due in large part to what constitutes a farm. An individual is considered to be a farmer and operate a farm in Canada if there is an intention to sell agricultural produce. While there are minimum sales requirements in order to be deemed a farm in other jurisdictions, these sales criteria are still small. It is these small operations that tend to be transitory. The results of the analysis suggest that many of the factors that increase the exit of old farms also increase the exit of new entrants; farms operated by female operators, older operators, and smaller operations producing hog, poultry, vegetable and horticulture, located in more densely populated regions, are more likely to leave farming. Multigeneration involvement and a possible succession plan also contribute to the longevity of the farm operation after it has been launched. The results also highlight the decline of the mid-size operations and the growing importance of large farms in the overall share of production (Sumner Reference Sumner2014).
The results suggest that there may be a role to help provide new farmers with skills to stay in operation. While entry barriers do exist, it appears that the issue is largely with retention given that roughly half of the new entries are not farming by the time of the next census. Appropriate policies to aid in the attraction and retention of farms depends on the nature of the operation. There are multiple reasons for individuals to enter farming (Mishra and El-Osta Reference Mishra and El-Osta2016) and for farmers to exit the sector (Mishra, Fannin, and Joo Reference Mishra, Fannin and Joo2014), and the design of policies to alter the dynamics of the sector has to recognize the differences. Small, part-time farms could benefit from the enhancement of management skills and identification of premium market opportunities along with policies to increase the availability of start-up financing and tax reforms to reduce financial risk (Featherstone Reference Featherstone2018). In contrast, programs that aid in the matching and transfer of larger commercial farms with and without successors would ease the structural adjustments for those operations associated with the bulk of production in the sector.
Supplementary material
The supplementary material for this article can be found at https://doi.org/10.1017/age.2021.22.
Funding statement
This work was supported by the Ontario Ministry of Agriculture, Food and Rural Affairs (OMAFRA) under research grant 030243.


 Open access