


Introduction
Societal membership brings with it the expectation that each member is afforded the same rights, benefits, responsibilities and opportunities to contribute as all other members. Whether a small social club, local community or nation, the same expectation of equal rights for all members holds. Denying access or preventing utilisation of these rights excludes that person from full societal participation, giving rise to social exclusion.
The term ‘social exclusion’ is a contested one (Börsch-Supan et al. Reference Börsch-Supan, Kneip, Litwin, Myck, Weber, Börsch-Supan, Kneip, Litwin, Myck and Weber2015; Burchardt, Le Grand and Piachaud Reference Burchardt, Le Grand, Piachaud, Hills, Le Grand and Piachaud2002a; Moffatt and Glasgow Reference Moffatt and Glasgow2009; Silver Reference Silver1994), with variation in the way it is defined changing our understanding of the process. Key dimensions of definitions include who is excluded (e.g. minority versus majority, poor versus rich), how they are excluded (e.g. economic versus social, involuntary versus voluntary) and why they are excluded (e.g. individual versus structural causes). For example, there is a disparity in widely used conceptual frameworks that view ‘social exclusion’ as either synonymous with poverty – focusing specifically on economic exclusion – or as a broader more comprehensive term encompassing different types of exclusion and inequality (Burchardt, Le Grand and Piachaud Reference Burchardt, Le Grand, Piachaud, Hills, Le Grand and Piachaud2002a). Whilst there are many different theories and approaches to social exclusion, Atkinson (Reference Atkinson, Atkinson and Hills1998) proposed three elements of exclusion that are common throughout: (a) relativity – the requirement to consider people within the context of their society, not in isolation; (b) agency – who implements the act of exclusion, an individual can exclude themselves or can be excluded by others; and (c) dynamics – exclusion does not just influence current status but also future prospects.
The work presented here falls into the broader framework of multiple types of exclusion and draws on work by the Economic and Social Research Council (ESRC) Centre for Analysis of Social Exclusion – CASE (Hills, Le Grand and Piachaud Reference Hills, Le Grand and Piachaud2002), conceptualising social exclusion as a process by which ‘individuals or groups … are denied the opportunity of participation, whether they actually desire to participate or not’ (Barry Reference Barry, Hills, Le Grand and Piachaud2002: 16) ‘in the key activities of the society in which he or she lives’ (Burchardt, Le Grand and Piachaud Reference Burchardt, Le Grand, Piachaud, Hills, Le Grand and Piachaud2002b: 30). An important element of this definition is that it does not assume that the excluded is a ‘minority’, an assumption that may mask inequalities that exist for a majority group, such as where power over the majority is held by a minority with the most financial resources (Levitas Reference Levitas1998). Furthermore, this definition incorporates voluntary exclusion (discussed in detail by Barry Reference Barry, Hills, Le Grand and Piachaud2002), whereby people can still be excluded from activities in which they would not ordinarily choose to participate.
Whilst the above definition is broad enough to limit unintended implications about the nature of exclusion, its generality also makes it a difficult definition from which to begin to explore the process empirically. A commonly used working definition has been devised by Levitas et al., defining social exclusion as
a complex and multi-dimensional process. It involves the lack or denial of resources, rights goods and services, and the inability to participate in the normal relationships and activities, available to the majority of people in society, whether in economic, social, cultural or political arenas. It affects both the quality of life of individuals and the equity and cohesion of society as a whole. (Levitas et al. Reference Levitas, Pantazis, Fahmy, Gordon, Lloyd and Patsios2007: 9)
The work presented here therefore has its conceptual basis in the broader definition derived from the CASE work (Barry Reference Barry, Hills, Le Grand and Piachaud2002; Burchardt, Le Grand and Piachaud Reference Burchardt, Le Grand, Piachaud, Hills, Le Grand and Piachaud2002b), but uses the working definition of Levitas et al. (Reference Levitas, Pantazis, Fahmy, Gordon, Lloyd and Patsios2007) as its operational foundation.
A decade on from the proposal of these definitions, social exclusion remains an important topic relevant to societies across the world. Within Europe, the global financial crisis of 2007/2008 and the subsequent 2010 European sovereign debt crisis resulted in economic recession, the collapse of the housing market and increased unemployment. In the United Kingdom (UK), the crisis sparked changes in the foundations of UK domestic policy, moving away from the ‘moralistic new labour policies’ of the late 1990s, including the establishment of the Social Exclusion Unit, to a new era of economic austerity. At a European level, the European Commission's strategy for 2020 acknowledges the damage to both economic and social progress brought about by the financial crisis and proposes seven flagship initiatives to restore Europe's economy, including the European platform against poverty and social exclusion (European Commission 2010). The aim of this initiative is
to ensure social and territorial cohesion such that the benefits of growth and jobs are widely shared across the European Union and people experiencing poverty and social exclusion are enabled to live in dignity and take an active part in society. (European Commission 2011: 5)
Whilst a clear demonstration that social exclusion remains a priority area in Europe, the amalgamation of poverty and social exclusion into a single initiative appears to restrict its scope, focusing heavily on economic aspects of exclusion and financial hardship. The three indicators identified by the European Council as defining a reduction of poverty and exclusion, include: ‘the at-risk-of-poverty rate (after social transfers), the index of material deprivation and the percentage of people living in households with very low work intensity’ (European Commission 2011: 4). Therefore, despite a trend for social exclusion discourse to move away from being a solely economic concern to a much broader multi-dimensional concept, the financial crisis of the last decade has refocused fiscal policy, and consequently dialogue in political arenas surrounding social exclusion prioritises areas of economic exclusion.
Not to diminish the difficulties faced by those experiencing financial hardship, a core concern with an economically focused exclusion model is that fundamental needs are overlooked and subsequently strategic priorities further exclude large groups of the population. One population particularly at risk of social exclusion is older adults. The changing global demographic see people living longer than ever before (World Health Organization 2015), with increases in life expectancy in high-income countries due to declining mortality rates in those who are older (Christensen et al. Reference Christensen, Doblhammer, Rau and Vaupel2009). For some, longevity is accompanied by new opportunities, but for many people older age is associated with substantial changes and loss. Key life events that can drive social exclusion, such as the death of family or friends, the onset of ill-health or exiting the labour market can occur at any age, however, they are more likely in older age, disproportionately affecting those in later life (Phillipson and Scharf Reference Phillipson and Scharf2004) and increasing the vulnerability of this population. Lifecourse factors play a clear role in later-life social exclusion, e.g. having a low socio-economic status and financial difficulties as a working-age adult can result in a person being under-resourced for retirement, contributing to social exclusion during older age (Scharf, Phillipson and Smith Reference Scharf, Phillipson and Smith2005a). The increase in exclusion prevalence in later life may reflect an accumulation of contributing factors across the lifecourse, combined with fewer opportunities for older people to pull themselves out of exclusion compared to other age groups (Walsh, Scharf and Keating Reference Walsh, Scharf and Keating2017). Furthermore, cumulative advantage/disadvantage theory suggests there may be systemic intra-cohort differences in a given characteristic (e.g. money or health) over time, which potentially varies the risk of exclusion across birth cohorts (Dannefer Reference Dannefer2003; Scharf and Keating Reference Scharf, Keating, Scharf and Keating2012). Whilst older adults are able to move out of social exclusion, with Kneale (Reference Kneale2012) reporting an improvement in social exclusion status over a six-year period for 18.9 per cent of people aged 50 years and above, a greater proportion (23.9%) became more excluded, highlighting the difficulty for older adults to move out of social exclusion once they are experiencing it.
Experiences of social exclusion may be limited to a single dimension, however, exclusion on one domain increases the risk of experiencing exclusion on another (Barnes et al. Reference Barnes, Blom, Cox and Lessof2006). Becker and Boreham (Reference Becker and Boreham2009) found that 41 per cent of people aged 60–69 years experienced two or more of a potential 16 risk markers of exclusion with the number rising to 72 per cent of people aged 80 years and over. People who are excluded (particularly from social relationships, cultural activities, local amenities, decent housing and transport) are more likely to experience a poorer quality of life (Kneale Reference Kneale2012), and the consequences can be particularly severe for those experiencing multiple exclusion (Barnes et al. Reference Barnes, Blom, Cox and Lessof2006), with those excluded on three or more domains 4.35 times more likely to report feeling lonely six years later compared to those not excluded on any domain (Kneale Reference Kneale2012). These studies highlight the increased risk of social exclusion for adults as they get older, the negative consequences of exclusion on wellbeing and the risk of proliferating further exclusion. In sum, accumulation of risk factors across the lifecourse, susceptibility to multiple forms of exclusion and difficulty in exiting exclusion all impact on older adults and their experience of exclusion.
It is clear from the literature that social exclusion is a multi-dimensional process, however, the way in which these dimensions interact and knowledge about factors that attenuate or exacerbate this process are less well known. This paper will examine existing social exclusion frameworks and introduce a new working framework from which to begin detailed analysis of the complex nature of social exclusion. The aim of this working framework is to have a platform that will enable research to move beyond descriptive analysis to a more detailed examination of the relationships between different dimensions of exclusion and possible mediating and moderating factors. Following this, we will present our construction of a social exclusion measure using data from Understanding Society – the largest longitudinal household study in the UK (England, Wales, Scotland and Northern Ireland) which routinely measures people's social and economic circumstances, attitudes, behaviours and health (University of Essex 2015). We will present initial descriptive analysis using this measure, describing who is socially excluded, allowing us to confirm the suitability of our measure to explore social exclusion in depth in a number of subsequent papers.
Measuring social exclusion
A key challenge to understanding social exclusion is how it is operationalised. Social exclusion itself is not directly measurable, at least not at present, but its existence is inferred by the occurrence of other phenomena that act as indicators. A fundamental problem with assessing exclusion in this way is that these indicators generally measure participation and usage, rather than the actual act of exclusion, which makes it difficult to isolate the presence of exclusion from individual preference (Ward, Walsh and Scharf Reference Ward, Walsh and Scharf2014). This distinction between exclusion and preference captures the common element of agency proposed by Atkinson (Reference Atkinson, Atkinson and Hills1998). Measuring exclusion as a function of current participation also fails to capture what Atkinson (Reference Atkinson, Atkinson and Hills1998) referred to as dynamics, the potential for people to be lifted out of exclusion whether by acting themselves or through more formal interventions (Scharf and Keating Reference Scharf, Keating, Scharf and Keating2012). Ward, Walsh and Scharf (Reference Ward, Walsh and Scharf2014) also highlight that exclusion for one person may not manifest in the same way as exclusion for another person, and capturing such diversity meaningfully is a challenge. Whilst there is an element of individuality to exclusion by its very definition, it is relative and people cannot be considered in isolation (Atkinson Reference Atkinson, Atkinson and Hills1998). Consequently, it is important when measuring social exclusion to consider the optimal level of refinement needed in a comparison group to enable detection of exclusion, whilst still capturing some of the diversity that exists in the population; e.g. for later-life exclusion older people could be considered only in relation to other older people, rather than in the context of the majority of people in society (Scharf and Keating Reference Scharf, Keating, Scharf and Keating2012).
The way in which social exclusion is operationalised varies across studies and is often dependent on the measures available in the data-set being used. Building on the work of Walsh, O'Shea and Scharf (Reference Walsh, O'Shea and Scharf2012) and the scoping review of Walsh, Scharf and Keating (Reference Walsh, Scharf and Keating2017), Table 1 provides an overview of a number of different frameworks used in the literature to operationalise social exclusion. These frameworks include general population frameworks as well as those specifically looking at older age groups, and whilst not an exhaustive list, there is a clear pattern of domains across studies that can be broadly grouped into seven overarching domains. These domains are defined in Table 2, and include: service provision and access (SPA); social relations and resources (SRR); civic participation (CP); economic, financial and material resources; environment and neighbourhood; health and wellbeing; and discrimination. In contrast to the framework presented by Walsh, O'Shea and Scharf (Reference Walsh, O'Shea and Scharf2012), we consider SRR, and CP to be two separate domains, playing different roles in people's lives. The domain of SRR represent the close interactions within an individual's immediate environment, whereas CP includes wider engagement at community and societal levels, and consequently the manifestation and experience of exclusion is likely to differ. However, in comparison to Ogg (Reference Ogg2005), Barnes et al. (Reference Barnes, Blom, Cox and Lessof2006), Levitas et al. (Reference Levitas, Pantazis, Fahmy, Gordon, Lloyd and Patsios2007) and Kneale (Reference Kneale2012), we combine cultural activities and civic activities into a single domain of ‘CP’ that captures engagement with and contribution to communities and wider society, whether that be engaging with cultural heritage through the arts, being a member of a sports team or being a member of a trade union. Myck, Najsztub and Oczkowska (Reference Myck, Najsztub, Oczkowska, Börsch-Supan, Kneip, Litwin, Myck and Weber2015) constructed a severe deprivation indicator considered a proxy for social exclusion that is composed of material and social deprivation indices. The work by Myck, Najsztub and Oczkowska (Reference Myck, Najsztub, Oczkowska, Börsch-Supan, Kneip, Litwin, Myck and Weber2015) compares exclusion across a number of European countries, and whilst using only two domains to characterise exclusion may facilitate such cross-cultural comparison, we do not feel it would adequately allow the more detailed examination of complex exclusion pathways that we hope to achieve using our comparatively homogenous sample. Our domains are most similar to those of Walsh, Scharf and Keating (Reference Walsh, Scharf and Keating2017), however, we also include health and wellbeing as a domain of exclusion.
Table 1. Summary of social exclusion frameworks
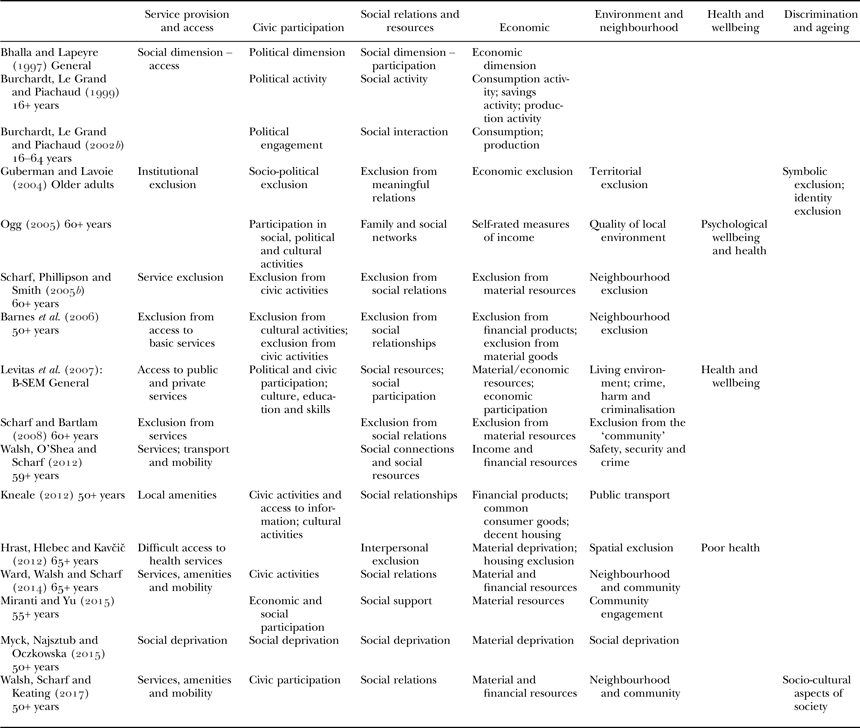
Note: B-SEM: Bristol Social Exclusion Matrix.
Source: Adapted from Walsh, O'Shea and Scharf (Reference Walsh, O'Shea and Scharf2012); Walsh, Scharf and Keating (Reference Walsh, Scharf and Keating2017).
Table 2. Definitions of social exclusion domains
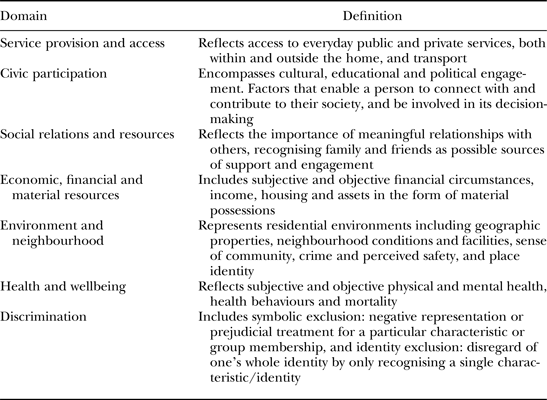
Source: Adapted from Scharf, Phillipson and Smith (Reference Scharf, Phillipson and Smith2005b); Barnes et al. (Reference Barnes, Blom, Cox and Lessof2006); Levitas et al. (Reference Levitas, Pantazis, Fahmy, Gordon, Lloyd and Patsios2007); Grenier and Guberman (Reference Grenier and Guberman2009).
It is also important to note that social exclusion is a dynamic process changing as people's circumstances change so that their level of engagement varies across their life. As people's needs change with age, how we conceptualise exclusion also changes, and whilst the overall framework of exclusion may remain constant, the specific indicators used in the operationalisation are modified across the lifecourse. For example, within the economic domain, being in education, training or paid work is often the focus for children and working-age adults, but for older adults the focus is more on savings and current material resources. Similarly, housing adequacy is often considered an indicator for children and older adults but not for working-age adults (Levitas et al. Reference Levitas, Pantazis, Fahmy, Gordon, Lloyd and Patsios2007).
The seven social exclusion domains outlined in Table 2 summarise the principle areas in which people experience exclusion, however, what is less clear is how these domains may function. The interactive nature of these domains mean that there is not a simple unidirectional relationship between them (Levitas et al. Reference Levitas, Pantazis, Fahmy, Gordon, Lloyd and Patsios2007; Walsh, O'Shea and Scharf Reference Walsh, O'Shea and Scharf2012), with each domain potentially acting as a determinant, a moderator or an outcome of exclusion, as well as being used as an indicator of exclusion itself. Walsh, Scharf and Keating define old-age exclusion:
Old-age exclusion involves interchanges between multi-level risk factors, processes and outcomes. Varying in form and degree across the older adult life course, its complexity, impact and prevalence are amplified by old-age vulnerabilities, accumulated disadvantage for some groups, and constrained opportunities to ameliorate exclusion. Old-age exclusion leads to inequities in choice and control, resources and relationships, and power and rights in key domains of neighbourhood and community; services, amenities and mobility; material and financial resources; social relations; socio-cultural aspects of society; and civic participation. Old-age exclusion implicates states, societies, communities and individuals. (Walsh, Scharf and Keating Reference Walsh, Scharf and Keating2017: 93)
This definition highlights the dynamic nature of the multi-dimensional process, the interaction between processes and outcomes, and characterises impact on wellbeing as the core outcome of social exclusion.
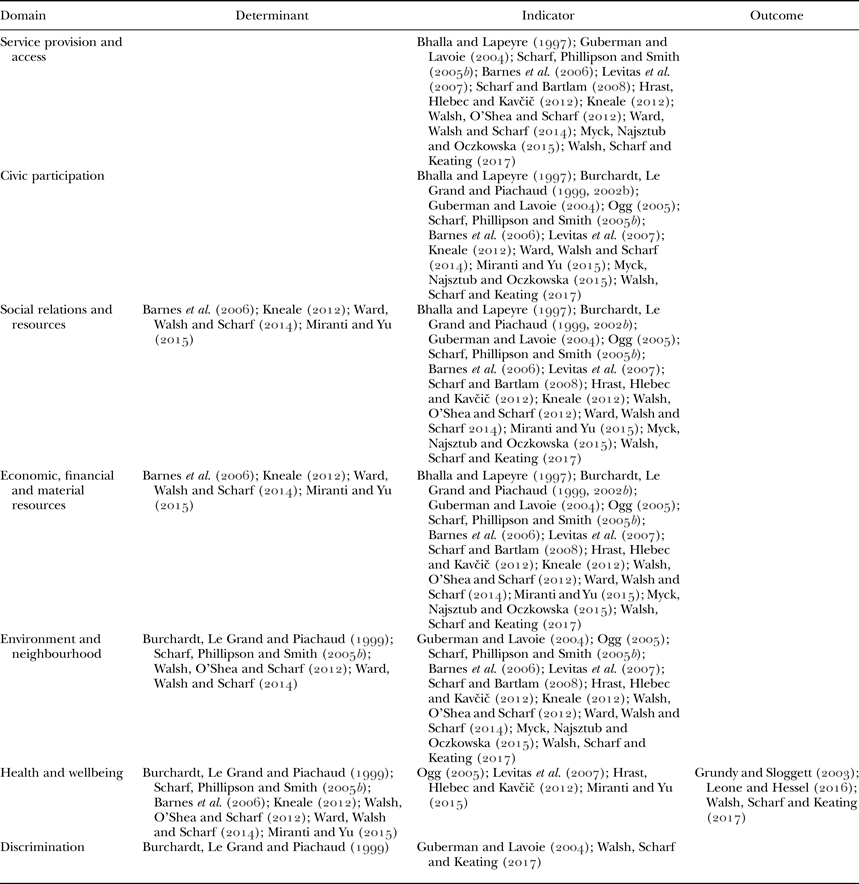
The conceptualisation of domains as determinants, indicators and, in some cases, outcomes of social exclusion (Table 3) makes understanding this complex, dynamic process a challenge, particularly when trying to operationalise these frameworks for hypothesis testing of relationships, to move beyond descriptive accounts. A new working framework is therefore needed which begins to separate out the differing roles these domains play in the social exclusion process, facilitating a more comprehensive examination of the relationships between domains, and ultimately a clearer understanding of the social exclusion process.
Table 3. Domains as determinants, indicators and outcomes of social exclusion
A working framework of social exclusion in later life
In order to examine interactions between different dimensions of social exclusion we first construct a working framework of individual social exclusion from which to directly examine some of these relationships (Figure 1). To enable hypothesis testing it is important to separate out determinants from indicators of exclusion and to this end we conceptualise social exclusion as three of the domains identified in Table 1, reflecting institutional aspects (SPA) and social aspects (SRR and CP). Given the contested nature of social exclusion and poverty (Burchardt, Le Grand and Piachaud Reference Burchardt, Le Grand, Piachaud, Hills, Le Grand and Piachaud2002a), it is important to have conceptual clarity on the distinction between social exclusion and economic exclusion, and we therefore rejected the economic domain as an indicator, but continue to view it as a determinant. We also consider environment and neighbourhood to be a determinant rather than an indicator of social exclusion, as perceptions of safety and cohesiveness will influence the extent to which someone feels able to participate or is excluded. We consider the domain of health and wellbeing to be both a determinant and an outcome of social exclusion, rather than being a key indicator, with existing evidence showing that poor health and limiting longstanding illness is associated with increased risk of social exclusion (Barnes et al. Reference Barnes, Blom, Cox and Lessof2006; Becker and Boreham Reference Becker and Boreham2009; Kneale Reference Kneale2012; Scharf, Phillipson and Smith Reference Scharf, Phillipson and Smith2005b), and that socio-economic indicators, social resources (Grundy and Sloggett Reference Grundy and Sloggett2003) and social participation (Leone and Hessel Reference Leone and Hessel2016) are associated with health outcomes. The relationship between social exclusion and the domains of health and wellbeing, and environment and neighbourhood are examined in more depth in companion articles (Netuveli, personal communication, 2017; Sacker et al. Reference Sacker, Ross, MacLeod, Netuveli and Windle2017). Finally, the domain of discrimination and ageing is composed of symbolic and identity exclusion (identified by Guberman and Lavoie Reference Guberman and Lavoie2004), which we consider to run through each of the other domains, operating at a macro level in a similar way to demographic trends, labour market status and social policy factors. We therefore do not include discrimination and ageing as a specific dimension in our working framework.

Figure 1. Illustration of a working framework of social exclusion in later life. Social exclusion is measured through three domains: service provision and access, civic participation, and social relationships and resources. The domains of environment, socio-economic exclusion and health are all considered to be determinants of social exclusion, with health also considered an outcome. Discrimination is believed to run through all domains and is therefore captured within all other areas, rather than being represented as a domain in its own right.
To summarise, our social exclusion measure consists of three domains: SPA, CP and SRR. Each domain is comprised of a number of indicators taken from the Understanding Society survey, with each domain constructed as follows: SPA is constructed from indicators covering access to basic services, quality of local services, and access to sports or leisure facilities; the domain of CP is comprised of engagement in activities of an organisation, volunteering, and participation in cultural, sport or leisure activities; finally, the domain of SRR includes living alone, contact with children, marriage or partnership closeness, friendships, and going out socially or visiting friends.
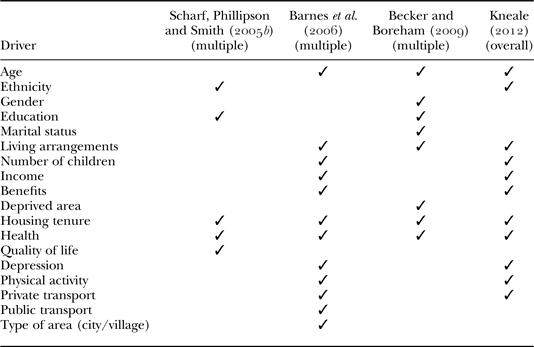
The working model also identifies a number of control variables, demographic variables that are known drivers of social exclusion. Levitas et al. (Reference Levitas, Pantazis, Fahmy, Gordon, Lloyd and Patsios2007) identified seven social exclusion risk/protective factors, including gender, ethnicity, social class, housing tenure, household composition, religious affiliation and critical life events. Looking more specifically at older adults in the UK, Scharf, Phillipson and Smith (Reference Scharf, Phillipson and Smith2005b), Barnes et al. (Reference Barnes, Blom, Cox and Lessof2006) and Becker and Boreham (Reference Becker and Boreham2009) identify a number of factors associated with risk of experiencing multiple exclusion, and Kneale (Reference Kneale2012) investigated factors associated with an overall measure of exclusion (Table 4). As a further illustration of the complex multi-dimensionality of social exclusion, a number of these drivers fall under the domain indicators discussed above. For example, health, quality of life, depression and physical activity all fall under the domain of health and wellbeing; income, benefits as main source of income and housing tenure are encapsulated by the socio-economic domain; living in a deprived neighbourhood falls under the environment and neighbourhood domain; living arrangements and number of children are encapsulated by the SRR domain; and religious affiliation overlaps with the domain of CP, which includes being involved in the activities of religious organisations. Furthermore, whilst critical life events (e.g. bereavement, divorce, relationship breakdown, retirement and institutionalisation) are known drivers of social exclusion (Levitas et al. Reference Levitas, Pantazis, Fahmy, Gordon, Lloyd and Patsios2007) and can be particularly prominent in later life (Phillipson and Scharf Reference Phillipson and Scharf2004), we do not feel it is possible to control adequately for these in our working framework. It is difficult to disentangle some life events from some of our domains of social exclusion. For example, bereavement would invariably impact on a person's SRR but the co-variance between the event and how we measure this domain of exclusion limits any potential benefits from controlling for the event in terms of understanding social exclusion mechanisms and pathways (i.e. controlling for recent bereavement resulting from death of a spouse could obscure any effect of exclusion from SRR where not living with a partner is a core element of its measurement). Our control variables include factors that are known to be associated with social exclusion, but are not directly incorporated by one of the key domains, and include age, gender, marital status, ethnicity, highest qualification and social class. We also include job status as a known driver of exclusion from CP (Kneale Reference Kneale2012) and place of birth as an alternative indicator to ethnicity.
Table 4. Drivers of social exclusion for older adults in the United Kingdom
The working framework also includes a number of variables that we believe may mediate or moderate the relationship between determinants and indicators, such as having access to a car (Barnes et al. Reference Barnes, Blom, Cox and Lessof2006; Kneale Reference Kneale2012) and access to information and communications technology (ICT), such as owning a mobile phone and using the internet (Age UK 2010). These mediating factors are all known drivers of social exclusion that are comparatively modifiable at the individual level, when considered in relation to control drivers, and are therefore potential targets for intervention. Type of residential area (Barnes et al. Reference Barnes, Blom, Cox and Lessof2006) is also included as a mediator, and is considered a modifiable variable albeit at a wider community level.
Social exclusion risk is also dependent on a number of macro-level factors such as demographic trends, labour market status and social policy (Bradshaw et al. Reference Bradshaw, Kemp, Baldwin and Rowe2004). Whilst these macro-level factors are important and provide societal context in which social exclusion exists, the work presented here focuses on micro-level risk factors including individual demographic membership and domain factors.
The aim of the next section is to outline the construction of our later-life social exclusion measures using Understanding Society. We will then check the validity of these measures by running a basic descriptive analysis with people aged 65 years and over in Understanding Society to see who is most excluded, and determine if our results are consistent with findings in the literature of UK populations. Our analysis examines the socio-demographic characteristics classified as control variables, including age, gender, marital status, ethnicity, place of birth, social class, highest qualification and job status. Operating within the working framework, we construct measures of exclusion from SPA, CP, SRR, as well as a summed total social exclusion score. Using these constructed measures we will be able to examine the complex pathways and mechanisms through which social exclusion exists, as outlined in our new working framework. A number of companion articles will follow this work, examining the relationships between social exclusion and health as both a determinant and an outcome (Sacker et al. Reference Sacker, Ross, MacLeod, Netuveli and Windle2017), and the domain of environment and neighbourhood as a determinant of social exclusion (Netuveli, personal communication, 2017).
Methods
Data-set
Data for this study come from the first three waves of Understanding Society (University of Essex 2015) – the UKHLS. Understanding Society is an ongoing nationally representative longitudinal household study, which began in 2009 with an aim of recruiting over 100,000 individuals in 40,000 households. The data collection period takes two years to complete one wave of the study. All persons in the household aged 10 and older are eligible to be surveyed annually. Adults, 16 years and older, are given a combination of computer-assisted personal interview and self-completion questionnaire. The topics covered include subjective wellbeing, employment status, health status, and various other economic and social topics. More detailed information on the sampling frame and data collection procedures are available (Buck and McFall Reference Buck and McFall2012).
Sample
The study sample includes all respondents who were aged 65 years and over in Wave 3 of Understanding Society who were not missing on more than one item in any one sub-scale: SPA, CP or SRR (92.6%, N = 8,578). As social exclusion was measured over two waves of Understanding Society (Waves 2 and 3), respondents were present in both.
Measures
Measuring social exclusion in Understanding Society
As a secondary analysis of social exclusion, the operationalisation is inevitably constrained by the measures available in the data. Understanding Society encompasses a very broad range of indicators suitable for its measurement, however, these do not always appear in the same survey wave. To overcome this problem, the definition of social exclusion used here spans two waves of data collection, Waves 2 and 3.
Social exclusion as defined here is made up of three separate domains: SPA, CP and SRR. Each comprises four or five characteristics of a person's life selected to capture a relevant aspect of that domain.
The guiding principle for deriving items which make up each domain was to define respondents as socially excluded if they were located within the most excluded quartile for a particular item. Where this approach was not feasible, a cut-off closest to one quartile was used. Respondents identified as socially excluded on an item received a score of one for that item, as detailed below.
Service provision and access (SPA)
SPA encompasses access to basic services, quality of local services, and access to sports or leisure facilities. Respondents were asked whether they were able to access all services such as health care, food shops or learning facilities when they needed to. Those who reported they were not scored 1. Respondents were also asked to rate a selection of local facilities as ‘excellent’, ‘very good’, ‘fair’ or ‘poor’. A rating of ‘fair’ or ‘poor’ in relation to medical or shopping facilities each scored 1, and a rating of ‘poor’ in relation to leisure facilities scored 1. Respondents also scored 1 if they reported finding it ‘difficult’ or ‘very difficult’ to get to a sports or leisure facility, including leisure centre, recreation ground or park, if they wanted to participate in sports and leisure activities. Scores were then summed to give an overall scale from 0 to 5 with high scores indicating poorer SPA.
Civic participation (CP)
CP encompasses engagement in the activities of an organisation, participation in cultural, sport or leisure activities, and volunteering. Respondents were asked whether they regularly joined in the activities of a listed organisationFootnote 1 regardless of whether they were a member or not. Those who reported that they did not scored 1.
Participation in cultural, sport or leisure activities measures both breadth and frequency. Respondents were presented with separate lists of art activities,Footnote 2 art events,Footnote 3 visits to historic sitesFootnote 4 and both ‘mild’Footnote 5 and ‘moderate’Footnote 6 sports or leisure activities and asked which if any they had partaken in during the last 12 months. They were also asked whether they had visited a public library, an archive centre or records office, or an art gallery or museum. Respondents within the bottom quartile of the total number of activities engaged in during the last 12 months scored 1.
Respondents were also asked the frequency with which they had participated. Six separate frequencies were recorded for ‘art activities’, ‘art events’, ‘visits to historic sites’, ‘visits to public libraries’, ‘visits to archive centres or record offices’ and visits ‘to art galleries or museums’ ranging from ‘once in the last 12 months’ to ‘at least once a week’. Responses were converted to approximate the number of days this represented in the last 12 months: ‘not at all’ (0), once in the last 12 months (1), twice in the last 12 months (2), less often than once a month but at least three or four times a year (4), less often than once a week but at least once a month (26), and at least once a week (52). Slightly different approximations were derived for sport or leisure activities because of minor differences in the response categories.Footnote 7 The eight frequencies were then summed into one overall frequency of participation in cultural, sport or leisure activities. Respondents within the bottom quartile scored 1. Respondents also scored 1 if they had not volunteered in the last 12 months. Scores were then summed and recalibrated to give an overall scale from 0 to 5 with higher scores indicating poorer CP.
It is important to note that there is some overlap between the domains of SPA and CP with regards to access to facilities that enable participation (such as access to sport and leisure facilities which forms part of the domain of SPA) and the act of participation itself (CP). Whilst we acknowledge that there is overlap between these domains, we do not consider these to reflect the same domain, with access to facilities by their very nature being a facilitator to participation, in much the same way as economic factors or social resources can facilitate participation. Whilst these resources may all facilitate an individual to participate, they do not in themselves reflect the engagement with and contribution to communities and wider society that comes with participation.
Social relations and resources (SRR)
SRR encompass living alone, contact with children, marriage or partnership closeness, friendships, and going out socially or visiting friends.
Closeness of a partnership was measured according to the respondent's responses to the statements: ‘How much do they really understand the way you feel about things?; How much can you rely on them if you have a serious problem?; How much can you open up to them if you need to talk about your worries?; How much do they criticise you?; How much do they let you down when you are counting on them?; and How much do they get on your nerves?’ Responses to the first three questions were coded 0 (not at all), 1 (a little), 2 (somewhat) and 3 (a lot), and in reverse for the latter three. The six items were summed to construct a scale. Respondents within the bottom quartile scored 1.
Unlike other items constructed to measure exclusion, respondents who lived alone scored 2. This compensates for the fact that closeness of partnerships is only relevant to married or co-habiting respondents. As a consequence, a respondent scored 2 if they lived alone and 1 if they were in a marriage or partnership that was not very close.
Respondents who reported having a child aged 16 or more living outside the home were asked how often they saw them (if they had more than one child this was the child they saw most often). Responses were converted to approximate the number of days this represented in the last 12 months: never or no child living outside the home (0), less often than several times a year (2), several times a year (8), at least once a month (12), at least once a week (52) and daily (365). Respondents were also asked how often they had contact by telephone, email or letter, which was coded using the same approach above and then divided by two, lending greater weight to face-to-face contact. The two frequencies were summed and respondents within the bottom quartile scored 1.
Respondents were asked the number of close friendships they had, and those within the bottom quartile scored 1. Respondents also scored 1 if they reported not going out socially or visiting friends when they felt like it. Scores were then summed to give an overall scale from 0 to 5, with higher scores indicating poor SRR.
Imputation for item missingness and overall total social exclusion
Prior to the construction of an overall total social exclusion scale and three separate sub-scales relating to the domains above, imputation using chained equations was employed in Stata 14.0 (Royston Reference Royston2004, Reference Royston2005) to impute missing values for respondents who were missing a single item within a sub-scale. Table 5 presents the relevant prevalence for the above items pre- and post-imputation.
Table 5. Pre- and post-imputation prevalence for each exclusion item
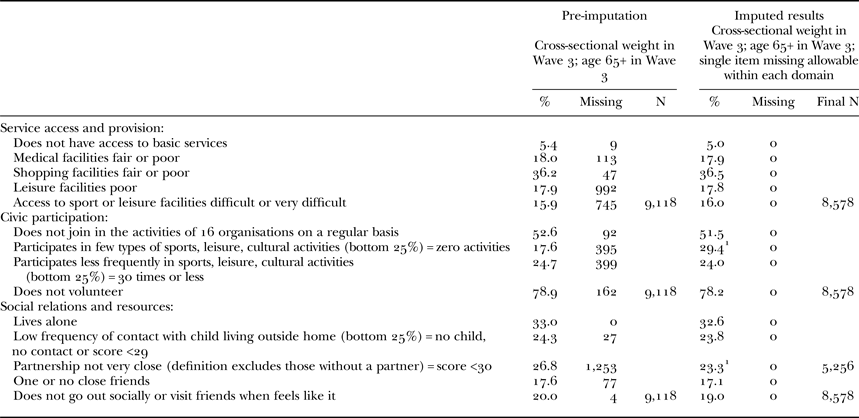
Note: 1. New cut-point for bottom 25 per cent implemented after imputation.
Post-imputation, scores were summed to construct scales from 0 to 5 for SPA, CP and SRR. An overall total scale measuring social exclusion on a scale of 0–15 was constructed from their combined scores with higher scores indicating greater exclusion.
Control variables/covariates
A number of control variables are included in the working framework. These are variables identified as risk/protective factors and include age, age-squared (to account for non-linear age relationships), gender (male or female), marital status (married/in civil partnership, living as a couple, single never married/in civil partnership, separated or divorced, or widowed), ethnicity (white or non-white), place of birth (born in the UK or elsewhere), social class (National Statistics Socio-economic Classification (NS-SEC): managerial and professional, intermediate, small employer and own account, lower supervisor and technical, semi-routine and routine occupations, or whether the respondent never had a job), highest qualification (degree, other higher, A-level or equivalent, General Certificate of Secondary Education (GCSE) or equivalent, other, or no qualifications) and job status (whether the respondent was in work or not). Here, we use these control variables to assess the validity of our chosen social exclusion indicators.
Data analysis
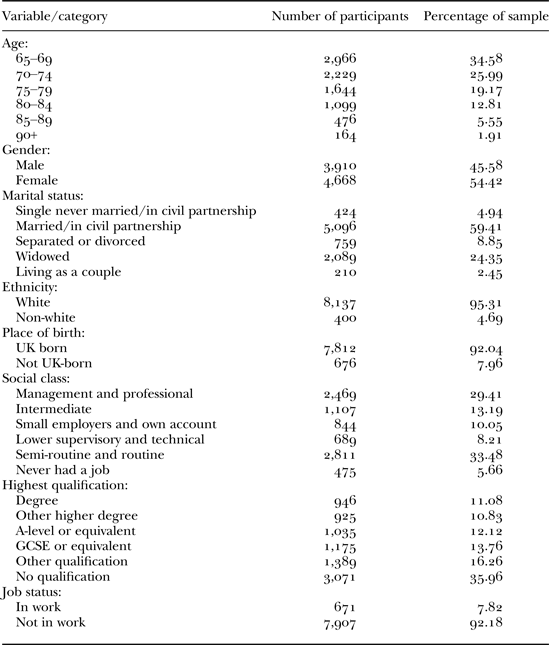
Descriptive analysis was undertaken to assess whether those considered more at risk of social exclusion in the literature were identified in our sample as experiencing greater exclusion. First, the effect of age on social exclusion was assessed using a simple linear regression. To avoid possible confounds with age, subsequent analysis used linear regression controlling for age and age-squared to examine the effects of other demographic variables on social exclusion. Age was held constant at the mean age of 74 years when estimating margins for each of the demographic variables. For consistency, Wald test results are presented for all age-adjusted analyses. All analyses used survey methods in Stata 11 (StataCorp 2009) to adjust standard errors for the unequal probability of being sampled and data were weighted to take account of attrition and the non-response of eligible participants. Participant numbers for each analysis are presented in Table 6.
Table 6. Participant numbers by demographic characteristic
Note: GCSE: General Certificate of Secondary Education.
Results
There was a significant effect of age on total social exclusion score (F(5, 1,840) = 84.54, p ⩽ 0.001), with the risk of exclusion being greater with increasing age. Scores ranged from 4.03 (confidence interval (CI) = 3.92–4.13) in the 65–69 years group through to 7.43 (CI = 6.96–7.9) in the 90+ years group (full results can be found in Table 7). The same pattern of results was found for each social exclusion domain, with significant effects of age on SPA (F(5, 1,840) = 11.05, p ⩽ 0.001), CP (F(5, 1,840) = 38.10, p ⩽ 0.001) and SRR (F(5, 1,840) = 89.96, p ⩽ 0.001).
Table 7. Linear regression of age on social exclusion domain

Note: CI: confidence interval.
Service provision and access (SPA)
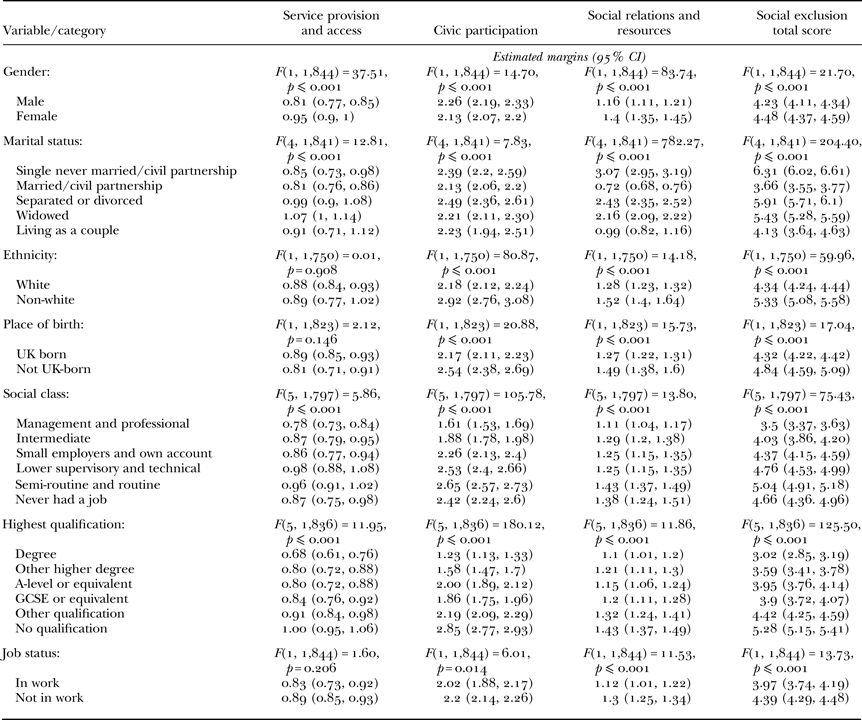
Table 8 shows age-adjusted estimated margins (held at 74 years) with 95 per cent CI. Gender (F(1, 1844) = 37.51, p ⩽ 0.001), marital status (F(4, 1841) = 12.81, p ⩽ 0.001), social class (F(5, 1797) = 5.86, p ⩽ 0.001) and highest qualification (F(5, 1836) = 11.95, p ⩽ 0.001) were all significant predictors of SPA. Women (scored 0.14 higher than men), those widowed or separated/divorced (scored 0.26 and 0.18 higher than those who were married/in civil partnership, respectively), those of more disadvantaged social class (scored 0.20 points greater for lower supervisory and technical jobs and 0.18 greater for semi-routine and routine jobs compared to management and professional jobs) and those holding no qualifications scored highest (with a score of 0.32 higher than those with degrees) and therefore experience greater exclusion from services. No significant effects of ethnicity, place of birth or job status on SPA were found. Interestingly, looking at the breakdown of social class, those who ‘never had a job’ had similar exclusion scores to those in intermediate, and small employers and own account categories (with scores of 0.08, 0.08 and 0.07 higher than management and professional jobs, respectively).
Table 8. Age-adjusted linear regression of demographic variables on social exclusion domain
Notes: CI: confidence interval. GCSE: General Certificate of Secondary Education.
Civic participation (CP)
For CP there were significant effects of gender (F(1, 1,844) = 14.70, p ⩽ 0.001), marital status (F(4, 1,841) = 7.83, p ⩽ 0.001), ethnicity (F(1, 1,750) = 80.87, p ⩽ 0.001), place of birth (F(1, 1,823) = 20.88, p ⩽ 0.001), social class (F(5, 1,797) = 105.78, p ⩽ 0.001), highest qualification (F(5, 1,836) = 180.12, p ⩽ 0.001) and job status (F(1, 1,844) = 6.01, p = 0.014). In contrast to SPA, men scored higher (by 0.13 points) than women, suggesting men are more excluded from CP. People who were single or separated/divorced scored 0.26 and 0.35 higher, respectively, than those married/in civil partnership. Participants who were non-white were more excluded (with a score of 0.75 points higher) than white participants, and those born outside the UK scored higher (+0.37) than those born in the UK. Those from lower supervisory and technical jobs, semi-routine and routine jobs, or had never worked scored higher (0.92, 1.05 and 0.81 points, respectively) than those from management or professional jobs. Those with no qualifications (+1.62) and those not working (+0.18) scored higher than those with a degree and those in work.
Social relations and resources (SRR)
Gender (F(1, 1,844) = 83.74, p ⩽ 0.001), marital status (F(4, 1,841) = 782.27, p ⩽ 0.001), ethnicity (F(1, 1,750) = 14.18, p ⩽ 0.001), place of birth (F(1, 1,823) = 15.73, p ⩽ 0.001), social class (F(5, 1,797) = 13.80, p ⩽ 0.001), highest qualification (F(5, 1,836) = 11.86, p ⩽ 0.001) and job status (F(1, 1,844) = 11.53, p ⩽ 0.001) were also significant predictors of SRR. Women were more excluded than men (+0.24), and those who were single and never married (+2.35), separated/divorced (+1.71), widowed (+1.44) and those living as a couple (+0.27) all scored higher than those married/in civil partnership. Participants who were non-white were more excluded (+0.24) than white participants, and those born outside the UK scored higher (+0.22) than those born in the UK. People who worked in semi-routine and routine roles, and those who had never worked scored highest (0.33 and 0.27 higher than those from management and professional jobs, respectively) from the social class categories, and those with no qualifications scored 0.32 points higher than those with a degree, and were the most excluded from the highest qualification categories. People not in work scored higher than those in work by 0.18 points.
Overall total exclusion score
Finally, the results from the total exclusion score in general mirror those of the sub-domains, with marital status (F(4, 1,841) = 204.40, p ⩽ 0.001), ethnicity F(1, 1,750) = 59.96, p ⩽ 0.001), place of birth (F(1, 1,823) = 17.04, p ⩽ 0.001), social class (F(5, 1797) = 75.43, p ⩽ 0.001), highest qualification (F(5, 1,836) = 125.50, p ⩽ 0.001) and job status (F(1, 1,844) = 13.73, p ⩽ 0.001) all significant predictors of social exclusion. People who were single and never married (+2.65), separated/divorced (+2.25) and those widowed (+1.77) all scored higher than those married. Non-white participants scored higher (+0.99) than white participants, and those who were not born in the UK scored higher (+0.52) than those who were. Overall social exclusion increased as social class became more disadvantaged, with the exception of people who had never had a job who had a mid-range score. Those with ‘other’ or no qualifications scored highest (1.40 and 2.26 points higher than those with a degree) from the qualifications categories, and those not in work scored 0.42 points higher than those in work. Gender was also a significant predictor of social exclusion (F(1, 1,844) = 21.70, p ⩽ 0.001), with women overall more excluded than men, scoring 0.26 points higher, reflecting the results found for the domains SPA and SRR.
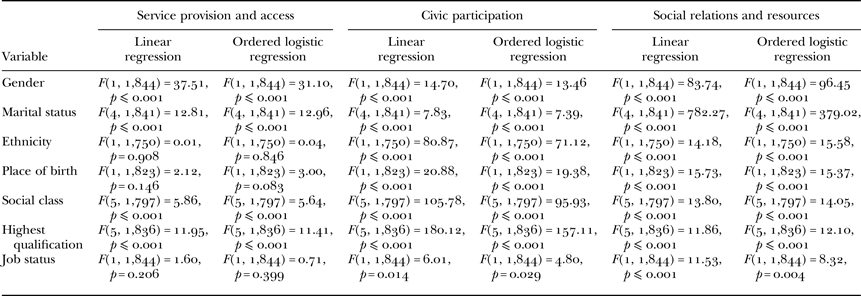
Due to the skewed distribution of the social exclusion sub-domains, additional ordered logistic regression analyses were conducted for each demographic variable and exclusion domain, revealing the same pattern of results. Table 9 provides a comparison of the linear and ordered logistic regression results.
Table 9. Comparison of linear and ordered logistic regression of demographic variables on social exclusion domain
Discussion
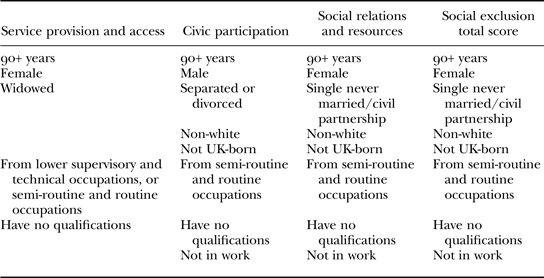
All demographic variables analysed were significant predictors of CP, SRR and overall total social exclusion score, with gender, marital status, social class and highest qualification also predicting SPA. As expected, the degree of exclusion experienced by people increased with age, with the oldest-old experiencing more exclusion overall and on each domain. These overall results reflect the findings of Barnes et al. (Reference Barnes, Blom, Cox and Lessof2006) and Kneale (Reference Kneale2012). Table 10 provides a summary of the highest scoring demographic characteristics for each social exclusion domain, providing an indication of who might be at greatest risk of exclusion.Footnote 8
Table 10. Highest scoring statistically significant demographic factors for each social exclusion domain
When controlling for age, women were more excluded than men for SPA, SRR and overall exclusion score, while men scored higher on CP. In contrast, previous studies have found that men score higher for SRR (Barnes et al. Reference Barnes, Blom, Cox and Lessof2006; Kneale Reference Kneale2012) and women for CP (Barnes et al. Reference Barnes, Blom, Cox and Lessof2006; Kneale Reference Kneale2012; Scharf, Phillipson and Smith Reference Scharf, Phillipson and Smith2005b). Measures of SRR were similar across studies, however, a possible explanation for the different patterns seen in Barnes et al. (Reference Barnes, Blom, Cox and Lessof2006) and Kneale (Reference Kneale2012) is that both studies use a younger sample, including participants aged 50 years and over, compared to 65 years and over in the current study. This age difference may explain the differing pattern of SRR exclusion results, because increased age is associated with increased exclusion from SRR (in the current study; Barnes et al. Reference Barnes, Blom, Cox and Lessof2006; Kneale Reference Kneale2012) and women live longer than men (Office for National Statistics 2015), suggesting that there would be a greater representation of women in the older age categories and that the average age for women would be higher. Breaking down the SRR domain into individual items shows that the only item where women were not more excluded than men in the current study was contact with children, where men were more excluded.
There was also a discrepancy in the pattern of results for gender and CP. In contrast to the SRR measures, the detail of the items making up the CP score across studies differs. The measures presented here include art activities and sporting activities which were not included in the measures employed by Scharf, Phillipson and Smith (Reference Scharf, Phillipson and Smith2005b), Barnes et al. (Reference Barnes, Blom, Cox and Lessof2006) or Kneale (Reference Kneale2012). The measure used by Scharf, Phillipson and Smith (Reference Scharf, Phillipson and Smith2005b) focused on civic activities but did not include cultural activities, and whilst Barnes et al. (Reference Barnes, Blom, Cox and Lessof2006) and Kneale (Reference Kneale2012) included attending arts events/visits to historic sites and civic activities similar to those used in the current study (with an additional question on voting), they did not include participation in art or sporting activities. As discussed in relation to SRR, the younger mean age of the Barnes et al. (Reference Barnes, Blom, Cox and Lessof2006) and Kneale (Reference Kneale2012) samples may have also contributed to the different patterns of results, where Kneale (Reference Kneale2012) found that exclusion from cultural activities was greatest amongst those aged 50–60 years, whereas the same age group was least likely to be excluded from civic activities, with exclusion increasing with increasing age. In contrast, Barnes et al. (Reference Barnes, Blom, Cox and Lessof2006) found a higher percentage of those over 80 years were excluded from both cultural activities and civic activities, followed by those aged 50–59 years, with the lowest percentages found for those aged 60–80 years. There may be an age by gender interaction in these earlier studies that accounts for the different pattern of results seen in the present study where age is held constant at 74 years. Furthermore, Scharf, Phillipson and Smith (Reference Scharf, Phillipson and Smith2005b) focused on a very specific type of community, those in deprived urban communities in England, which are inherently different from the broader UK-wide population examined here, making direct comparison problematic. Breaking down the CP measure into individual items showed that in the current study men are less likely to partake in cultural activities, but when they do engage in an activity they do so more frequently. There were no significant gender differences on items relating to civic activities (membership of organisations and volunteering).
There was some variation across existing studies on the extent of the relationship between marital status and exclusion, that is whether increased risk was associated with divorce, separation, widowhood, being single or a combination of these. However, a status other than ‘married’ was typically associated with increased risk of exclusion (Barnes et al. Reference Barnes, Blom, Cox and Lessof2006; Kneale Reference Kneale2012; Scharf, Phillipson and Smith Reference Scharf, Phillipson and Smith2005b) and these findings were reflected in the current study. People not working were more excluded than those in work on CP and SRR, a finding consistent with those of Barnes et al. (Reference Barnes, Blom, Cox and Lessof2006) and Kneale (Reference Kneale2012). Non-white participants were more excluded than white participants on CP and SRR, consistent with Barnes et al. (Reference Barnes, Blom, Cox and Lessof2006) and Kneale (Reference Kneale2012) for CP, however, neither Barnes et al. (Reference Barnes, Blom, Cox and Lessof2006) nor Kneale (Reference Kneale2012) reported significant ethnicity effects for SRR. People with no qualifications scored higher than those with some qualifications on all three exclusion domains consistent with the findings of Kneale (Reference Kneale2012).
The interesting finding that those who had never had a job scored mid-range on SPA and total exclusion score may reflect a tradition for women to manage the household in older generations, rather than having their own careers, and therefore the NS-SEC may not be reflective of social-economic classification for these participants. The data show that 64 per cent of those who never had a job were women, going some way to support this theory. Alternatively, it may be that those who had never had a job became more adept at obtaining access to services across their lifespan, and therefore experience less exclusion in later life. The scores for people who had never had a job in the CP and SRR domains were more in line with those in more disadvantaged social class groups.
Direct comparisons with findings from previous studies were limited to those of UK populations to reduce the chance of non-measurement-related variability; however, a number of important population differences still remained. The inclusion of younger participants in the sample (Barnes et al. Reference Barnes, Blom, Cox and Lessof2006; Kneale Reference Kneale2012), a sample specifically from deprived urban communities (Scharf, Phillipson and Smith Reference Scharf, Phillipson and Smith2005b) and a focus by all three studies on England rather than the UK as a whole (Barnes et al. Reference Barnes, Blom, Cox and Lessof2006; Kneale Reference Kneale2012; Scharf, Phillipson and Smith Reference Scharf, Phillipson and Smith2005b), mean that the studies are not directly comparable, and may have resulted in some of the deviations seen in the current study, such as reversed gender effects for CP and SRR. However, overall the findings were generally in line with what would be expected from the literature, suggesting that our measure of social exclusion using Understanding Society is suitable for further exploration of relationships between exclusion domains, albeit with careful consideration when interpreting any gender effects.
There are a number of limitations to the working framework and measures that should be noted. Firstly, the measures used for each of the social exclusion domains are restricted by the data available in the Understanding Society survey, meaning that the measures used cannot fully reflect the full range of dimensions that each social exclusion domain encompasses. For example, measures of CP sometimes included information about whether people vote in general elections (e.g. Barnes et al. Reference Barnes, Blom, Cox and Lessof2006; Becker and Boreham Reference Becker and Boreham2009; Ward, Walsh and Scharf Reference Ward, Walsh and Scharf2014). However these data were not available in Waves 1–3 of Understanding Society and therefore political engagement of this type is not included in our measure of CP. It should also be noted that the current measures may fail to capture the actual act of exclusion. As discussed above, social exclusion is not directly measurable but is typically inferred from the occurrence of other phenomena. This reliance on inference and the paucity of available data may reduce the likelihood that the actual act of social exclusion is captured. By using an existing data-set and relying on traditional measures of participation and usage (Ward, Walsh and Scharf Reference Ward, Walsh and Scharf2014), we have not been able to address issues around social exclusion, agency and process which remain under-examined (Atkinson Reference Atkinson, Atkinson and Hills1998; Scharf and Keating Reference Scharf, Keating, Scharf and Keating2012).
Furthermore, the working framework separates out social exclusion domains into determinants, indicators and outcomes to enable hypothesis testing of some of the interrelationships between domains. Whilst necessary for this work, such separation potentially elevates the importance of the determinant domains, whilst overlooking other possible contributing factors and the possible influence of indictor domains on each other. This working framework is not intended to be a full conceptual model of social exclusion in later life, but a means to begin exploring social exclusion in more depth. Some of the interconnected relationships between domains could be used in the development of a more detailed conceptual model.
Finally, the focus of this paper is to highlight the need for this more detailed examination of the inter-relatedness of social exclusion domains, and to outline a working framework from which to begin such investigations. The aim of the descriptive analysis presented here is to assess the suitability of the three indicator domains and the composite score to be a measure of social exclusion, by verifying the risk characteristics identified from these measures against those found in previous studies. Analysis of determinant domains and the interrelationships between domains is beyond the scope of this paper; and whilst this absence is a limitation of the current paper, this analysis will be presented in a number of follow-on papers (Netuveli, personal communication, 2017; Sacker et al. Reference Sacker, Ross, MacLeod, Netuveli and Windle2017).
Using these measures and the new working framework, these papers will begin a more detailed examination of social exclusion in later life, looking at health as both a determinant and an outcome of social exclusion (Sacker et al. Reference Sacker, Ross, MacLeod, Netuveli and Windle2017); and looking at environment and neighbourhood as a determinant of exclusion (Netuveli, personal communication, 2017). These papers will also investigate factors that may mediate the relationships between health or environment and social exclusion, with a view to identifying potential areas for intervention.
Social exclusion continues to be a problem for many older adults and can have severe negative consequences for people's quality of life. In order to reduce its prevalence and impact successfully, we need to have a better understanding of what leads people into or protects them from social exclusion, and what mechanisms are in play that prevent people from moving out of exclusion. The development of a new working framework provides a platform from which to take social exclusion research forward, to move beyond descriptive analyses and tease apart the many pathways, gaining a clearer understanding of the mechanisms involved, which can then inform more targeted and co-ordinated policy initiatives to reduce social exclusion.
Conclusion
Due to the complex nature of social exclusion, it is a process that cannot be measured directly. A number of associated dimensions have been identified, some of which can be used as a proxy measure. In this study we use the domains of SPA, CP and SRR as indicators of social exclusion. However, the match between domain and its measure is imperfect. It is not always possible to realise the ‘ideal’ theoretical model in the measurement models, particularly when restricted by the data available in large surveys. Nevertheless, the secondary analyses of routinely collected longitudinal surveys offers methodological rigour in terms of study design, data collection and diversity-representative population data from broad geographical areas. The Understanding Society survey in particular provides a good data-set with which to explore social exclusion, representing the whole of the UK (England, Northern Ireland, Scotland and Wales), rather than limiting analysis to those in England as in previous studies (Barnes et al. Reference Barnes, Blom, Cox and Lessof2006; Kneale Reference Kneale2012; Scharf, Phillipson and Smith Reference Scharf, Phillipson and Smith2005b).
Descriptive analysis using our social exclusion measure of those aged 65 years and over in Understanding Society indicates that with the exception of gender, our results are consistent with those of previous studies, suggesting our chosen indicators are appropriate measures of social exclusion. Although the data-set used here only covers a UK population and does not include those living in institutions, the working framework can be applied to other populations with the domain measures tailored to each population as appropriate. Whilst social exclusion continues to be a political priority area in the UK and across Europe, it is important that dialogue within these arenas moves beyond that of poverty and economic exclusion, and recognises the importance and impact of other exclusion domains if we are to improve the lives of those in our society.
Acknowledgements
Understanding Society is an initiative by the Economic and Social Research Council (ESRC), with scientific leadership by the Institute for Social and Economic Research, University of Essex, and survey delivery by the National Centre for Social Research and TNS BRMB, and survey management by the UK Data Archive. This research was funded by the ESRC (CM and GW: grant number RES-060-25-0060; AS, AR and GN: grant number ES/J019119/1). The ESRC did not play any role in the design, execution, analysis and interpretation of data, or writing of the study. The Understanding Society study has been approved by the University of Essex Ethics Committee. All authors contributed to the design and analysis of this study, and to the preparation of the manuscript. The authors of this paper certify that they have no conflicts of interest.


 Open access