


NOMENCLATURE
- EAS
-
Equivalent airspeed
- hPa
-
hectoPascals
- R
-
Gas constant
- T
-
Temperature (Kelvin)
- TAS
-
True airspeed
- γ
-
Ratio of specific heats for air
1.0 Introduction
There is considerable developing understanding that climate change and air transport have a two-way relationship. On the one hand, emissions from aircraft and ground infrastructure are contributors to anthropogenic climate change. These emissions may be reduced in future by technological advances and more efficient flight routing strategies [Reference Wells, Williams, Nichols, Kalise and Poll1, 2]. On the other hand, aircraft operate entirely within the troposphere and lower stratosphere, and thus are potentially directly impacted by any changes to those layers of the atmosphere. These changes include the horizontal spatial patterns and vertical distributions of both temperature and pressure (leading also to density changes), wind strength and direction, weather characteristics, turbulence, and humidity. The many different ways in which high-impact weather can impact aviation have recently been described in [Reference Gultepe, Sharman, Williams, Zhou, Ellrod, Minnis and Trier3].
This paper reviews the available research, showing what is presently known about the impacts of climate change on air transport, and aims to identify gaps in the developing knowledge base.
2.0 The characteristics of climate change with potential to impact air transport
2.1 Historical data and the IPCC scenarios
There is a broad scientific consensus that the phenomenon of anthropogenic global warming is very likely driving a global change in climate (climate being weather averaged over a sufficiently long time period, typically several decades) [4, 5]. There is also good data about historical climate change, especially in the satellite era from the late 1970s to the present day. However, the magnitude of future changes is less certain because, irrespective of confidence in climate models, we cannot know the changes in global emissions (and other forcing factors such as land-use change) except in retrospect, and predicting them is largely a problem for social scientists rather than physical climate scientists. To capture these non-scientific uncertainties, the IPCC (Intergovernmental Panel on Climate Change) uses a range of plausible forcing scenarios, representing the broad spectrum of future possibilities from rapid decarbonisation to continued dominance of fossil fuels (referred to as “business-as-usual”) [6].
It is important to emphasise that weather forecasting (which, mathematically speaking, is an initial-condition problem) is limited by chaos theory, but climate prediction (which in contrast is a boundary value problem) is not [Reference Lorenz7, Reference Orrell8]. Thus it is useful to point out here that typical limitations of the validity of weather forecasting to a few weeks, do not apply to climate forecasting: By the same token, the chaotic limits on the predictability of turbulent eddies flowing over the airframe of an aircraft do not prevent successful calculations of the overall lift and drag forces.
2.2 Near-surface temperatures
An important part of climate change is a time-mean increase in tropospheric temperatures. Airports are routinely recording and archiving this information, which is historically available at many airports, usually since a point after 1950 when modern standards of airport observations with retention of records tend to have commenced: for example, at airports in Greece [Reference Gratton, Padhra, Rapsomanikis and Williams9], Slovakia [Reference Némethová, Vuković, Makó, Antoško, Pilát, Šváb, Choma and Harčák10], and more generally in North America [Reference Sheridan and Lee11]. Climate models are readily available to predict future changes, albeit inevitably subject to uncertainty in models and their underlying assumptions (as is the case with all models, including the aerodynamic ones used in aviation). The impacts of climate change and the associated extreme near-surface temperatures on aviation have been analysed by [Reference Coffel and Horton12]; a most recent global consensus summary, including charts of both actual and predicted changes may be found at [4].
2.3 Near-surface winds
Near-surface winds, from the perspective of air transport, are only important in the immediate vicinity of a runway. As demonstrated by [Reference Gratton, Padhra, Rapsomanikis and Williams9], historic near-surface wind measurements can generally be found in local or national archives [Reference Wieringa13]. Because runways have generally been built aligned with historical mean prevailing winds, it is self-evident that changing wind direction, or reducing wind speeds (see figure SPM.9 of [4]), will be adverse from the perspective of both take-off and landing performance.
2.4 The combined effect of near surface temperatures and winds
The most obvious effect is that upon take-off performance, and this has been widely analysed and written upon, e.g. [Reference Gratton, Padhra, Rapsomanikis and Williams9, Reference Zhou, Ren, Liu and Lu14–Reference Zhou, Zhang, Li, Liu and Huang16]. At airports where there is ample runway length available, the main effect is of increased take-off distances; where runways are shorter, then payload becomes limited. This is due to both increasing temperatures and reducing magnitude and shifting wind vectors — however, the majority of published research has only considered temperatures and disregarded winds. There is limited evidence that this has already occurred, and much stronger evidence that it will occur in the future. Reference [Reference Ren, Dickinson, Fu, Bornman, Guo, Yang and Leslie17] conducts a more theoretical but global analysis of the future impact upon payloads, concluding a global mean reduction in payloads of 1%, but local extremes up to 19% over the 75-year period from 2025 to 2100, assuming no mitigating improvements in technology or infrastructure.
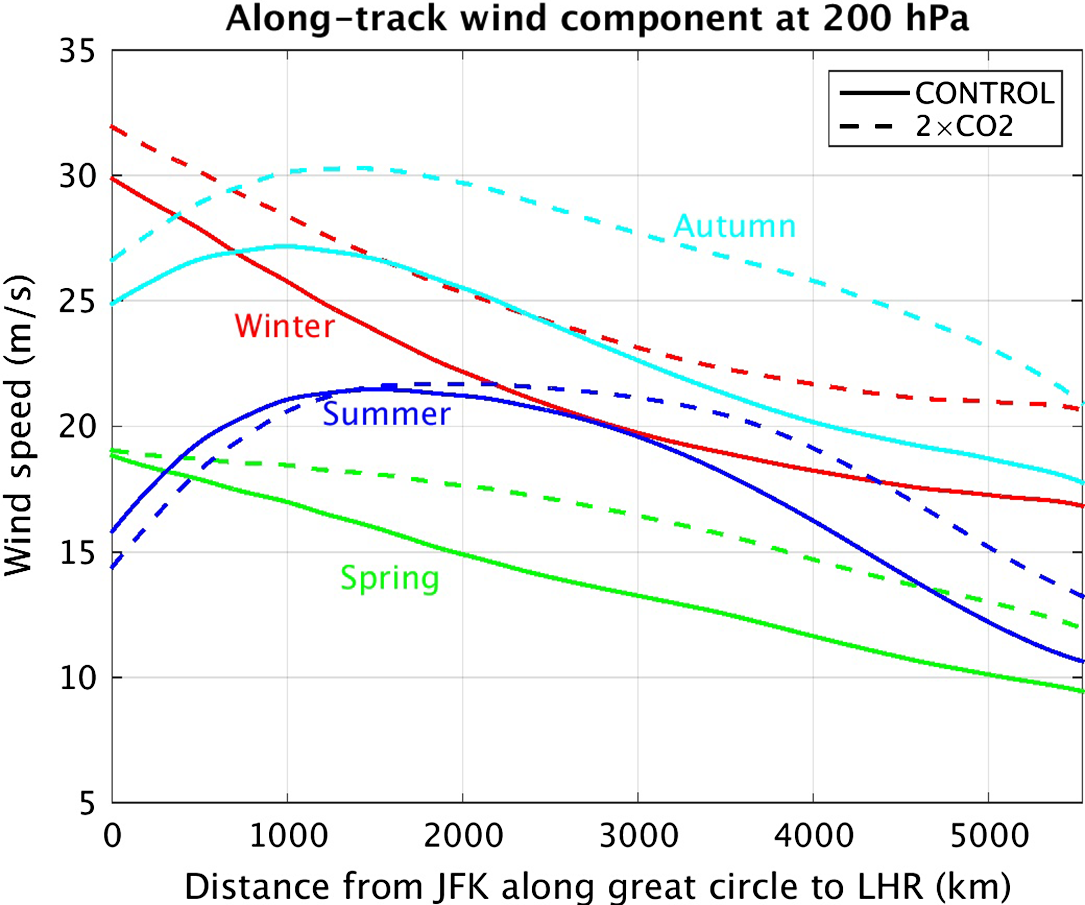
Figure 1. Seasonal-mean tailwind along the great circle route from JFK to LHR at a pressure altitude of 200 hPa (See also Table 1).
Table 1. Track-averaged wind speeds in Fig. 1

2.5 En-route winds
At typical cruising altitudes for large, commercial airliners, long-term trends in wind speeds associated with climate change are the result of competing effects at different altitudes [Reference Simpson18]. Specifically, the Arctic amplification of warming in the lower troposphere (which tends to reduce midlatitude wind speeds) is opposed by the tropical amplification of warming in the upper troposphere (which tends to increase midlatitude wind speeds). Climate models indicate that the latter effect will dominate in the coming decades, leading to stronger jet stream winds [Reference Irvine, Shine and Stringer19]. For example [Reference Williams20, Reference Lee, Williams and Frame21] demonstrated a significant increase in track-averaged tailwinds on eastbound transatlantic flights (and headwinds on westbound transatlantic flights) and proceeded to calculate the consequences of these modified winds for journey times, fuel consumption, and CO2 emissions. Figure 1 and Table 1 show some additional analysis of Williams’ simulations [Reference Lee, Williams and Frame21]. Excepting a slight summer weakening along the westernmost ∼1,200 km from New York (JFK) to London (LHR), the eastbound tailwinds (and westbound headwinds) systematically strengthen in all seasons with increased carbon dioxide (CO2) concentrations, leading to 14.5% stronger winds when averaged over the year. Overall, these effects tend to indicate a mean increase in transatlantic journey times of ∼2% due to mean wind changes alone. These changes are small in the time average, but can be much larger on individual days. The caveats are that this is a single model and that capturing upper-atmospheric wind changes is challenging because they are the small residual of competing effects at different altitudes, meaning that multi-model analyses are preferred [Reference Williams20].
2.6 Behaviour of the jet streams and clear-air turbulence
Jet streams and stationary wave pattern winds at cruising altitudes are changing, particularly with increased carbon dioxide forcing. For example, the subpolar jet stream over the North Atlantic Ocean at flight cruising altitudes has become 15% more sheared since satellites began observing it in the late 1970s [Reference Lee, Williams and Frame21]. Strengthened wind shears consequently increase both the strength and frequency of clear-air turbulence (CAT) [Reference Williams and Joshi22–Reference Storer, Williams and Gill25]. For example, at cruise altitudes within 50–75°N and 10–60°W in winter, most turbulence measures show a 40%–170% increase in the prevalence of moderate-or-greater CAT occurrence [Reference Williams and Joshi22]. Similar conclusions were reached by [Reference Williams23] for light, moderate, and severe turbulence taken separately. A more recent paper [Reference Atrill, Laxmi and Teufel26], continues this narrative with similar conclusions most specifically in the Arctic but also indicates the need to extend this research into the flight safety research domain.
A 2015 paper [Reference Francis and Vavrus27] indicates that southwards movement and increased amplitude of Rossby waves within the north polar jet stream caused by polar warming (termed Arctic Amplification, or AA) will be a particular contributor to an increase in the prevalence of severe weather events in the Northern Hemisphere particularly, and especially in autumn and winter. Their paper provides examples proposing that this has already occurred, although this idea remains controversial and is currently being hotly debated in the scientific literature.
A further 2021 study [Reference Lv, Guo, Li, Han, Xu, Guo, Cao and Gao28] shows similar behaviours in the Eurasian subtropical jet stream.
2.7 Modifications to the characteristics of the lower stratosphere
The tropopause is expanding and lifting due to climate change, whilst the lower stratosphere is cooling and contracting [Reference Goessling and Bathiany29–Reference Letcher31]. This describes mean tropopause altitude lifting of 64 ± 21 m/decade and [Reference Seidel and Randel32] cooling 0.41 ± 0.09 K/decade, the 100–50 hPa layer by 0.77 ± 0.21 K/decade.
2.8 Weather system behaviours: surface impact
For coastal airports, rising sea levels also present a threat [Reference Freedman33]: even temporary closure of any major runway delays traffic internationally – sometimes by an average of 40 minutes. It is estimated that present sea-level rise since 1900 is 0.2 m, which presently presents minimal threat in isolation, but combined with the prediction that under some sea level may rise by 1 to 5 m, depending upon scenario, by 2,150 [4] which may bring it above many low lying runways (e.g. New York JFK at 4 m, Penang International at 3 m, or Rome Leonardo da Vinci Airport at 5 m), with these effects further exacerbated by severe weather events causing coastal storms.
2.9 Climate change impacts on wildlife en-route
Birds, and particularly migrating larger birds, have significant flight safety implications – birdstrikes present a significant hazard [Reference Blackwell, DeVault, Fernández-Juricic and Dolbeer34]. Flight routes and safety advice are based upon known bird behaviours; however, bird migratory patterns are changing – for example in the Pacific due to El Niño modifying foodsource availability [Reference Schreiber and Schreiber35], and southern species have been expanding their territory northwards [Reference Crick36]; spring migrations have been occurring earlier in the year [Reference Huppop and Huppop37]. This remains under study, but climate change is clearly modifying bird population distribution
A non-climate anthropogenic instance showing the potential for problems to occur is in Spain, where measures to ensure sanitary disposal of farm animal carcasses resulted in the movement of vultures towards cities and a resultant increase in birdstrikes [Reference Margalida and Colomer38, Reference Margalida39].
3.0 Projected and known impacts
3.1 En-route flight times
3.1.1 Impact of temperature
Starting from International Standard Atmosphere (ISA) standard 216.65K [Reference Gratton and Gratton40] and:-
 \begin{align} c = \sqrt {\gamma RT}, \end{align}
the speed of sound in the lower stratosphere cLS reduces decadally by 0.53 ± 0.18 m/s or 0.18 ± 0.05 %. Above ∼8 km aeroplanes cruise at fixed Mach numbers. Thus True Airspeeds (TAS) will reduce proportionally: at 6.4 ± 1.7 seconds per hour to cover the same distance, per decade.
Cruising in the lower troposphere, ${\rm{TAS}} = {{EAS} \over {\sqrt \sigma }}$
. At high cruising conditions of 12 km and 240 kts EAS (equivalent airspeed), a decadal decrease of 0.18 ± 0.05% in true airspeed will occur: 2 to 3 minutes increased flight time per 8 h long flight over 30 years, or around a 1% increase. This may be assumed additional and independent of the changes due to mean wind changes, such as are described in 2.4 above, and presumably to anything caused by jet stream encounters as described in 2.5.
${\rm{TAS}} = {{EAS} \over {\sqrt \sigma }}$
. At high cruising conditions of 12 km and 240 kts EAS (equivalent airspeed), a decadal decrease of 0.18 ± 0.05% in true airspeed will occur: 2 to 3 minutes increased flight time per 8 h long flight over 30 years, or around a 1% increase. This may be assumed additional and independent of the changes due to mean wind changes, such as are described in 2.4 above, and presumably to anything caused by jet stream encounters as described in 2.5.
3.2 Impact of en-route weather
Convective storms [Reference Romps, Seeley, Vollaro and Molinari41], within which flight can often be problematic for reasons including turbulence, icing, windshear and lightning, are also predicted to become more common, although lightning incidence itself may decrease [Reference Finney, Doherty, Wild, Stevenson, MacKenzie and Blyth42].
Eurocontrol analysed storm impact in the Maastricht upper area airspace, predicting increases in spring and summer storms through 2050. Flight above these storms, which can extend above 17 km, is impossible: most airliners being limited to 12 km or below. This forces longer routes, steeper climbs and descents, and less efficient airspeeds – all adversely impacting emissions, flight times [Reference Young43] and costs, and forcing more aircraft into some portions of airspace, creating potential safety issues that must be mitigated [44, 45].
Increased incidence of fog or number of severe storm events, or out-of-limit winds will increase flight cancellations. Single or parallel runways (e.g. Heathrow or Schiphol) particularly reduce options; in addition to the small coastal airport concerns identified earlier in this paper, many such airports are thus at risk of climate impact.
Previous significant weather events have typically disrupted air transport across Europe and into major airports over one day. Dates anecdotally identified include February 14th 2014 and May 28th 2016, and some others have been reported by individual airports or air traffic service providers, but presently there is no central record of these events that would permit extensive analysis. Indications are that this problem is escalating due to both increasing prevalence of storm events and increasing air traffic density.
3.3 Operability of airports and associated infrastructure
The country that has most closely scrutinised the impact of climate change on national infrastructure is probably the United Kingdom, which under the 2008 Climate Change Act [47] required providers of major national infrastructure to report periodically upon their identified susceptibility to climate change and the mitigation measures being taken. Initial reporting was in 2011 [47, Reference Jude, Drew, Pollard, Rocks, Jenkinson and Lamb48], then again in 2016. The 2016 reporting for major airports were for Birmingham Airport [49], London Gatwick Airport [50], Glasgow Airport [51], London Heathrow Airport [52], Manchester and East Midlands Airports [53] and London Stansted Airport [54]. Additionally, there is a report for the National Aviation Authority [55]. Whilst UK National Air Traffic Services reported in 2011 [56], they elected not to report in 2016. Three further airports, Cardiff, Edinburgh and London Luton Airport, also produced reports in 2011, but elected not to in 2016. Table 2 summarises the most recent available reports.
Table 2. Simplified summary of UK aviation infrastructure provider most recent available climate impact reports: risks scored 4/5 or 5/5 likelihood where quantified, otherwise based upon narrative

Whilst the airports considered genuine safety and public risk through much of their reports, in 2011 CAA and NATS only considered organisation-continuity and financial risk to themselves, and not any risks to safety or national infrastructure availability. Citing relatively recent regulatory changes [57] as enabling this, the CAA however whilst continuing to consider itself only as essentially an office based organisation relatively unaffected by climate change, has started to actively consider its role in ensuring climate change resilience in the organisations that it regulates, explicitly stating: “There have been a number of instances of disruption at airports in recent years, caused by severe weather and therefore by aiding airports in becoming more operationally resilient we are helping to assure they are able to adapt to the effects of climate change.” They also state that they are applying a resilience condition to the future (from 2016) licence to operate of NATS – this appears largely to have been addressed [58]. It also refers to the proposed London Heathrow third runway as part of the building of climate resilience. This is reflected in the statement that “Airports that already operate close to capacity are more vulnerable to severe weather events, as the recovery time that is available following disruption to operations is very small. High-density airports are often unable to absorb delays to flights: even transferring these to the next day is difficult, resulting in several cancelled flights, as the airport does not have the capacity to reduce accumulated queues during regular operations”. Overall then, from 2011 to 2016 CAA became much more responsive to, and concerned about, the impact of climate change on air transport operations, including publication of advice about the management of all disruptions [59], and this is presumed to remain the case, although there is no public evidence of the actual impact of this change upon NATS.
A related topic that is likely to expand as the world emergences from the Covid-19 pandemic is that of recovery of the airline industry. A 2021 reference [Reference Lee, Marla and Vaishnav60] explores the recovery of the airline industry from any disruption (not specifically citing the pandemic), and the impact of climate change upon that. They conclude that daily total airline recovery costs increase on average by 15.7% to 49.4%; and by 10.6% to 165.0%, depending upon the nature and year of disruption and climate change characteristics in that locality.
3.4 Probabilities and severity of collisions with wildlife
Climate change (and likely other anthropogenic issues) modify bird population distributions, adversely impacting upon aviation safety. A 2011 reference [Reference Dolbeer61] shows that globally birdstrike incidences near airports have been increasing. Any change will initially be adverse, since existing birdstrike avoidance measures will be undermined by changes in bird behaviour until those are understood and compensated for.
3.5 The ICAO survey, 2019
The International Civil Aviation Organisation in 2019 surveyed its 193 member states, seeking understanding of their understanding and associated plans with regard to climate change adaptation [Reference Burbidge, Freeburg, Scavuzzi, Lacoin and Ozeren62]. Sixty-five percent of responding states considered that climate change had already impacted upon air transport in their states, and a further 15% expected to see impact by 2030. The report detailed eight areas of impact:
-
[i] Sea level rise
-
[ii] Increased intensity of storms
-
[iii] Temperature changes
-
[iv] Changing precipitation
-
[v] Changing icing conditions
-
[vi] Changing wind directions
-
[vii] Desertification
-
[viii] Changes to biodiversity.
Thirty percent of corresponding nations already had implemented some climate change adaptation measures, another 25% were planning to do so within ten years, and only 6% of states had no such plans. There is a general accord amongst respondents and expert authors that present adaptations are inadequate. Based upon responses, ICAO created a risk map, reproduced in Fig. 2.

Figure 2. ICAO 2019 International Climate Change Risk Map.
ICAO’s stated position is that each state should be conducting its own climate change risk assessments before creating adaptation plans, and it does not appear to be mandating any actions at this time. The result is inevitably a lack of international consistency of action.
3.6 The Eurocontrol survey, 2018
In 2011 Eurocontrol, the major en-route air navigation service provider in Europe [44], this showed 34 major airports vulnerable to sea-level rise, without considering also pollution containment, with further concerns due to shifts in en-route weather behaviours. Subsequently, in 2018 [Reference Young43], the organisation surveyed its contributing states, with correspondents reporting five major risk factors:
-
i. Higher-average and extreme temperatures
-
ii. Changing precipitation patterns
-
iii. Changes to storm patterns
-
iv. Sea-level rise and storm surges
-
v. Changing wind patterns
Eighty-six percent of correspondents indicated a belief that climate change adaptation would be essential for the aircraft industry, whilst 53% have commenced planning themselves. In terms of the specific organisations, 57% expected to be impacted by 2050, 10% explicitly did not, whilst 33% had no official position. Forty-eight percent considered themselves already impacted.
The report summarises the following predicted impacts upon the industry from the above effects, noting that climate change will not be even across the wide geographic area represented by Eurocontrol’s stakeholders: warming being likely greatest in winter in the northeast of Europe, and greatest in summer in the south:
-
i. Aircraft performance changes
-
ii. Runway length issues
-
iii. Yield and range issues
-
iv. Demand redistribution (geographical)
-
v. Demand redistribution (seasonal)
-
vi. Increased cooling and heating requirements
-
vii. Heat damage to airport surfaces (runways and taxiways)
-
viii. Structural issues due to changes to permafrost
This report also explicitly raises major stakeholder concerns about changing precipitation (both rain and snow) across Europe, showing model outputs that predict the greatest increases in the northeast, and greatest reductions in the south. Where it is increased, the report predicts disrupted movements, flooding, reduced airport throughput, increased requirements for snow clearance and de-icing, impairment of underground infrastructure, and impaired ground transportation.
Eurocontrol also explicitly state their concerns about increasing prevalence of stormcells, embracing the uncertainty about this in the future but acknowledging that an increase in frequency and severity is likely. It anticipates this to lead to route disruption and capacity loss, difficulties in predicting 4D trajectory requirements, hub operation disruption, infrastructure damage, and increases in the likelihood of lightning strikes. It acknowledges the need for high-quality meteorological observations and forecastin.,
Eurocontrol’s concerns about rising sea levels are detailed, but appear only to be shared by a minority of their stakeholders. Changing wind patterns are considered more important, including clear air turbulence, increased sector times, routing modifications, concerns about an increasing need for crosswind operations – and a potential associated loss of capacity at airports where no crosswind runway exists. They do not appear to explore loss of aircraft performance or impact upon take-off distances or noise footprints.
4.0 Summarising what is known
There is clear evidence and understanding that climate change has impacted air transport already, and that this will accelerate [Reference Ryley, Baumeister and Coulter63].
Climate change near surface, particularly in the form of changing wind direction, reducing wind strength, and increasing temperatures is creating an impact upon aeroplane take-off performance: increasing take-off distances where there is a surplus of runway length, and decreasing available payload where there is not. Whilst no paper has investigated the corresponding landing distances, since aircraft performance calculations are very similarly effected by those factors, similar impacts may also be assumed.
It has been established that the northern hemisphere sub-polar jet stream and the Eurasian subtropical jet stream (and it may be assumed other jet streams) have shown increased shear, greater magnitude of oscillations, and have tended to shift in latitude, and this will increase in future. The impact will be increased clear-air turbulence in the atmosphere, and the potential for more encounters unless mitigating action is taken.
5.0 Gaps in the knowledge base
Whilst there is evidence that wildlife, particularly bird, populations are redistributing due to climate change (and likely other anthropogenic effects), there is very limited global understanding of this and its potential to impact aviation safety. Except in a small number of discrete locations, it has not been researched.
Multiple documents, particularly official reports, reviewed in preparing this paper have identified the importance to aviation organisations of risk assessing their operation in respect of future climate change, and from that identifying necessary preparations and mitigations. However, there is not an identified set of best practices in this regard. The most mature processes appear to be adaptation of classical Safety Management System (SMS)/Risk Assessment approaches, and this was particularly well described in reports responding to the UK’s 2008 Climate Change Act. However, a proposed and tested set of best practices does not exist.
The authors have conducted some initial analysis themselves suggesting an increased problem, but as yet have found no published evidence of consideration of increased noise footprints caused by operations at elevated temperatures.
Most reports and papers in this space have qualified the impact of climate change, but relatively few have quantified them in terms of direct impact upon air transport operations. Such quantification is probably important to enable industry planning and assessment of economic impacts.
Whilst there is strong evidence of increasing clear air turbulence severity and contact incidence in the vicinity of the north polar jet stream, and to a lesser extent in the vicinity of other jet streams, there appears presently to be no published analysis of the safety or other operational implications of those encounters.
6.0 In conclusion
It has been demonstrated by many sources that climate change either has already, or will in the future impact upon aviation. These impacts include that:
-
i. Where adequate runway length is available, take-off distances are increasing, and where runways are shorter, available payloads are decreasing. This is primarily due to temperature effects, partly due to wind effects.
-
ii. Bird populations are shifting, in some cases causing increased birdstrike risks, and thus increased safety hazards.
-
iii. Extreme precipitation events are increasing, potentially creating flood management and pollution containment problems at airports.
-
iv. Increased periods of inaccessibility to aircraft of airports or portions of airspace, thus creating air traffic delays and potential safety hazards.
-
v. Wind and temperature effects are increasing en-route flight times.
-
vi. Clear-air turbulence is increasing, driven by stronger wind shear in and around the jet streams.
Some of this is increasingly well understood, but some topics remain poorly understood, including wildlife behaviours, changes to noise footprints and the actual safety implications of turbulence changes.
Acknowledgments
The authors acknowledge their employing institutions, the UK National Centre for Atmospheric Science, and the Hellenic National Meteorology Service, all of whose support has aided this work.


 Open access