


The case studies presented in this chapter provide evidence of varied experience with private health insurance in three middle-income country settings – Brazil, Egypt and India – where there are large and persisting socioeconomic differentials and where private spending accounts for more than half of health care financing. Brazil is a very large private health insurance market with a recently introduced system of regulation whereas Egypt and India are very small markets with minimal regulation. In all three countries private health insurance plays a supplementary role and overwhelmingly covers richer people employed in the formal sector. All three countries are struggling with regulation of the market to enhance transparency, protect consumers and minimize negative effects on the publicly financed part of the health system.
This chapter presents an overview of the three markets and their development, including the existing regulatory frameworks. It also attempts to provide some evidence on how private health insurance contributes to meeting health financing policy goals in these countries and its future viability.
BrazilFootnote 2
maria dolores montoya diaz and flavia mori sarti
The current configuration of the Brazilian health system is the result of extensive social policies implemented during the 1980s and 1990s, determining a predominant role of the public sector in health coverage and a supplementary role for the private health sector. The public sector within the Brazilian health system, known as the Unified Health System (Sistema Unico de Saude, SUS), provides health care for approximately 75% of the Brazilian population and maintains a structure of health assistance mainly based on public organizations under direct public management. Promotion of equity through provision of universal, comprehensive health care cover is a major concern in Brazil. Yet, there are major challenges regarding financing, management and infrastructure of the Brazilian health system, generating substantial gaps between supply and demand in public and private health care. Supplementary private health insurance and out-of-pocket payments provide alternative means of financing access to health care for some population groups, mainly in private hospitals and through private diagnostic and therapeutic support services (Reference SantosSantos et al., 2008). Tax incentives are available for those who purchase private health insurance, and studies have found that these have expanded both the private health insurance market and the supply of private hospitals (Reference Ocké-ReisOcké-Reis, 1995). Health care providers play a significant role in the provision of private health insurance through Group Medicine and Dentistry schemes and Medical and Dental Co-operatives.
Brazil’s private health insurance market is one of the largest internationally, accounting for over a quarter of all spending on health and covering a quarter of the population – mainly richer and better educated households living in urban areas in the south-east who are covered by group plans. In September 2015, the private health insurance market reached a new high of 71.4 million beneficiaries (see Fig. 3.1), dropping to 70.5 million in September 2016 due to the economic crisis. In terms of per person spending on private health insurance, at 373 in current purchasing power parity in 2015, Brazil is more similar to countries such as Australia and Ireland than to countries with a similar level of gross domestic product, such as Mexico (WHO, 2018).
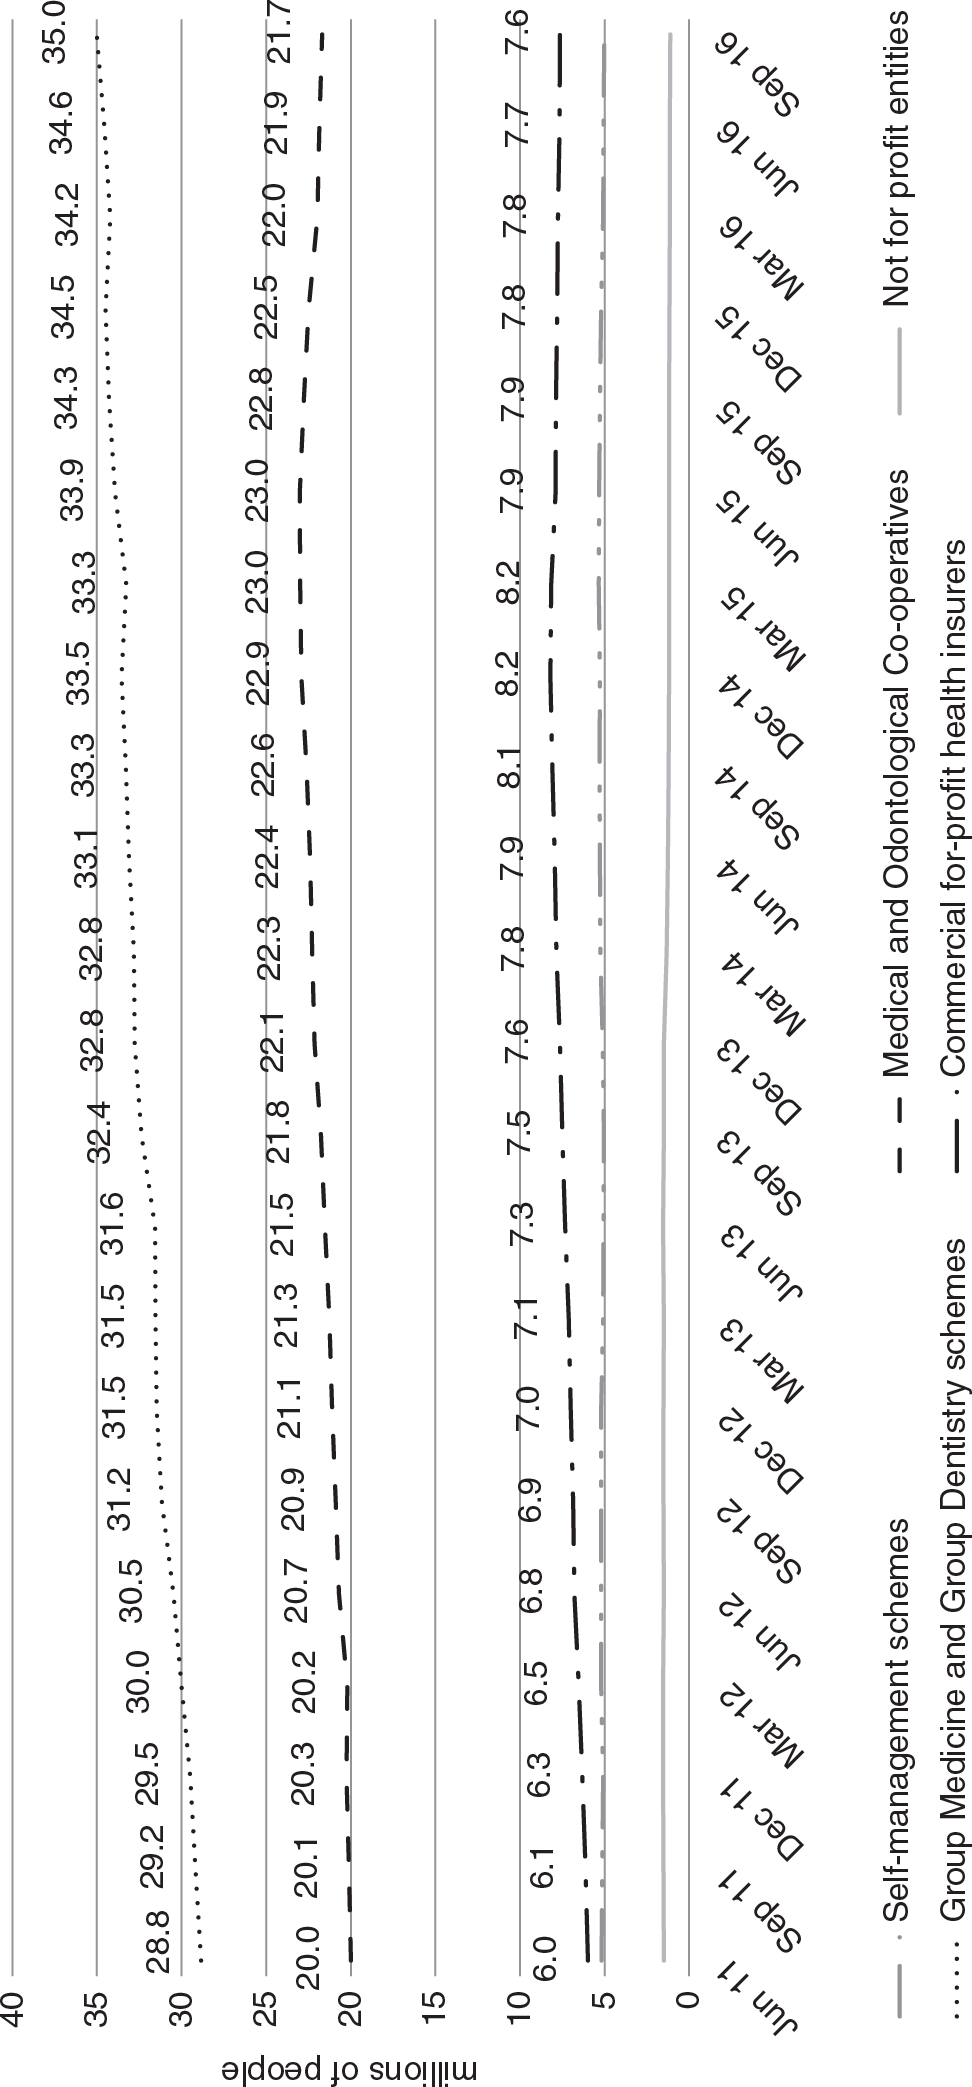
Figure 3.1 Number of beneficiaries of private health insurance plans in Brazil by type of insurance provider, 2011–2016
Before 2000 the market was largely unregulated, which allowed distortion and abuse (Reference PrekerPreker et al., 2010). Since then, a regulatory framework has been progressively implemented, attempting to correct market failures, protect consumers and ensure financial solvency of organizations offering health plans. A new authority, the National Supplementary Health Agency (Agência Nacional de Saúde Suplementar, ANS), was created to oversee this market. In addition, private health insurers were required to reimburse the SUS for care delivered by SUS providers to patients with private health insurance plans.
Market origins
According to ANSFootnote 3, a milestone in the history of social security and health plans in Brazil was the establishment in 1923 “(…) for each of the existing railway companies in the country, a Pension Fund for its respective employees.” These funds, based on the Eloy Chaves Law, were managed and financed by the employers and employees and were meant to provide comprehensive health assistance for workers and their dependants. Although this is not commonly seen as the origin of the private health insurance market in Brazil, similarities between these funds and the current operators of health insurance self-management schemes are apparent. In fact, the general welfare fund for the employees of the Bank of Brazil (CASSI) established in 1994 is the oldest health plan in Brazil that is still in operation.
The arrival of major foreign companies in the 1960s, particularly in the automobile industry, generated the need to provide medical insurance cover for industrial and private sector workers. In 1966 health insurance was established in the law, but private health insurers were not allowed to operate until 1976. During this period, compulsory health insurance was provided through a system of social insurance that was financed from taxes levied on wages and that progressively spread among workers in different sectors of the economy. Provision of certain health care services in this system was assured through government contracts with both public and private providers. Political changes that occurred in Brazil during the 1980s promoted the establishment of publicly funded health assistance through the Brazilian Unified Health System (SUS), based on universal population coverage. Nevertheless, dissatisfaction with the SUS pushed middle- and high-income individuals to seek care in the private sector. This, together with private health sector regulation and economic growth, led to a growing demand for private health insurance, which developed rapidly over the 1990s (Reference FernandesFernandes et al., 2007).
Market overview and development
The main types of entities offering private health insurance are Group Medicine and Group Dentistry and Medical and Dental Co-operatives. According to Decree 3,232/86 of the Ministry of Labour, Group Medicine and Group Dentistry are for-profit private entities that provide hospital and dental services through their own facilities or through a network of accredited providers. In mid-2016, 35 million people were covered by Group Medicine or Group Dentistry schemes, which is equivalent to 49% of those with private health insurance (Fig. 3.1). The Medical and Dental Co-operatives are non-profit organizations that operate under the Law of Co-operatives (Law 5,764/71). They account for 31% of private health insurance beneficiaries. Together, Group Medicine and Group Dentistry and Medical and Dental Co-operatives cover 80% of private health insurance beneficiaries, pointing to a strong role of health care providers (health professionals and facilities) in the private health insurance market. The remainder of private health insurance beneficiaries purchase cover from commercial for-profit insurers specialized in health (11%); self-management schemes that are used by major companies and are similar to employer-based insurance in the US contextFootnote 4 (7%); and not-for-profit entities certified by the National Council for Social Care (Conselho Nacional de Assistencia Social) as philanthropic organizations of public interest (2%). Commercial for-profit health insurance plans and Group Medicine and Group Dentistry schemes have been the most dynamic arrangements recently in terms of the number of beneficiaries, growing by, respectively, 27% and 21% between 2011 and 2016 (Fig. 3.1).
The majority of private health insurance providers (69% of the total number) are very small, with 7000 beneficiaries on average. Jointly, they cover only 8.4% of the total number of private health insurance beneficiaries. The largest 18 insurers (1.5% of the total number) have more than 700 000 beneficiaries, on average, and cover 43.4% of the total number of private health insurance beneficiaries (ANS, 2016).
Table 3.1 shows that private health insurance is a profitable business in Brazil. Between 2009 and 2016 claims ratios and monthly revenues increased for all sizes of medical and hospital private health insurance providers, with the average monthly revenues increasing by as much as 71%Footnote 5 for small operators. Small operators achieved higher average monthly revenues than both medium and large operators. Reference BaldassareBaldassare (2014) explains this trend by the fact that small operators tend to serve beneficiaries in small towns and provide health services of lower complexity. The study analysed data from 2001 to 2012 and concluded that “small operators (up to 20 thousand beneficiaries) presented better results in all measures, with higher rates of profitability, liquidity and lower loss ratio” (p.64). Small operators are also subject to normative resolution RN 274 issued by the ANS in 2011, which established differentiated treatment for small and medium-sized operators and aimed to reduce administrative expenses of such operators.
Table 3.1 Private health insurance claims ratios and average monthly revenues in Brazil according to insurer size, 2009 and 2016
| Operator size | 2009 | 2016 | ||
|---|---|---|---|---|
| Claims ratio (%) | Average monthly revenue (in real US$c) | Claims ratio (%) | Average monthly revenue (in real US$c) | |
| Total | 82.3% | 45.39 | 84.9% | 57.40 |
| Medical and hospital private health insurance operatorsa | 83.0% | 54.17 | 85.6% | 72.36 |
| Small | 80.5% | 45.28 | 84.7% | 77.39 |
| Medium | 84.0% | 48.96 | 86.1% | 63.77 |
| Large | 83.0% | 57.49 | 85.5% | 74.42 |
| Dental private health insurance operatorsb | 48.5% | 5.16 | 48.5% | 4.99 |
| Small | 51.0% | 6.10 | 47.9% | 5.99 |
| Medium | 54.8% | 6.06 | 57.0% | 5.23 |
| Large | 45.4% | 4.69 | 46.7% | 4.83 |
Notes: small: up to 20 000 beneficiaries; medium: 20 000–100 000 beneficiaries; large: over 100 000 beneficiaries. The shares of small, medium and large operators in the total number of medical and hospital private health insurance operators and in the total number of dental private health insurance operators are unknown.
a Group Medicine, Medical Co-operatives, commercial for-profit insurers specialized in health, self-management schemes and philanthropic schemes.
b Group Dentistry or Dental Co-operatives.
c As of June 2016. Hence, the 2009 data were corrected for 2016 prices and, subsequently, all R$ values were converted into US dollars at the average exchange rate for the month of June 2016, 1 US$ = R$3.42.
Private health insurance is generally voluntary and contracts can be taken out on an individual, family or group (collective) basis. The latter may be “sponsored”, with premiums at least partially paid by a third party, usually an employer, or “nonsponsored”, with premiums wholly paid by the beneficiaries and with “membership” defined by affiliation with a council, union or professional association that contracts with the insurer on behalf of its members. A third-party administrator (TPA) is usually used to represent the beneficiaries in periodic negotiations of insurance premiums with the insurer and for administering claims. The insurer is responsible for guaranteeing provision of health care benefits. Both insurers and TPAs are required to register with the ANS. Between 2009 and 2016, the number of beneficiaries of group contracts increased by 28.6%, reflecting a long-term trend. In 2016, approximately 80% of private health insurance beneficiaries had collective private health insurance cover (Fig. 3.2).

Public policy towards private health insurance
The current regulatory framework for private health insurance is set out in two laws; one from 1998, which defined the market; and another from 2000, which established the ANS and defined its competencies. The 1998 legislation (Law 9,656) was the first comprehensive effort at regulating the private health insurance sector. It attempted to correct market failures such as information asymmetry, risk selection and abusive benefits exclusions; to protect consumers; and to ensure financial solvency of organizations offering health plans (Reference PrekerPreker et al., 2010). It also required health plans to reimburse the SUS for care delivered by SUS providers to patients with private health plans (this was implemented after the ANS was established in 2000). Contracts that were issued before 1999 (so called “old” contracts) cover 10.5% of private health insurance beneficiaries (ANS, 2016). They are not convertible into “new” contracts and are not subject to the new legislation: what was settled by the original contract prevails. The rights and obligations established by the Law 9,656 apply to all contracts issued after 1999 (“new”) and to the plans that were issued before 1999 but were adapted to the norms of this Law (“adapted”).
The ANS is linked to the Ministry of Health but has administrative and financial autonomy. Its main tasks are to issue licenses to insurers operating in the market; set conditions for market entry, operation and exit; and, if necessary, demand fiscal and/or technical recovery plans from insurers, closure of plans and in some cases liquidation of the insurer. Although these regulations are intended to ensure financial stability, they are also alleged to serve as barriers to entry (Reference Macera and SaintiveMacera & Saintive, 2004). The ANS does not specifically aim to attract foreign investment in the sector and private health insurers must be incorporated in Brazil to obtain a license.
The new regulatory framework established three possible types of contracts: (i) a reference plan has to be offered as an option by all private health insurers (to reduce information asymmetry); it offers outpatient and hospital care and obstetrics; it cannot exclude pre-existing conditions; but it may impose co-payments; (ii) segmented plans cover either outpatient care, or inpatient care, or dental care; and (iii) amplified plans cover additional services compared to the reference plan.
Under the new rules, insurers must renew contracts or provide an equivalent substitute; cannot reject applications based on age or health status; and cannot increase the premiums of individuals aged over 60 who have had the same contract for more than 10 years (for contracts issued before 2003) or exclude pre-existing conditions for individual, family or nonsponsored group contracts with fewer than 50 members. Since 2004, individuals over 59 years have been included in the last age band for health insurance premiums increasesFootnote 6 (there are 10 specific age bands allowed for premium rates). Financial incentives are provided to insurers who offer health promotion and prevention. With the exception of individual contracts for people aged less than 60 years old, premiums must be community rated. However, operators can segment consumers into different risk groups through the content of the products on offer. The ANS reviews premiums for new individual and family contracts and self-insurance schemes but does not control premiums for group contracts on the grounds that groups have sufficient bargaining power, although consumer groups claim that this is not the case (IDEC and CREMESP, 2007).
The new regulatory framework indirectly covers health service providers by requiring contracts between them and the insurers. The ANS authorizes providers that may be contracted and has established an ombudsman to monitor consumer claims. These steps are considered to have improved oversight, but there is still a long way to go. In general, there is little information on the insurers and providers and the relationship between them, although there have been initiatives to improve it, such as the Information Exchange in Supplementary Health (Troca de Informacoes em Saude Suplementar) set up in 2006 or a web-based tool named Performance Index of Supplementary Health (Indice de Desempenho da Saude Suplementar) set up by the ANS in 2004 to enable evaluation of insurer quality. Private health insurers also have to follow protocols of the Private Insurance Superintendence (Superintendencia de Seguros Privados), which establishes financial regulations for the private health insurance market in Brazil.
Assessment of market impact on health system goals
Equitable access to health care and financial protection
The private health insurance market in Brazil is unusual, even compared with OECD countries, because it accounts for a relatively high share of private spending. In 2015, this share stood at around 47% of private spending on health, compared with about 35% in 2000 (WHO, 2018). This suggests that private health insurance may have contributed to lowering out-of-pocket payments: the share of out-of-pocket payments decreased from 36% to 28% of total spending on health over the same period (WHO, 2018). However, any reduction in out-of-pocket payments is likely to have been concentrated among the richer households who can afford to purchase private health insurance cover, and this in turn has probably exacerbated inequalities in access to health care and to financial protection against impoverishing health spending. Some analysts have argued that the government has allowed population preferences and financial resources to determine access to health care (rather than need), which has also fuelled an expansion in private health care provision (Reference FernandesFernandes et al., 2007). Regulations enhancing access to private health insurance policies and the requirement on all private health insurance operators to offer a low-cost basic health plan (that is, reference plan) have contributed to this trend.
Access to private health insurance is highly uneven, with less than 6% of the individuals in the poorest income quintile having private health insurance cover in 2013 compared to around 65% of individuals in the richest quintile (Table 3.2). The share of individuals with private health insurance cover increased across all income quintiles between 1998 and 2008, probably as a result of growing incomes and the increasing formalization in the labour market.
Table 3.2 Private health insurance coverage among Brazilian population by income quintile, 1998–2013
| Quintile of per person income | 1998 | 2003 | 2008 | 2013 |
|---|---|---|---|---|
| Q1 (poorest) | 2.7% | 2.8% | 3.5% | 5.5% |
| Q2 | 7.4% | 7.5% | 10.1% | 12.2% |
| Q3 | 16.4% | 16.0% | 18.4% | 21.5% |
| Q4 | 31.9% | 31.7% | 32.7% | 36.2% |
| Q5 (richest) | 63.0% | 63.5% | 62.7% | 64.7% |
| Total | 24.2% | 24.2% | 25.4% | 27.9% |
There are also large geographical differences in private health insurance coverage (Fig. 3.3). At the end of 2016, the share of population covered ranged from 6% in Acre (AC) in the north region to 43% in the State of São Paulo (SP) in the south-east region.
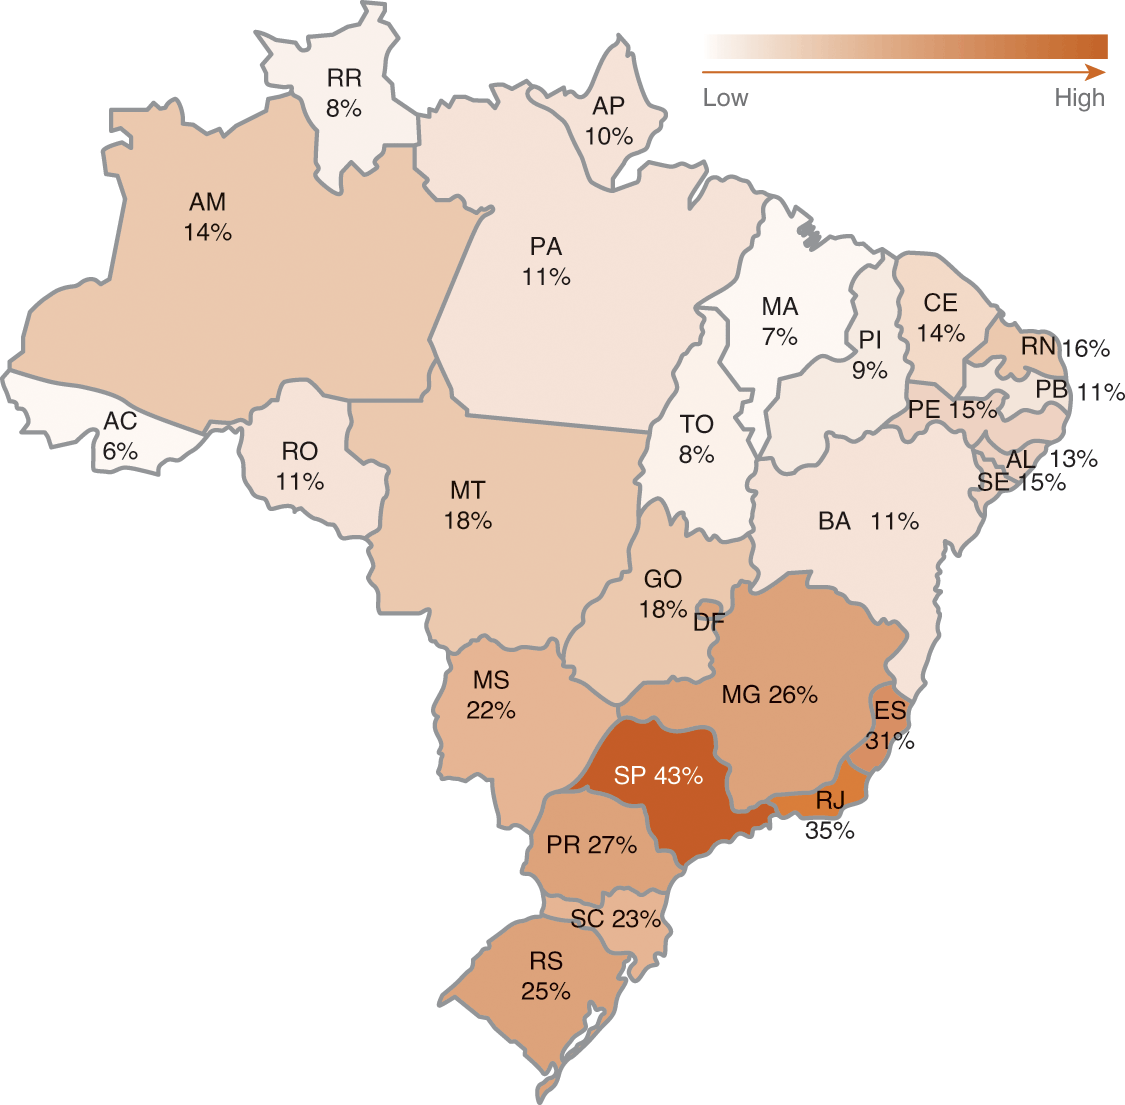
Figure 3.3 Private health insurance coverage rates in Brazil, by state (% of population), September 2016
Although private health insurance cover increased considerably in the north between 2000 and 2016, only 11% of people living in this region had private health insurance cover in 2016, compared with 36.5% in the south-east (Table 3.3). Coverage rates have been found to be related to the regional Human Development Index: the lower the Human Development Index, the lower the level of private health insurance coverage (Reference FernandesFernandes et al., 2007).
Table 3.3 Regional private health insurance coverage rates in Brazil (% of regional population), 2000–2016 (selected years)
| Yeara | North | Northeast | Southeast | South | Middle-West | Total |
|---|---|---|---|---|---|---|
| 2000 | 4.8 | 8.3 | 30.1 | 13.9 | 11.9 | 18.4 |
| 2005 | 6.6 | 8.0 | 30.1 | 17.0 | 13.3 | 19.0 |
| 2010 | 9.5 | 10.5 | 36.0 | 23.4 | 15.5 | 23.4 |
| 2015 | 11.5 | 12.5 | 37.9 | 25.7 | 21.9 | 25.7 |
| 2016 | 10.7 | 12.4 | 36.5 | 25.1 | 21.5 | 24.9 |
Note:
a Measured in September of each year.
A 1998 national survey performed by the Brazilian Institute of Public Opinion and Statistics showed that 44% of the population used both the SUS and the private system, while 16% did not use SUS services at all (Reference MediciMedici, 2004). Even among people with only elementary schooling or less (7% of the population), 12% did not use the SUS, probably because of limited geographical access to public services, while 48% of those who had completed college never used it, perhaps because they rely on private health insurance instead (Reference MediciMedici, 2004).
Private health insurance take-up does not directly affect the funding of the public system. However, the picture is complicated. First, tax relief on private health insurance premiums constitutes an indirect form of public subsidy. According to Reference Ocké-Reis and GamaOcké-Reis & Gama (2016), in 2013 tax relief accounted for 30.5% of annual health spending of the federal government, with this proportion remaining relatively stable since 2003. “Considering the financing needs of the SUS, this fact deserves to be highlighted, since (…) in 11 years, at average prices of 2013, the government subsidized the sector by approximately R$230 billion. In the last year (2013), subsidies reached R$25.4 billion” (p.22).
Second, a significant number of people with private health insurance cover continue to use publicly financed health services (ANS map, 2017). Law 9,656 states that private health insurers should compensate the SUS for the use of public services if these were delivered to private health plan patients. These provisions have been progressively implemented by the ANS. Between 2000 and 2017, the ANS demanded around R$6.6 billion in compensation. About R$1.6 billion of this amount (24.2%) has been collected and remitted to the National Health FundFootnote 7. This corresponds to 43% of the total value of publicly reimbursable careFootnote 8 and to less than 2% of the annual health spending of the federal government. A further R$2.1 billion (32.1% of total ANS claims) is being pursued through the judicial system (ANS, 2017b: p.33).
Incentives for efficiency and quality in service organization and delivery
Analysis has found that most operators did not operate efficiently at the beginning of the 2000s, perhaps because of insufficient regulation and lack of expertise in financial management (Reference FernandesFernandes et al., 2007). Reference LealLeal (2014) states that one of the results of the new regulations was “the adoption of strategies for reducing the risk of client portfolios by the operators, through [strategies for] higher growth in [health care] segments [that were] less intensively regulated such as dental plans and collective medical plans. In this context, there has been an increase in financial incomes and stability (in real terms) of monthly premium revenues (of private health insurance operators), though in the case of individual medical plans subject to specific regulation of the ANS premium increases were higher than inflation. Regarding the use of resources, there has been an increase in accident rate and an increase of efficiency of the market by way of selling and administrative expenses could not be unequivocally demonstrated. Furthermore, analysis of the median operator in a sample of operators showed increased profitability, mainly due to the increase in number of contracts, as the increase in the profit margin was small.” (p.11). There are no data or studies on quality of health care service organization and delivery in Brazil.
Egypt
wael fayek saleh
Health financing in Egypt is highly fragmented. Several financing agencies cover different population groups, with no risk pooling or equalization between them. The whole population is entitled to services offered by the Ministry of Health and around half of the population is covered by a publicly financed scheme for formal sector public and private employees, their dependants and retired people. This scheme is operated by the Health Insurance Organization (HIO). Public spending on health is low, accounting for 30.2% of current spending on health in 2015 (WHO, 2018). Private spending is largely financed through out-of-pocket payments.
Private health insurance plays a mainly supplementary role, financing access to care in the private sector. It also provides substitutive cover for formal sector workers who have chosen to opt out of the HIO coverage. Private health insurance covers around 5% of the population (Reference Nassar, El-Saharty, Preker, Zweifel and SchellekensNassar & El-Saharty, 2010). However, as many policy-holders are not registered with any regulatory body, their actual number may be higher than what is officially reported.Footnote 9 The actual share of private health insurance in total spending on health and in private spending on health, officially estimated at, respectively, 1% and 2%, is also likely to be higher – at least triple these numbers according to some sources. Most of those with “registered” private health insurance cover obtain it through closed-membership schemes organized by trade unions (syndicates) on a non-profit basis. The remainder are mainly wealthier employees of large state-owned or private entities and corporations.
Market origins
The insurance industry was established in the second half of the 19th century by foreign firms insuring cotton production and export. In 1939, the first laws governing the industry were enacted and by the 1950s there were more than 200 private insurance companies in Egypt. In 1961 the industry was consolidated into three state-owned insurance companies and one state-owned reinsurance company (Reference Nassar and El-SahartyNassar & El-Saharty, 2006). The monopoly of the nationalized companies was relaxed in the late 1970s, leading to the establishment of three bank-owned insurance companies. Further reforms introduced in the 1980s and 1990s encouraged private and international players to enter the market (Insurance Federation of Egypt, 2006).
In 1988 the Medical Union became the first professional organization to establish a health insurance scheme for its members. The following year the Middle East Medicare Plan (commonly known as Medicare) became the first managed care organization. The first commercial health insurers were established in the late 1990s and in 2000 the relaxation of foreign ownership rules allowed several multinational insurance firms to set up local non-life operations.Footnote 10 The Egyptian Bankers Takaful Insurance Company introduced Islamic insurance operations in 2007 (AXCO, 2007).
Very high out-of-pocket spending on health, rising income levels and reforms in the insurance industry have created a potential market for private health insurance. Alongside this, growing demand for private health care has been driven by the perceived lower quality and responsiveness of public sector provision (Reference RafehRafeh, 1997; Reference Rannan-EliyaRannan-Eliya et al., 1998; Reference GerickeGericke, 2004; Partners for Health Reformplus, 2004).
Private health insurance premiums increased steadily between 2002 and 2007 from LE (Egyptian Pound) 38.4Footnote 11 in 2002 to LE241.3 million in 2007 (EISA, 2007). By 2016, private health insurance premiums in Egypt rose to LE1.1 billion (US$60.3 million) (Middle East Insurance Review, 2017). However, the contribution of private health insurance to current spending on health continues to be marginal (Reference El-Saharty and MaedaEl-Saharty & Maeda, 2006); in 2015, it accounted for only 1% of current spending on health (WHO, 2018). In the same year, out-of-pocket payments amounted to 89% of private spending on health (which is less than the 95% seen in 2000, according to WHO data) and to 62% of current health spending (unchanged compared with 2000). The share of private prepaid plans increased from 0.4% in 2000 to 1.7% in 2011 (Oxford Business Reference GroupGroup, 2017).
Market overview and development
The main types of private health insurers are: trade unions (syndicates) and private or state-owned companies. Private companies can be further divided into commercial (for-profit) insurers and health maintenance organizations (HMOs). People are encouraged to take-up private health insurance through tax subsidies in the form of tax relief on premiums. In 2002 it was estimated that 3.3 million Egyptians, or about 4.9% of the population, had some form of private health insurance cover. The majority of people with private health insurance cover (about 97%) were covered by syndicates, with the remaining 2.6% being covered by private companies (commercial insurers and HMOs) and 0.6% by state-owned companies (Reference Nassar and El-SahartyNassar & El-Saharty, 2006). Since then, it is estimated that the number covered by private companies has doubled or tripled.Footnote 12
Detailed information on private health insurance schemes is limited, particularly on schemes that were not overseen by the Egyptian Insurance Supervisory Authority (EISA), the regulatory authority that governed the insurance industry under the Ministry of Investment until 2009. In July 2009, the Egyptian Financial Supervisory Authority (EFSA) took over this role, as well as that of the Capital Market Authority and the Mortgage Finance Authority.
Syndicate (“nikabat”) schemes
These organizations promote the social welfare of various professions such as doctors, engineers and lawyers. Around 70% of syndicate scheme members live in the two largest cities, Cairo and Alexandria. The annual premium charged by syndicate schemes is generally around LE250 per enrollee, with premiums increasing with duration of enrolment on the assumption that senior members have higher incomes. Other family members, including parents, can enrol in return for higher premiums and higher cost sharing. No medical examination is required before enrolment. Annual subscriptions can be renewed for life.
Scheme benefits vary but are usually provided up to an annual spending ceiling of about LE10 000 per enrollee for a basic package of ambulatory care and up to an additional LE3000–5000 for more specialized services. Members are entitled to a capped number of outpatient consultations per year, although they can buy coupons for additional outpatient visits.Footnote 13 Inpatient and major outpatient services require prior approval. Cost sharing (set as a coinsurance rate of about 20–30%) applies to inpatient and most outpatient services. Services excluded from cover commonly include dental, optical and maternity care. Prescription drugs are not covered except as part of inpatient treatment. Very few schemes reimburse the use of services from providers outside their accredited provider networks. Providers are paid on a fee-for-service basis but the schemes are able to set relatively low fees because of the large volume of services they guarantee. Utilization reviews are occasionally conducted, mainly by the Medical Union scheme.
The schemes keep costs down through low spending on marketing and by sharing costs with the syndicates’ administration. They are also subsidized from other sources of income generated by the syndicates (for example, stamp tax revenues for the lawyers’ syndicate). As the schemes are non-profit they are exempt from corporation tax. They are self-regulated by the elected representatives of the syndicates rather than by EFSA, which means that they are not subject to minimum capital or solvency requirements and do not need to register their insured subscribers (unlike the HMOs, see below).
Private and state-owned companies
When it started, this served less than 0.2% of the population – mainly employees of private, well-financed companies, a few high-income individuals and the international community (Reference RafehRafeh, 1997). By 2016, the number of subscribers had grown substantially.Footnote 14 Demand seems to have increased rapidly in recent years from a very low base. Premiums from commercial insurers (not including HMOs) and state-owned companies totalled LE241.3 million in 2007 (EISA, 2007). This represented a 400% increase from 2002, although it is not clear to what extent the increase was caused by growing numbers of subscribers or rising premiums.
(1) Commercial (for-profit) insurers: Most plans charge annual premiums ranging from LE1000 to LE1800 per enrollee. The annual benefit limit is typically around LE20 000 but it can go up to LE50 000 per beneficiary with sublimits for most service categories. Similar to syndicate schemes, most insurers use preferred-provider networks and provider payment is based on fees per service or disease category. To increase choice, reimbursement of services rendered outside these networks is generally possible up to a ceiling. In terms of benefits, with the exception of group policies covering more than 100 members, most plans have long exclusion lists. Unlike syndicate schemes, however, coverage usually includes optical, dental and maternity care, up to a ceiling. Expensive interventions require prior authorization. Over 70% of policies are held on a group basis by employees of large public or private entities and companies that have opted out of HIO coverage. Premiums are revised annually to adjust for high-risk individuals, are usually paid by employers and generally depend on the number of subscribers, their age and the level of cover chosen. Further, cover is commonly offered at below cost and partially subsidized by other more profitable lines of business, typically life insurance.Footnote 15
Under the former EISA regulations, commercial insurers were required to have a minimum capital requirement of about LE30 million (this was considered as high in relation to the volume of premiums generated in the market); hold funds in Egypt with a value at least equal to the value of their technical reserves; and abide by solvency requirements. To what extent this will be revisited is still not clear.
(2) Health maintenance organizations: The HMOsFootnote 16 are entities comprising networks of doctors and providers that provide managed care in return for an annual premium. Established as general incorporations, HMOs are not supervised by EISA, and can avoid registration of insured subscribers and minimum capital or solvency requirements. Annual premiums are usually marginally lower than those of commercial insurers. HMOs offer a wide range of services including comprehensive outpatient and inpatient services and emergency care. In general, they do not cover dental care, maternity care, home visits, regular check-ups or optical care, require prior authorization for more expensive treatments and charge co-payments. A medical examination is usually required before enrolment and premiums are risk rated. As they are not under EISA supervision, HMOs have been in a position to exclude high-risk individuals. Recently, many HMOs have been struggling due to rising health costs and many have transformed into TPAs to avoid managing actuarial risk.
(3) State-owned companies: State-owned companies are under the regulation of EFSA. Among them, three (Al Chark, National Insurance and Misr Insurance) have 50% of the state-owned market share. In 2006, these three insurers and the state reinsurance company merged, forming the Insurances Holding Company. State-owned companies offer group cover at below cost due to cross subsidization from more profitable lines of business. Most of the plans are community rated.
The overall market share of the state-owned insurers has been steadily declining.Footnote 17 This is because the government has been decreasing its budgets and the quality of care offered by state-owned companies is generally perceived to be lower than that offered by the private companies. State-owned companies also tend to incure more losses than private companies as their subscriber base is generally older (though the losses are ultimately covered by the government).
Assessment of market impact on health system goals
Equitable access to health care and financial protection
A study using data from the Household Health Service Utilization and Expenditure Survey suggested that, controlling for various socioeconomic and demographic variables, access to private health insurance (private companies and syndicates) is unequal, with factors such as higher income levels, higher education and urbanization increasing the probability of enrolment (Reference Nassar and El-SahartyNassar & El-Saharty, 2006). Low demand for private health insurance may be explained by survey data from 2002, which showed that 54% of uninsured households preferred to remain uninsured, whereas the average household was willing to spend LE83–180 on premiums per household per year (MOHP Government of Egypt, 2002). This is substantially lower than the premiums charged by commercial insurers, but is within the range of premiums charged by syndicate schemes.The scope of the benefits package and the price of premiums are not regulated, so private health insurance is largely unavailable to poorer people and people with high levels of morbidity. Premiums are exempt from income tax, which constitutes an indirect and regressive form of public subsidy.
The effect of these inequalities in access to private health insurance on equity in the use of health services is difficult to estimate. A study that attempted to measure the impact of private health insurance on health financing by comparing the effects of total private health insurance coverage, HIO coverage or no insurance coverage was not able to draw firm conclusions due to the small number of private health insurance enrollees in the sample (Reference Nassar and El-SahartyNassar & El-Saharty, 2006). However, it identified equity concerns associated with the much larger HIO scheme, which enables the wealthier, formally employed population to use health services at a higher rate than the poorer, uninsured informal sector. Three quarters of those covered by private health insurance were also covered by the HIO (Reference Nassar and El-SahartyNassar & El-Saharty, 2006). In addition, these individuals have access to services offered by the Ministry of Health (offered to the whole population), meaning that they effectively have triple coverage.
Incentives for efficiency and quality in service organization and delivery
The regulatory system is to be reformedFootnote 18 to enhance its supervisory role and increase transparency and the dissemination of information. The creation of EFSA is thought to be a step in that direction. In the past, the weaknesses of the EISA regulatory framework and reporting mechanisms contributed to a lack of detailed information on insurers and available plans and prevented consumers from easily comparing the benefits and value for money of different private health insurance plans. This, together with the absence of one regulator for all types of private health insurance, has limited competition between various subsectors and plans in the market, which may have lowered efficiency.
Private health insurance schemes are not required to publish data on client satisfaction or quality of care and quality of care was not regulated by EISA or EFSA. Although private providers may in many cases provide better quality care than the HIO or the Ministry of Health, there is little to suggest that private health insurance has improved the quality and efficiency of private or public health care provision due to the weakness of its contracting mechanisms, which do not create appropriate incentives for providers.
India
noah haber, emma pitchforth and philipa mladovsky
The health system in India is financed from a number of sources: state and central government budgets; the private sector, including the not-for-profit sector targeting populations directly and through insurance; households through out-of-pocket payments; social and community-based insurance; and external financing (Reference RaoRao et al., 2005). Out-of-pocket payments are the dominant source of funding, accounting for 65% of total spending on health and 93% of private spending on health in 2015 (WHO, 2018). Private health insurance accounts for 5% of current spending on health (WHO, 2018), but it is rapidly becoming the primary source of health financing through public–private partnerships, with recent political focus on achieving universal access to health care by 2022 (Reference PatelPatel et al., 2015). These public–private partnerships have led to large increases in private health insurance coverage in India over the past decade, with the proportion of people covered growing from 3–4% of the population in 2005 (Reference PrinjaPrinja et al. 2012) to 22% in 2014 (IRDA, 2015; WHO, 2018).
Public spending on health is among the lowest in countries in the region or of similar income, making up only 3.9% of gross domestic product in 2015 (WHO, 2018). Government-sponsored schemes cover 74% of all people with private health insurance, but they account for only 13% of the total value of claims filedFootnote 19 (IRDA, 2015). Private providers make up the majority of both outpatient (70%) and inpatient (60%) care (Reference PatelPatel et al., 2015). Private health care is generally considered to be of much higher quality than public care (Reference RaoRao et al., 2014), though there is very large variation in the type and quality of care provided (Reference MackintoshMackintosh et al. 2016). This has motivated the government to provide public financing of public–private partnerships such as the Rashtriya Swasthya Bima Yojana (RSBY) scheme (see below), which enables access to higher-quality private health care for those who could otherwise not afford it (Reference DevadasanDevadasan et al., 2013; Reference Virk and AtunVirk & Atun, 2015). However, private health care is generally unregulated (Reference Garg and NagpalGarg & Nagpal, 2014), leading to continuing concerns over quality and access to care (Reference PatelPatel et al., 2015). There are large disparities in both financing and provider coverage between urban/rural areas as well as between income groups. Health insurance schemes in India typically only cover inpatient care. This leaves very large gaps in financial protection (Reference Selvaraj and KaranSelvaraj & Karan, 2012) and poorly incentivizes more cost-effective preventive care in outpatient settings (Reference AhlinAhlin et al., 2016; Reference DevadasanDevadasan et al., 2013; Reference PrinjaPrinja et al., 2012).
Market origins
The history of private health insurance in India is extremely short. Before 1999, the Government of India maintained a legal monopoly on all forms of insurance, using a nationalized insurance organization and its subsidiaries for all insurance provision (Reference SinhaSinha, 2002). The first private health insurance scheme in India, Mediclaim, was introduced in 1986Footnote 20 as a hospitalization indemnity scheme administered by government-owned non-life insurance firms (USAID, 2008), on which modern Indian health insurance schemes are still based. TPAs, which constitute another feature of the health insurance market in India, were introduced in 1996. The TPAs serve as the intermediaries between the insurers, providers and policy-holders (Reference Bhat and BabuBhat & Babu, 2004; Reference GuptaGupta et al., 2004; USAID, 2008), handling the majority of insurance transactions to this day.
Market overview and development
As part of wider economic reforms and liberalization of markets, the Indian parliament passed the Insurance Regulatory and Development Authority (IRDA) Act in 1999, which allowed the private sector and foreign firms to participate in the private health insurance market under the regulation of the IRDA (USAID, 2008). The General Insurance Corporation became the national reinsurance organization as part of this reform, with four subsidiary insurance companies (Reference GuptaGupta et al., 2004). These four companies are now independent but publicly owned insurance companies, blurring the line between private and public health insurance. Market liberalization resulted in around two thirds of for-profit private health insurance companies having foreign partners and the first stand alone private health insurance company launching by 2006 (USAID, 2008). In January 2007 the IRDA removed tariffs from general insurance with the aim of driving additional growth of the private insurance market, better risk management and risk rating, and the development of new, consumer-oriented policies (PricewaterhouseCoopers, 2007; USAID, 2008).
The number of persons covered by voluntary private health insurance has grown from 0.69 million in 1991–1992 to 3.5 million in 1998–1999 and around 17 million in 2005–2006, reaching 1.56% of the population by 2006 (USAID, 2008). In 2015, 74 million individuals were insured under either group or individual insurance schemes (6% of the population), with an additional 214 million (17% of the population) covered by government-sponsored schemes (IRDA, 2015). The publicly owned insurers currently control 64% of the health insurance market, with private general non-life insurance companies making up 22%, and insurance companies that exclusively offer health insurance controlling the remaining 14% of the market. Life insurers can also offer private health insurance in the form of additional optional health benefits; however, health coverage offered through these riders is marginal.
In 2004, the national government introduced the Universal Health Insurance (UHI) scheme, a public–private partnership that attempted to extend private health insurance to those living below the poverty level through central government premium subsidies. The only annual premium to be paid by the individual was Rs365Footnote 21 per person (UHI is also referred to as the “Government Rupee-a-Day” scheme). The scheme was implemented through the four public sector insurance companies but it was largely unsuccessful, partly because it was loss-making for the insurance companies due to adverse selection and because the families below the poverty level were unwilling or unable to prepay the annual premium in a lump sum (USAID, 2008).
Recognizing the weaknesses of UHI, in 2007 the Indian government launched RSBY – a national scheme for people living below the poverty line. RSBY provides annual hospitalization coverage up to Rs30 000 for a family of five and some coverage for transportation. All pre-existing diseases are covered from day one and there is no age limit for beneficiaries (Reference JainJain, 2010).
As with UHI, RSBY is government funded but relies on private health insurance operators for its implementation. However, in the case of RSBY each state government selects the implementing insurance company (public or private) through an open tendering process. In addition to their normal role of providing insurance, the contracted operators are responsible for enrolling a predefined list of households below the poverty level; contracting nongovernmental organizations to conduct information and awareness campaigns; setting up a kiosk in each village to manage the scheme; and providing a toll-free call centre. Other innovative features are: a one-off registration fee of Rs30; a paper-less system that uses biometric-enabled smart cards; portability of insurance across India; private health insurance operators that contract both public and private government accredited hospitals, creating competition between the two sectors because beneficiaries can choose the provider; direct reimbursement of providers by the implementing insurance company or TPA (Reference JainJain, 2010). In 2016, RSBY covered over 41 million persons (around 3% of the population) (RSBY, 2016).
Types of policies
Almost all insurance products in the Indian market cover hospitalization expenses. The main sources of out-of-pocket expenses (dental services, ophthalmology, preventive care, long-term care and expenses associated with outpatient services) are typically not covered.
Insurance policies are typically based on the Mediclaim programme from 1986 (Reference RaoRao et al., 2005; USAID, 2008). Policies cover people aged 5–80 years old although children aged from 3 months to 5 years may be covered if a parent is covered at the same time. Additionally, it is possible to increase coverage to 85 years if policy coverage continued without any breaks. There is no patient cost-sharing up to the ceiling of the sum insured. Coverage includes expenses incurred during hospitalization and/or domiciliary hospitalization due to illness, disease or injury (such as room and board at the hospital; nursing expenses; surgeon, anaesthetist, medical practitioner, consultant, specialist fees; anaesthesia, blood, oxygen, operation theatre charges, surgical appliances, medicines and drugs, diagnostic material, X-ray; dialysis, chemotherapy, radiotherapy, cost of pacemaker, artificial limbs and cost of organs and similar expenses) and relevant medical expenses up to 30 days before and 60 days after hospitalization. Exclusions include pre-existing conditions, diseases contracted within the first 30 days from the commencement of the policy, expenses of treatment for certain diseases (during the first year), preventive treatment, plastic surgery, cost of spectacles, contact lenses, hearing aids, dental treatment, AIDS, maternity, naturopathy. The benefit limit varies widely across plans and the premiums are calculated from a matrix of sum insured and age of the person (USAID, 2008).
Other types of private health insurance policies offered in India are critical illness policies and hospital cash policies (USAID, 2008).
Pricing
Average annual premiums per person covered have more than tripled in the past 5 years for the individual market, from Rs928 in 2010 to Rs3454 in 2015, while group rates have remained relatively stable at around Rs2000 rupees per person per year (IRDA, 2015).
Between 1995 and 2005, claims grew at a faster rate than premiums, indicating a decreasing profitability of private health insurance (USAID, 2008). Claim ratios for government-sponsored schemes rose rapidly from 93% in 2013/2014 to 108% in 2014/2015 and currently only the individual insurance policy market remains profitable, with both group and government-sponsored insurance plans being sold at a loss (on average) (IRDA, 2015). One possible reason is that the four main private health insurance operators have not had the actuarial capacity for pricing or analysing health services costs and utilization increases and have used “intuitive pricing”, prioritizing premium affordability to the insuring public. Another reason is that private health insurance premiums have not increased in line with medical inflation (USAID, 2008). A third reason is that non-life private health insurance operators have tended to absorb losses from health insurance products by cross-subsidizing from other more profitable areas of insurance. Previously, under the Insurance Act, operators in the non-life insurance market had to adhere to the tariffs set by the Tariff Advisory Committee, or face punitive action. However, the nonseparation and categorization of health insurance under “miscellaneous” insurance meant that health insurance was not tariffed. As tariffs in the other non-life insurance segments were set high in comparison with private health insurance premiums,Footnote 22 profits in these other lines of insurance were greater than in private health insurance (USAID, 2008).
The cost of health insurance policies, group and individual, has varied considerably between companies. In general, premiums are determined by age of the insured and level of coverage. National pricing has been maintained with non-urban areas subsidizing urban areas where medical costs are far higher. However, differential geographical pricing is permitted and may become more common in response to high hospitalization costs in some areas (USAID, 2008).
Public policy towards the market
The IRDA, in place since 1999, has a dual function to both regulate and develop the insurance market. In terms of regulation, it covers:
– consumer protection through licensing of insurers, regulation of advertising and regulation of TPAs
– solvency of health insurers through minimum capital and surplus laws and regulations and auditing
– grievance and dispute resolution through an insurance ombudsman system established in 1998 following recognition that the civil courts and consumer protection were ineffective for insurance-related claims because of delays and high expense (USAID, 2008).
Recognizing the limitations of a retrospective reimbursement system where the burden for maintaining receipts and filing claims lies with the policy-holder, TPAs first emerged in 1996. TPAs came under the regulation of IRDA in 2002, partly to help increase uptake of private health insurance. TPAs have the following responsibilities (Reference BhatBhat et al., 2005; USAID, 2008):
– enrolment services including the enrolment of policy-holders and dependants into its system and issuing photo-ID cards to both
– call-centre services including pre-authorization of hospital expenses and deposit waiver for admission to the network hospital
– managing access to hospital network, which allows policy-holder-negotiated services and rates, including admission deposit waiver and direct settlement of bills
– claims administration including adjudication, processing and settlement of claims for in-network and out-of-network claims
– information reporting including generating predefined reports for enrolment, claim related statistics and operations performance statistics to the insurer and generating periodic financial information and operating performance reports to the IRDA.
Although TPAs are not mandatory, they handle over half of all cashless health insurance claims transactions (IRDA, 2015). However, it is not clear whether TPAs have increased demand for private health insurance. Furthermore, the introduction of TPAs and direct settlement has led to uncontrolled price increases by hospitals who charge higher rates to the insured than uninsured (policies such as Mediclaim have a maximum annual sum assured, and it is thought that hospitals target this figure). TPAs have limited criteria on which to base hospital selection and do not require hospitals to demonstrate or sustain quality of care.
Another step to encourage private health insurance uptake was the introduction of tax incentives. Since 2002, the government has allowed a deduction from taxable pay of premiums up to Rs15 000 (Rs20 000 for senior citizens). This may have contributed to growth in demand (USAID, 2008) but analysis of the value and effectiveness of this tax subsidy for private health insurance is lacking.
Assessment of market impact on health system goals
Equitable access to health care and financial protection
A system based on risk-rated premiums, determined by health status and age has implications for equitable access, because typically those most in need pay higher premiums. Stringent exclusions based on pre-existing conditions mean that currently those most in need of insurance, the sick, are excluded. There is often ambiguity over what constitutes a pre-existing condition, allowing companies to apply exclusion retrospectively and not cover claims made by policy-holders (USAID, 2008).
Historically, private health insurance coverage has been more common in urban than rural areas and almost entirely restricted to the wealthiest two quintiles of the population (Reference 95ArokiasamyArokiasamy et al., 2006). There were also geographic differences in private health insurance take-up, with states such as Assam having negligible share of population covered and Maharashtra having higher private health insurance coverage, and differences according to the religion of household head (higher among Jain households than any other) (International Institute for Population Sciences, 2007). However, it is unclear how the recent increase in private health insurance coverage has changed the equity landscape in India, particularly as health insurance coverage continues to move towards universal levels.
Tax incentives have led to public subsidization of the private health insurance premiums of this population. As such, the development of private health insurance has not supported national health policy. The current Five Year Plan (2012–2017), which aims to ensure access to health care for all, calls specifically for expansion of public–private partnerships, in particular expansion of RSBY (Government of India, 2013). Unfortunately, these types of public–private partnerships lack strong incentives and provisions for outpatient and preventive care.
Incentives for efficiency and quality in service organization and delivery
There is no incentive for providers to limit care, other than the limits of sums covered by policies. Related to this, there is no obligation for providers to provide quality care and providers bear no risk for the prices they charge. Medical costs have therefore increased without any guarantee of quality of care. The lack of regulations in this area is a major concern. Administrative costs are high and have not been improved by poor coordination between TPAs and insurance companies.
Conclusions
Private health insurance has failed to address the problem of high out-of-pocket payments on health care in the three countries studied here. It is unable to do so because it is beyond the financial reach of those most in need of access to health care and financial protection, even where there is regulation to ensure open enrolment and a minimum package of benefits (Brazil), and because it is mainly targeted at formal sector employees or at professionals (Egypt). Depending on how they are structured, tax subsidies for private health insurance do not always reach the poor or those who are denied access to the market due to age or pre-existing conditions and therefore end up paying for the health care costs of those who are already better off, both financially and in terms of health status.
In Brazil, private health insurance is an important component of health financing policy. Brazilian government has responded to the manifold negative effects of private health insurance growth by introducing measures to expand access to the market, and improve the efficiency and quality of the care provided under private health insurance. So far, expanding access to private health insurance has had the presumably unintended effect of exacerbating inequalities in access to health care and financial protection.
This offers important lessons to Egypt and India, where private health insurance penetration levels are low and where the private health insurance regulatory framework remains weak. Addressing this weakness is particularly pressing for the Indian government as it increasingly finances health care for the poor through private health insurance, via schemes like RSBY and UHI. Potentially the government is in a good position to shape the future market, with IRDA being already in place as a regulatory authority with responsibility for market development. However, health insurance needs to be identified and regulated as a separate insurance commodity. The growth in the number of individuals covered by private health insurance has stagnated in recent years, with the exception of government-sponsored plans. It is plausible that this is due to a relatively low value proposition of private health insurance to the consumer, due in part to lack of control over medical costs or quality of care. Second, inefficiencies remain in the processing of claims and relationships between TPAs and insurance companies. This in turn adversely affects consumer experience. Finally, there has been little marketing effort on the part of health insurers, which may have led to a poor understanding of private health insurance in the population.
In Egypt the expansion of private health insurance is not envisaged as a key policy for meeting health system goals. Efforts to introduce an insurance law seem to have stalled in recent years, hampered, among others, by the 2011 uprising and subsequent economic situation, lack of workers skilled in key insurance functions, including premium rating and underwriting, limited development of the reinsurance market and lack of general insurance data. Capital requirements for a private health insurance business are very high, which results in private health insurance being sold with other insurance products for cross-subsidization. The attractiveness of operating as a TPA compared with a health insurance company further impedes the development of the private health insurance market. All that, along with the weak economic situation, will probably make it challenging for the sector to grow formally over the foreseen future.


 Open access