


Implications
Causal pathway-based ‘mechanistic models’ have supported decision making and knowledge transmission in animal production for decades, but their role in the era of ‘big data’ and ’data science’ is unclear. This positional paper proposes that hybridization of modelling approaches represents a niche for animal production where our cumulative biological knowledge expressed in mechanistic models meets the emerging data collection and predictive potential of data science using machine learning and deep learning methods. While both approaches have strengths and unique niches, their true strength may lie in a synergistic relationship.
Introduction
The big data wave
The term ‘big data’ has gained considerable attention in recent years, though its definition tends to differ across disciplines (Morota et al., Reference Morota, Ventura, Silva, Koyama and Fernando2018). Common themes in ‘big data’ definitions are (1) volume: that the volume of data is so large that visual inspection and processing on a conventional computer is limited; (2) data types: may include digital images, on-line and off-line video recordings, environment sensor output, animal biosensor output, sound recordings, other unmanned real-time monitoring systems as well as omics data (e.g. genomics, transcriptomics, proteomics, metabolomics and metagenomics) and (3) data velocity: the speed with which data are produced and analysed, typically in real-time. In order to gain insight from these large volumes of readily available data, it has become increasingly popular to apply data mining and machine learning (ML) methodologies to cluster data, make predictions or forecast in real-time. Thus, the topics ‘big data’ and ML, though not explicitly tied together, often work hand-in-hand.
The emergence of big data and its associated analytics is visible in scientific referencing platforms such as Scopus, where yearly ‘big data’ references rose from 680 in 2012 to 16 562 in 2018. When combined with the keywords ‘cattle’, ‘pigs’ or ‘poultry’, the first reference to ‘big data’ appears in 2011, but there are only 172 total references from 2011 to 2018 inclusive, indicating a much slower development rate within animal production systems. Liakos et al. (Reference Liakos, Busato, Moshou, Pearson and Bochtis2018) highlighted that 61% of published agriculture sector papers using ML approaches were from the cropping sector, 19% in livestock production and 10% in each of soil and water science, respectively. There may be several reasons for the slower adoption rate in animal production systems, including the current degree of digitalization, the utility offered, low/unclear value proposition, return-on-investment (ROI) and the challenge of maintaining sensitive technology in corrosive, dusty and dirty environments.
The use of models in animal agriculture
Models of all types (Figure 1) have a strong history of application in animal production, where their objectives have typically revolved around optimally feeding and growing livestock. For an excellent review of the historical evolution of model development and use, for example, in ruminant nutrition, see Tedeschi (Reference Tedeschi2019). Such a development path has largely been paralleled in swine and poultry (Dumas et al., Reference Dumas, Dijkstra and France2008; Sakomura et al., Reference Sakomura, Gous, Kyriazakis and Hauschild2015). These predominantly nutritional models have evolved to mathematically express our cumulative biological knowledge on how a system works, developed in order to understand and manipulate nutrient dynamics in the animal. Numerous modelling groups across species, globally, have further developed detailed mechanistic models (MMs) to solve problems both within the scientific community as well as in practice. In the field, they serve as ‘decision support systems’ or ‘opportunity analysis’ platforms. Here, we might define ‘opportunity analysis’ as the ability to examine a variety of scenarios for their potential outcomes, with the goal of improving performance, reducing cost and minimizing environmental impact (e.g. Ferguson, Reference Ferguson, Sakmoura, Gous, Kyriazakis and Hauschild2015). These nutrition models have been modified, over generations, to account for specific concerns of their eras (e.g. environmental impact) via revisions, expansions and sub-model development, illustrating the sound structural nature of MMs – being based on biological principles allows addition of content, as opposed to requiring complete redevelopment for a new innovation.

Figure 1 Types of models and their classification. ML = machine learning, ANN = artificial neural network, SVM = support vector machine, HMM = hidden Markov model, PCA = principle component analysis, ICA = independent component analysis, ISOMAP = non-linear dimensionality reduction method, GLM = general linear model.
The role of mechanistic models in the big data era
Given the push towards fully automated ML systems to interpret the new wave of big data available on-farm and the strong predictive abilities of data-driven (DD) models, the role of MMs is occasionally questioned, as ML-based systems can also be programmed to predict outcomes similar to MMs (e.g. milk yield, feed conversion ratio, etc.). While there are places of overlap, it may be that a distinctive niche remains for both MM and ML modelling approaches, as well as opportunities for both academia and industry to profit from a hybridization or integration of the two approaches. However, this prospect means that the future animal science modeller will require a revised toolbox to cope with advances in technology, statistics and the business of animal production itself.
The objective of this paper is to examine the niche for both conventional MM and new DD modelling approaches as we move into an era of big data and to postulate on opportunities for the two approaches to cooperate and propel the field of animal science forward. This paper will first examine the attributes and niches currently occupied by MM and new DD methods, and then postulate on possible approach integration strategies, which may aid in the goal of producing animal products more efficiently – both economically and environmentally.
Mechanistic modelling methodology
Mechanistic models seek to describe causation (though they always contain empirical components). A MM may be defined as an equation or series of equations, which predict(s) some aspect of animal performance based on its underlying principles (France, Reference France1988). If the animal is considered level ‘i’, then the organ may be considered level ‘i − 1’, the tissue level ‘i − 2’, the cell level ‘i − 3’ and the flock or herd may be considered level ‘i + 1’. Therefore, a MM may seek to describe level i observations with level i − 1 hierarchical representation. The general assumption with MM development is that behaviour of the system can be predicted from the sum of its modelled parts, and that we know the system’s causal pathways. In some instances, we may postulate on the causal pathway via development of a MM and use the modelling/experiment exercise to decide whether we consider this pathway ‘known’ or not.
France (Reference France1988) described three important attributes of such a ‘hierarchical’ MM system:
1. Each level has its own language, concepts or principles. For example, the terms ‘forage DM’ and ‘pasture management’ have little meaning at the cell or organelle level;
2. Each level is an integration of items from lower levels. Discoveries or descriptions at a lower level can be used at the higher level in an explanatory way to aid understanding (mechanism and mode-of-action) and
3. Successful operation at the higher level requires the lower level to function properly but not necessarily vice versa. The example France (Reference France1988) provides is that of a cup – if it is smashed it will no longer function as a cup, but the molecular properties are hardly altered.
In development, the MM approach requires conceptualization of a hypothesis centred on how a system works, and thus how variables are interconnected. A MM is developed by looking at the structure of the system under investigation, distinguishing its key components and quantitatively analysing the behaviour of the whole system in terms of its individual components and their interactions with one another. The general approach taken in the development of a MM could be summarized as follows:
1. Problem identification, hypothesis generation and definition of model bounds. For example, a digestion kinetic model may choose to focus on macronutrient digestibility and ignore vitamins and minerals or what the animal does with the macronutrients post-absorption;
2. Model conceptualization. Graphical representations such as boxes and arrows are used to depict known or hypothesized causal pathways;
3. Data collection (extant or new) to develop the model, generally piecewise, addressing small biological components of the model (e.g. passage rate prediction within a digestion kinetic model);
4. Model equations and assumptions: Deciding on the type of equation to represent fluxes, assigning equations to the arrows, parameters to equations (science execution);
5. Model evaluation (statistical, graphical, sensitivity, behaviour and scenario) performed by modeller;
6. Repeat steps 1 to 5 for subsequent phases of model development.
Difficulty is often encountered discriminating between essential and nonessential components of a MM, in determining the appropriate equation structure assigned to a relationship and when deciding on the required level of model complexity – thus the need for clearly defined boundaries and objectives from the outset. Often the model will inform the developer when additional complexity or reconsideration of structure is required – that is, when it fails to predict an outcome. In this way, there is often a strong back-and-forth between model development and data-based experimental work – whereby data-based experimental work is used to parameterize a MM, and the MM may indicate in return where knowledge or data are missing from the body of literature in that area.
Such MMs are often coded using programming languages such as Fortran, C/C+/C#, Python, R and Delphi. It is common that MMs are also dynamic (though it is not a requirement), meaning that they simulate over time. This is often accomplished through a series of integrated differential equations (e.g. Dijkstra et al., Reference Dijkstra, Neal, Beever and France1992) but can also be accomplished by a series of ‘do’ loops (e.g. hourly and daily) within a code (e.g. Emmans, Reference Emmans1981).
Model evaluation is conducted separately from model development, manually by the developer, and generally includes an assessment of model performance (precision and accuracy), model behaviour and sensitivity analysis, as well as the evaluation of a model’s ability to predict the correct response to ‘scenario’ data. This evaluation is accomplished via the application of a range of evaluation metrics including root mean square prediction error, concordance correlation coefficient, residual plot analysis as well as a host of other performance metrics and visualization strategies (e.g. Tedeschi, Reference Tedeschi2006). The goal is to determine how well the model performs across a range of existing data and, if applicable, to identify weak points, which require reassessment or modification. The model evaluation process may be manual, performed by the developer (e.g. using the error metrics indicated above), or if the exercise is to fit a MM to existing data, the model may be parameterized via fitting algorithms such as Levenberg–Marquardt, steepest-descent/gradient descent, Newton method, etc. to minimize a residual error metric.
Niche for mechanistic models
Opportunity analysis
Mechanistic models aim to represent causality in complex systems. Historically, the most prominent niche occupied by MMs in animal production has been that of solving problems where the intricacies in animal data are too great to solve the problem experimentally. This is where representation of the underlying biology of a system with a MM can assist in determining the impact of a given change (e.g. when concurrent influencers cancel each other out). Mechanistic models have been used to solve problems such as: (1) identification of performance limiting factors; (2) determination of the optimal nutrient contents of a feed; (3) evaluation of management factors to optimize performance (Ferguson, Reference Ferguson, Sakmoura, Gous, Kyriazakis and Hauschild2015); (4) examine strategies such as those to reduce nutrient excretion into the environment (Pomar and Remus, Reference Pomar and Remus2019) or (5) forecasting outcomes in scenarios not yet seen in practice (Ferguson, Reference Ferguson, Sakmoura, Gous, Kyriazakis and Hauschild2015). Such MMs are developed to synthesize our biological knowledge into platforms (models) from which ‘wisdom’ and decision-making support can be gained. Within the context of this discussion, the data-information-knowledge-wisdom pyramid of Ackoff (Reference Ackoff1989) (as illustrated recently in Tedeschi, Reference Tedeschi2019) is referenced to define knowledge and wisdom. Within this framework, data + context = information, information + meaning = knowledge, and knowledge + insight = wisdom (discussed further below).
Performance optimization
In practice, MMs are often linked to an optimizer – a coding algorithm where, given a desired objective (e.g. minimize cost, maximize growth/milk production, efficiency or ROI), it will determine the optimal solution (e.g. diet formulation) (Ferguson, Reference Ferguson2014) to achieve that outcome. Mechanistic models linked to an optimizer may therefore also consider how genetics, environment or management considerations incorporated into the MM play into determining the optimal feeding program, which takes their capabilities well beyond the scope of traditional feed formulation software (e.g. least cost formulation). Optimization programs essentially automate the decision-making process – coincidentally, already a ‘hybridization’ of the MM and DD approach, via the iterative fitting algorithms used in optimization (similar to the way a DD model may find a solution).
Understanding biological systems
Intellectually and academically, MMs provide animal scientists the opportunity to explore how a biological system works, extract meaningful information from data (e.g. metabolic fluxes from isotope enrichments (France et al., Reference France, Hanigan, Reynolds, Dijkstra, Crompton, Maas, Bequette, Metcalf, Lobley, MacRae and Beever1999) and thus increase our understanding of complex systems and advance the whole field of animal science. They are often used to summarize experimental data to derive meaningful parameters used in other applications, for example, fractional rates of rumen degradation (France et al., Reference France, Dijkstra, Dhanoa, Lopez and Bannink2000) or specific rates of mammary cell proliferation (Dijkstra et al., Reference Dijkstra, France, Dhanoa, Maas, Hanigan, Rook and Beever1997). In research, MMs are not immune to failure. In fact, they are excellent tools for identifying areas where scientific knowledge is lacking, or where a hypothesis on the regulation of a system may be wrong. Failure of a MM to simulate reality indicates an area where the system has not been appropriately described, and this could be due to a false assumption, a lack of appropriate data or because the level of aggregation at which the model runs is not appropriate for the research question. When models interact iteratively with animal experimentation, MMs assist movement of the whole field forward by increasing our biological knowledge.
Approach limitations: mechanistic models
Current limitations of the conventional MM approach revolve around their manual nature, extensive input requirements and developer/end-user training requirements. From the end-user perspective, these challenges may mean that MMs may not be user-friendly or approachable enough to guarantee use and acceptance. Some have suggested that such problems are rooted in communication and training as opposed to user-friendliness (Cartwright et al., Reference Cartwright, Bowgen, Collop, Hyder, Nabe-Nielsen, Stafford, Stillman, Thorpe and Sibly2016), and protocols to improve the user experience, such as customer journey mapping, are recommended (Vasilieva, Reference Vasilieva2018).
Tedeschi (Reference Tedeschi2019) reflected that innovation in MM for ruminant nutrition had gone stagnant since 2010 and proposed several reasons why, including (1) the field had reached a certain level of maturity or that (2) students are not being properly introduced to the required ‘systems thinking’ approach. We further suggest that the ‘lag’ observed by Tedeschi (Reference Tedeschi2019) could have an additional origin related to reaching a level of success with nutritional models beyond which we need to integrate with other disciplines – genetics, epigenetics, health, animal management, environment, whole farm modelling and life cycle assessment – before further knowledge (and then wisdom) can be extracted from the generated models.
Data-driven methodologies
In contrast to MMs, DD models structurally rely on correlations within a data set to determine the best combination of input variables that predict the desired outcomes, based on goodness-of-fit as opposed to mode-of-action or mechanism. Hence, their structure is ‘driven by the data’. Perhaps the most widely known and applied DD method in animal nutrition is linear and non-linear regression, including meta-analysis. In the world of data science, such a model represents a ‘supervised’ ML method (Figures 1 and 2, defined below). As modern regression methods are already commonly applied in animal science, they will not be further discussed in this paper, except with respect to discussing where they fall in model classification schemes. Rather, the objective here is to examine ‘new’ frontiers in DD modelling, which might alter or interact with MMs as the field moves forward. In many cases, advanced regression models might interact with new DD modelling methods in the same way. At their core, DD regression models may contain some mechanistic elements, depending on the driving variables and selected structure (Sauvant and Nozière, Reference Sauvant and Nozière2016; Tjørve and Tjørve, Reference Tjørve and Tjørve2017). Also, although we often discuss DD v. MMs in black-or-white terms (France, Reference France1988), the lines between mechanistic and DD models are blurry in practice.
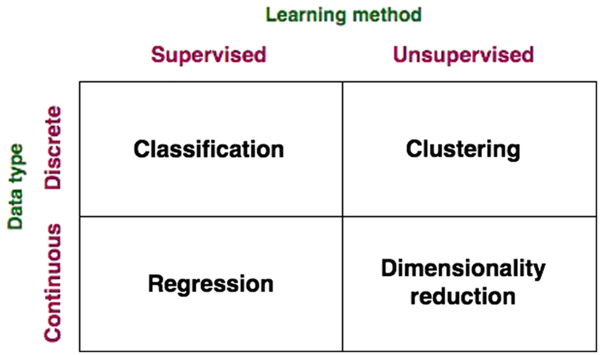
Figure 2 Data-driven model classifications.
A broader categorization of DD models (beyond traditional regression) that fits with the scope of big data and data science broached in this paper is presented in Figures 1 and 2. Data-driven models may be grouped based on the type of learning used therein (supervised and unsupervised), the nature of the data (continuous and discrete) and the category of problems they solve (classification, regression, clustering and dimensionality reduction). Conventional regression modelling (including linear regression, stepwise regression, multivariate regression, etc.), Bayesian models, classification models and most artificial neural network (ANN) models constitute supervised learning models, where the aim is to predict an output variable according to a ‘new’ set of input variables (not previously encountered in training). In supervised learning, as it pertains to ‘big data’, ML systems are presented with inputs and corresponding outputs, and the objective is to construct a general rule, or model, which maps the inputs to outputs. Here, ML may be defined as the ability for a machine to automatically detect patterns in data without being strictly programmed to do so (although its learning algorithm is based on a pre-specified function). By ‘learning’, we refer to the ability for the model to improve predictive performance through an iterative process over time on a defined ‘training data set’. Such supervised DD models are developed via application of statistical fitting procedures to minimize error between predictions and observations (reviewed below). Compared to the MM approach where evaluation of model performance might be manual, ML systems automate this step and iterate towards the best model. The performance of the ML model in a specific task is defined by a performance metric such as minimizing the residual error or mean square error, the same tools applied within MM evaluations. This is called the ‘loss’ function, in data science. The goal is that the ML model will be able to predict, classify or reduce the dimensionality of new data using the experience obtained during the training process.
Conversely, in unsupervised learning, there is no distinction between inputs and outputs, and the goal of the learning is to discover groupings in the data. ‘Clustering’ is a type of unsupervised learning problem aimed to find natural groupings, or clusters, within data. Examples of clustering techniques include k-means (Lloyd, Reference Lloyd1982), hierarchical clustering (Johnson, Reference Johnson1967) and the expectation maximization (Dempster et al., Reference Dempster, Laird and Rubin1977). Dimensionality reduction, another unsupervised learning method, is the process of reducing the number of variables under consideration by reducing their number to a set of principal variables (components). Principle component analysis (PCA) is a common example of a widely applied dimensionality reduction technique.
Across DD approaches, the steps in development are similar to those of MM model development, with the major exception of hypotheses generation and model conceptualization, and might be considered to be:
1. Objective identification (what is to be predicted),
2. Database collection and management (e.g. sensor data, big data and small data),
3. Model encoding (inputs, modelling assumptions, rules, statistical method, etc.),
4. Model training and evaluation (statistical) – often performed iteratively by the system itself, as opposed to manually, as discussed in the previous MM section.
Such DD models are coded in programming languages similar to those used to develop MMs such as FORTRAN, C/C+/C#, Python, R and Delphi.
A significant difference between the MM and DD methodology lies in their interpretability. The MM is a fully ‘white box’ approach – the reasoning behind predictions is fully visible and the logic can be followed. However, most DD methodologies are ‘black box’, meaning a prediction is produced, which may in fact be a very good prediction, but a causal explanation or rationale for the prediction is absent.
To delve further, this paper will describe in more detail clustering, ANNs and dimensionality reduction, as they are methods commonly applied to interpret big data.
Clustering (unsupervised machine learning)
Clustering algorithms, such as k-means and several variants, seek to learn the optimal division of groups of points from properties of the data (Figure 3). The three basic steps of the procedure are (1) initialization – k initial ‘means’ (centroids) are generated at random, (2) assignment – k clusters are created by associating each observation with the nearest centroid and (3) update – the centroid of the clusters becomes the new mean. Steps (2) and (3) are repeated iteratively until convergence is reached, where the result is that the sum of squared errors is minimized between points and their respective centroids. The ‘cluster centre’ is the arithmetic mean of all the points belonging to the cluster, and each point must be closer to its own cluster centre than to the other cluster centres.
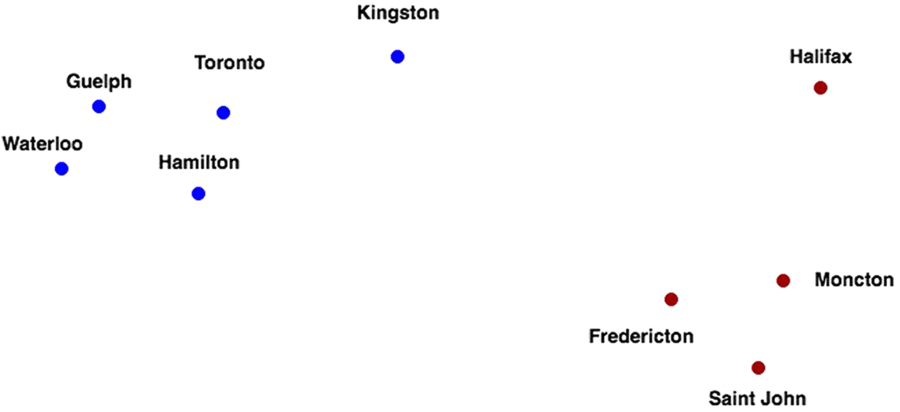
Figure 3 Two distinct clusters of nine Canadian cities using the driving distance metric.
Hierarchical clustering is a type of unsupervised ML algorithm used to cluster unlabelled data points. Similar to k-means clustering, hierarchical clustering group together data points with similar characteristics. Dendrograms are used to follow the division of data into clusters (Figure 4). In essence, a dendrogram is a summary of the distance matrix between all the items that must be clustered. A dendrogram cannot be used to infer the number of clusters. Rather, that can be established based on a user-defined threshold that is equivalent to drawing a horizontal line through the dendrogram that will separate the items into a finite number of clusters (Figure 5).

Figure 4 Dendrogram representing the clustering of nine Canadian cities based on the driving distances among them.

Figure 5 Equivalence between clusters and dendrogram interpretation.
Artificial neural networks (mostly supervised machine learning)
The ANN is an example of a supervised ML model. The ANN is designed to computationally mimic the perceived structure and function of neurons in the brain. These models attempt to emulate complex functions such as pattern recognition, cognition, learning and decision making (McCulloch and Pitts, Reference McCulloch and Pitts1943). The brain does so via billions of neurons that inter-connect, process and interpret information. The structure of an ANN is therefore like a simplified version of the biological neural network, whereby a number of ‘nodes’ are arranged in multiple interconnected layers. Each node is able to integrate the provided input via a weighted sum upon which an activation function (typically logistic) is applied. Exceeding the threshold of this activation function provides an output, which emulates the firing of a neuron in the brain.
An ANN must contain at least three components: (1) the input layer, which inputs data into the system; (2) one or more hidden layers, where the learning takes place and (3) an output layer, where the decision or prediction is preformed (Figure 6). Most types of ANNs take several inputs, process them through ‘neurons’ from a single or multiple hidden layer and return the result using an output layer. This result estimation process is known as ‘forward propagation’. The ANN then compares the result with an actual output, assesses the level of error and which neuron weight contributed most to the total error and then adjusts the weights and biases to minimize that error. This step is known as ‘backwards propagation’. The weight and bias adjustment uses the same algorithms as used for parameterization of MM (e.g. Levenberg–Marquardt, full batch gradient descent, stochastic gradient descent and scaled conjugate gradient algorithm).

Figure 6 Single layer artificial neural network (ANN) (perceptron), where X1, X2, X3 represent inputs and W1, W2, and W3 represent weights.
One of the most popular types of ANN is the multi-layer perceptron (MLP) (Rosenblatt, Reference Rosenblatt1958; Aitkin and Foxall, Reference Aitkin and Foxall2003). A MLP contains multiple ‘hidden layer’ nodes between the input and the output layers of the ANN (Figure 7). In this type of model, all layers are fully connected – every node in a layer is connected to every node in the previous and following layer (except the input and output layers). Models with multiple hidden processing layers are referred to as deep ANNs or ‘deep learning’ (DL) models. These models can, like any ANN, be either supervised, partially supervised or unsupervised (e.g. where the ‘feature’ or node extraction is performed by the model itself).
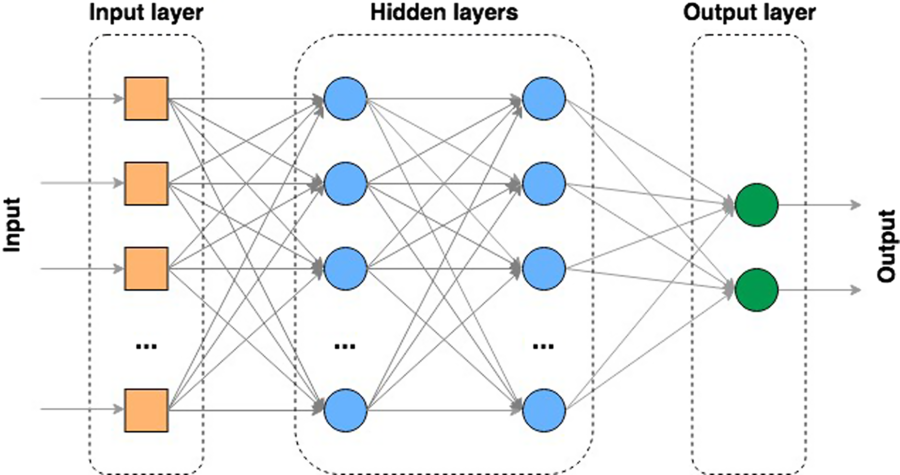
Figure 7 Multi-layer artificial neural network (ANN).
Dimensionality reduction (unsupervised machine learning)
With the advent of advanced computing techniques, high-throughput data collection hardware (sensors) and increasingly faster hardware platforms, large and complex data sets are generated that may include thousands of ‘features’ or variables. The increase in the dimensionality of the data requires an exponential increase in the number of observations if all possible combinations of feature values are to be included. This is almost impossible to achieve in practice, and the number of data features (p) is generally significantly larger than the number of observations (n). A typical example of the problem appears in genome-wide association studies where the number of variables is in the tens of thousands (e.g. 50 K genotyping arrays), while the number of observations is at least one order of magnitude lower. Two related but distinct approaches are applied when such situations occur in practice: feature selection and feature engineering. Feature selection focuses on the selection of relevant features to be used in modelling the data. The relevance is established using statistical (e.g. select high variance variables) or other data-focused techniques and criteria. Feature engineering focuses on the generation of new features from existing features, by applying various linear (e.g. PCA, linear discriminant analysis and factor analysis) or non-linear (e.g. multi-dimensional scaling, isometric feature mapping and spectral embedding) transformations and operations on them.
As a common example, in a PCA analysis, a set of observations of ‘possibly’ correlated variables are orthogonally transformed into a set of linearly uncorrelated variables called ‘principal components’. The first principal component accounts for the largest proportion of outcome variance, and each succeeding component in turn has the highest variance possible with the constraint that it is orthogonal to the preceding component. The resulting vectors are each a linear combination of the original variables which are uncorrelated. Similar to an ANN, the objective of these models are to account for as much variation as possible, but interpretation of the ‘meaning’ of the underlying structure is difficult.
Niche for data-driven models
Machine learning methods have been shown to help solve multidimensional problems with complex structures in the pharmaceutical industry and medicine, as well as in other fields (LeCun et al., Reference LeCun, Bengio and Hinton2015). In this respect, they represent a very powerful data synthesis technique. Similarly, Liakos et al. (Reference Liakos, Busato, Moshou, Pearson and Bochtis2018) found in a review that within the agriculture sector, papers using ML approaches largely focused on disease detection and crop yield prediction. The authors reflected that the high uptake in the cropping sector likely reflects the data intense nature of crop production and the extensive use of imaging (spectral, hyperspectral, near-IR, etc.). Based on a review of the available literature, currently the application ‘niche’ occupied by ML/big data models in animal production revolve around problems that fall into the following categories:
(i) Classification (supervised) or clustering (unsupervised) problems, where the model will group data based on common characteristics (features),
(ii) Prediction problems, where the models ‘learn’ a function (not necessarily mathematical) that best describes (fits) the data or
(iii) Dimensionality reduction problems, where the model will select a subset of features that best represent the data.
However, the categories mentioned above are really ‘methodologies’ rather than niches and might be further generalized within the animal production setting therefore as ‘pattern recognition’ (encompassing classification and clustering) and ‘predictive ability’.
Pattern recognition
Broadly, DD methodologies demonstrate strength interpreting various types of novel data streams (e.g. audio, video and image) to cluster, classify or predict based on supervised or unsupervised approaches and mapping of patterns within the data. Within animal production, this has most notably been applied to animal monitoring and disease detection.
For example, a series of sensor types, with ML models behind them to interpret and classify the data, have been developed for use in practice to monitor changes in animal behaviour (which may signify a change in health status, injury or heat) or are used for animal identification. Numerous publications have shown the ability of sensors to classify animal behaviour (grazing, ruminating, resting, walking, etc.), for example, via 3-axis accelerometers and magnetometers (Dutta et al., Reference Dutta, Smith, Rawnsley, Bishop-Hurley, Hills, Timms and Henry2015), optical sensors (Pegorini et al., Reference Pegorini, Zen Karam, Pitta, Cardoso, da Silva, Kalinowski, Ribeiro, Bertotti and Assmann2015) or depth video cameras (Matthews et al., Reference Matthews, Miller, PlÖtz and Kyriazakis2017), along with ML models to classify the collected data. As continuous human observation of livestock to the extent that a subtle change in behaviour could be observed and early intervention applied is often impractical, the niche for automated monitoring systems to track animal movement and behaviour has formed.
As well, several other examples of how big data and ML has been applied to the task of early disease detection can be found in the literature. Several researchers have developed ANN models, which analyse poultry vocalizations in order to detect changes and identify suspected disease status earlier than conventionally possible. For example, Sadeghi et al. (Reference Sadeghi, Banakar, Khazaee and Soleimani2015) recorded broiler vocalizations in healthy and Clostridium perfringens infected birds. The authors identified five features (clusters of data) using an ANN model, which showed strong separation between healthy and infected birds and were able to differentiate between healthy and infected birds with an accuracy of 66.6% on day 2 and 100% on day 8 after infection. Similar to vocalization, infection may lead to detectable differences in movement patterns (Colles et al., Reference Colles, Cain, Nickson, Smith, Roberts, Maiden, Lunn and Dawkins2016; optical flow analysis) and the surface temperature of animals (Jaddoa et al., Reference Jaddoa, Al-Jumeily, Gonzalez and Cuthbertson2019; IR thermal imaging), leading to earlier diagnosis of disease outbreak.
Predictive abilities
Data-driven methodologies have also found a niche in forecasting and predicting, for example, numerical outcomes due to their strong fitting abilities and ability to map even minute levels of variation (e.g. within an ANN). As such, within animal production systems they are well situated to forecast performance metrics of economic importance such as BW, egg production or milk yield. Alonso et al. (Reference Alonso, Villa and Bahamonde2015) used a support vector machine classification model to forecast the BW of individual cattle, provided the past evolution of the herd BW is known. This approach outperformed individual regressions created for each animal in particular when there were only a few BW measures available and when accurate predictions more than 100 days away were required. Pomar and Remus (Reference Pomar and Remus2019) and Parsons et al. (Reference Parsons, Green, Schofield and Whittemore2007) as well as White et al. (Reference White, Schofield, Green, Parsons and Whittemore2004) proposed the use of a visual image analysis system to monitor BW in growing pigs from which they could determine appropriate feed allocations.
Approach limitations: machine learning
Over-fitting
A significant limitation with ML/big data model training is their tendency to over-train, where the ML model learns the ‘noise’ within the training data which leads to poor generalization capacity (the ability to make predictions on ‘new’ data sets) (Basheer and Hajmeer, Reference Basheer and Hajmeer2000). To overcome this problem, the ‘gold standard’ is that the development process should include (1) a training data set, (2) an internal cross-validation data set and (3) a testing (external) data set. Within an ANN, the number of hidden layers is critical for adequate prediction but must be limited to deter the ANN from learning such background ‘noise’ – however, the number of hidden layers is typically chosen by trial and error by the developer.
Data volume requirements
As with all models, with DD models one must be cautious of biases introduced via skewed training data (e.g. to favour other characteristics, such as chicken age or background noise, Astill et al., Reference Astill, Dara, Fraser and Sharif2018). Data-driven models are data-hungry, requiring large data sets for training and evaluation purposes to rule out biases, noise and data imbalance. Ideally, these large data sets would also have a large variability, covering as many foreseeable scenarios as possible (Kamilaris and Prenafeta-Boldu, Reference Kamilaris and Prenafeta-Boldu2018).
Lack of transparency
Perhaps the most serious criticism of most ML models as they are applied to big data is the lack of transparency in the rationale behind each prediction. Although the means to obtain the prediction are known, via the algorithm used, the features responsible for causing the prediction, even from a mathematical point of view, are not always discernible (Knight, Reference Knight2017). In this respect, the model represents a ‘black box’. To deal with this interpretability problem, several methods have been developed to show how ANNs build up their understanding (see ‘explainable AI’, e.g. Samek et al. Reference Samek, Wiegand and Müller2017). Examples of these include ‘feature visualization’ (e.g. see Olah, Reference Olah2017), ‘style transfer’ (e.g. Gatys et al., Reference Gatys, Ecker and Bethge2016) and inserting ‘attention mechanisms’ into the ANN to track what it focuses on (e.g. Ilse et al., Reference Ilse, Tomczak and Welling2018). To gain knowledge from the information generated (according to the Ackoff (Reference Ackoff1989) pyramid), it is likely that these visualization methods will need to be widely adopted.
Potential overlap and synergies between approaches
Tedeschi (Reference Tedeschi2019) proposed that modelling may be entering a second era of growth like the one experienced in the 1950s, the former being caused by the fourth industrial revolution. The slow but apparent move towards a ‘smart industry’ in which the Internet of Things and robotics track and trace everything that is going on in a farm provides a second ‘boost’ to the application of mathematical modelling of all types in agriculture.
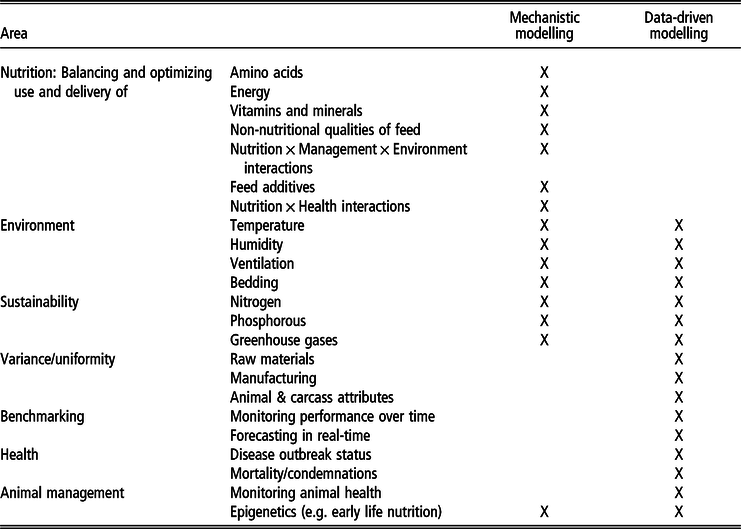
Table 1 summarizes the potential niche areas (by topic, according to the niches identified above) and relative (application) strengths of the two approaches. Some of this niche differentiation is based on the data type – for example, within the realm of image, video and sound interpretation, DD/ML models can turn data into information via pattern recognition, whereas MMs cannot. At the other extreme, MMs are much more equipped to simulate what is ‘likely’ to happen in a situation not previously seen in practice. (A DD model could not do so – predictions are based on what it has been previously trained on.) However, the strength of this niche differentiation is further dependent on the digital maturity of the environment, as not all production systems globally will automate their data, and animal production might remain rather manual in some markets. This distinction creates another niche division between the approaches where both remain and have value.
Table 1 Identified areas of strength for mechanistic modelling and data-driven models, as well as potential overlap
Although the spectrum of digitalization is continuous, it could also be discussed within a categorical hierarchy of increasing digitalization:
1. No digitalization: Simple empirical models may preside, which can address major issues with easily manipulated equations and minimal input data;
2. Manual data pipeline: A MM model with a custom developed front-end may be most suitable;
3. A small digital pipeline with a limited number (1 or 2) of data streams: May enable automatic input population for application of MM models (e.g. see the ‘precision agriculture’ section below);
4. A medium digital pipeline: Would mean combining different data sources with management systems delivering real-time data. Some simulation functions of MM may be replaced by real-time variation. The need for heavy-duty front-end development may be reduced.
5. A fully digitized pipeline: Would enable MM and DD models to run a farm, monitoring the status and automatically implement generated recommendations (e.g. Tesla’s AutoPilot and vertical farming).
Within such a categorical analysis of the spectrum, a complete lack of digitalization (1) might suite the use of a simple model by, for example, a third party consultant, based on rough information provided (from memory or estimation) by the farmer. This scenario is often present in under-developed countries. The development of a manual data pipeline (2) (e.g. measuring and recording of data) allows the development of improved ‘benchmarking’ abilities – and therefore more reliable model predictions from such a simple empirical or MM. With a small continuous digital pipeline (3), continuous optimization and real-time benchmarking (as is being achieved now in precision nutrition for swine, e.g. Pomar et al., Reference Pomar, Pomar, Rivest, Cloutier, Létourneau-Montminy, Andretta, Hauschild, Sakomura, Gous and Kyriazakis2015) becomes possible. It is at this point on the scale of digitalization that things become interesting – for example, if BW is measured automatically, do we forecast BW from a DD model, or do we use the measured BW data as an input to our MM to optimize – for example – ration composition? From this point forward, there also presents a niche for hybridization of the DD and MM approaches, which are further detailed below. A medium-sized digital pipeline (4) would allow real-time optimization of integral parts of the MM engine and combine it with digital data. For example, a ration MM optimized off real-time or DD forecasted intake and BW data and on the side utilizing an ANN on audio/video data to determine, for example, health, activity level or behaviour. A full digital pipeline (5) would allow monitoring and optimization of the entire system. This would allow a MM to be utilized as the basis and optimize/augment with DD learning patterns never envisioned – straight up the ladder of causation (e.g. see Pearl & Mackenzie, Reference Pearl and Mackenzie2018). Similar to vertical farming, it would mean the automated management of a farm. To our knowledge, (5) does not yet exist within animal production systems.
The most likely points for overlap between DD and MM approaches are therefore (1) within a digitalized market and (2) with those models which deal with predicting animal performance and related intermediaries. This is because within this realm, both DD and MM have demonstrated success (‘response prediction’ (MM) and ‘prediction abilities’ (DD)). It might be important to consider again that while we distinguish MM and DD approaches, they already have considerable technical overlap, though they use different terminology. For example, the ‘loss function’ is a residual error term, minimized with both supervised DD fitting methods (e.g. within an ANN) and the parameterization and optimization of MM models. ‘Supervised ML’ models include commonly applied methodologies such as regression techniques, ‘unsupervised ML’ models include the PCA method, applied for decades in animal science. The real difference, as intended to be highlighted in this review, is their application in conjunction with big data and modern computing power. The most appropriate approach may therefore depend largely on the market and the objective of developing and deploying the model. If the objective is forecasting performance for management decision purposes (e.g. what date will a flock of broilers reach market weight, based on their current growth?), then DD approaches may be most appropriate, with their powerful fitting and forecasting abilities (given enough historical data). If the objective is to manipulate the system (e.g. nutritional formulation), problem solve and troubleshoot, or ‘increase knowledge’ (academic, ‘why’ and ‘how’ do things work as they do?) then likely the cumulative biological knowledge present in MM, perhaps hybridized with DD, will yield the most information to the user. While some argue that DD/‘big data’ can, and will, occupy this niche of ‘opportunity analysis’ and ‘decision support’ occupied by MM, the data science field has yet to achieve success in this area. It will likely be considerable time until (1) the required level of digitalization is achieved in animal production systems and (2) a DD can use that data to inform causality (Pearl & Mackenzie, Reference Pearl and Mackenzie2018).
Whereas each core approach (MM and DD) has its fundamental limitations, a potential hybridization (as suggested around step (3) in the degrees of digitalization of a market) may enable a solution that has more to offer than the sum of its parts. In fact, such hybridizations are already being developed, largely within the realm of ‘precision agriculture’ (discussed further in the sections below). By integrating the causal pathways of MM models with the more advanced and more widely deployable learning algorithms of DD models, hybrids could model the entirety of variables that play a role in both the animal and the farm, increasing both knowledge and wisdom generation. The following section will go further to propose additional routes by which these two fields may be joined along the pathway to full digitalization in the near future.
Data-driven models may serve as inputs to mechanistic models
A mainstream criticism of MMs has always revolved around the type, amount and difficulty of obtaining accurate inputs and outputs. With the big data wave and increased prevalence of sensor data, this will become more manageable. Extensive feed characterization is increasingly available via rapid technologies (e.g. Foskolos et al., Reference Foskolos, Calsamiglia, Chrenková, Weisbjerg and Albanell2015), in-pen/walk-over weigh scales allow frequent weight data collection (e.g. Dickinson et al., Reference Dickinson, Morton, Beggs, Anderson, Pyman, Mansell and Blackwood2013), wearable accelerometers allow monitoring of feeding activity and animal behaviour (Borchers et al., Reference Borchers, Chang, Tsai, Wadsworth and Bewley2016), environmental sensors allow real-time collection of environmental data (temperature, humidity and air quality) and several biosensors even allow monitoring of internal conditions (Neethirajan et al., Reference Neethirajan, Tuteja, Huang and Kelton2017). A notoriously difficult area of prediction, particularly in ruminants, remains dry matter intake (DMI) (e.g. Halachmi et al., Reference Halachmi, Edan, Moallem and Maltz2004). At the simplest level, the ability to get reasonable estimates or actual values of DMI in non-controlled conditions has incredible value to the development, use and application of MMs. To the modeller aiming to understand biology (and thus how it can be harnessed for a desired outcome), the big data wave represents a new era in data resolution.
The requirement for interaction between MM and true ‘big data’ will be that (1) MMs will need to be deployed in cloud-based data pipelines, (2) the time-step of the data will have to be aligned with the time-step of the MM (or vice versa) – either the data significantly simplified or the time-step considered within MM reduced to model changes within day, (3) the reliability and error around sensor data pre-interpreted by ML need to be known (e.g. body fat estimation from cameras) and (4) MMs may have to prepare (and innovate) for different data types (e.g. behaviour data).
This interaction between big data and MM has, in fact, already been accomplished and demonstrated most notably in swine, where precision feeding systems utilize sensor data and iterate with a MM to determine the optimal blend of two contrasting feeds for individual animals. For example, Pomar et al., (Reference Pomar, Pomar, Rivest, Cloutier, Létourneau-Montminy, Andretta, Hauschild, Sakomura, Gous and Kyriazakis2015) and Parsons et al., (Reference Parsons, Green, Schofield and Whittemore2007) describe a precision feeding system for swine, whereby a model with both mechanistic and empirical components (where empirical may be classified as a DD approach such as regression) is provided with real-time BW and feed intake data from the barn. Within this framework, an empirical model uses up-to-date data for each pig to estimate daily starting estimates for BW, feed intake and daily gain. These forecasted values are then entered into the MM to estimate standardized ileal digestible lysine and other amino acid requirements, as well as the optimal concentration of these nutrients in the feed for the day. Based on the model-forecasted nutrient requirements, animals are individually fed a blend of two feeds targeted to their optimized requirement.
Precision agriculture aims to deliver nutrients proportional to each individual’s need in order to improve nutrient utilization, efficiency of production, uniformity and to reduce the impact of farming on the environment (Bongiovanni and Lowenberg-Deboer, Reference Bongiovanni and Lowenberg-Deboer2004; Pomar and Remus, Reference Pomar and Remus2019), and thus has benefited hugely from the introduction of real-time monitoring and sensor technologies. The general requirements as outlined by Pomar et al. (Reference Pomar, Pomar, Rivest, Cloutier, Létourneau-Montminy, Andretta, Hauschild, Sakomura, Gous and Kyriazakis2015) are (1) the ability to precisely and rapidly evaluate the nutritional potential of feed ingredients; (2) real-time determination of individual animal or group nutrient requirements (via a MM); (3) the ability to formulate balanced diets which limit the amount of excess nutrients and (4) the concomitant adjustment of dietary nutrient supply to match the requirements of individual animals within the group. In order to feed animals individually, individual monitoring of at least BW (in-pen weigh scales or visual image analysis) or milk production (depending on species) and daily feed intake (via animal identification tags and individual feeders) is required and there must be equipment in place to allow targeted nutrient delivery to individual animals.
What may not have been attempted yet is the integration of other ML-interpreted big data, such as health and reproductive status, activity (energy budget) and environment, which may account further for between-animal or between-farm differences in performance.
Mechanistic models may serve as inputs to data-driven models
Another way that the fields could hybridize might include using the outcomes from a MM as a potential input ‘node’ value for a DD, for example, an ANN. In this way, some ‘biological common sense’ might be supplied to the ANN, potentially useful for decision-making support. Considerations would revolve around careful specification of the range of additional inputs considered to avoid over-parameterization, collinearity and variables serving as inputs to the MM and also as inputs to the ANN directly. Particularly for topics problematic to MM prediction, this might represent an innovative approach to explore.
Another example might be in modelling supply chain dynamics. This is an example of an area where ML models may be successfully applied at the highest level to assist decision making within animal production systems (Stefanovic & Milosevic, Reference Stefanovic and Milosevic2017). Such supply chain models may be valuable for (in particular) integrators, with complex logistical considerations and fluctuating market demands, whereby a larger ML model framework may forecast market changes and the resulting financial impact, and suggest course corrective action ‘now’ to augment negative impacts in the future. An imbedded or ‘consulted’ MM may be able to suggest farm-level changes to augment outcomes, reduce variability or reduce loss. In this way, for the integrator of the future, MMs may provide ‘optimization’ capabilities within large decision management platforms (e.g. when to slaughter, which farms to invest on for improvements, diet modifications to hit targets/mitigate losses, etc.).
Mechanistic models used to interpret big ‘omics’ data
There is a plethora of ‘omics’ data currently being generated but with minimal biological interpretation of their meaning (data translated into information) (Crow et al., Reference Crow, Lim, Ballouz, Pavlidis and Gillis2019; Misra et al., Reference Misra, Langefeld, Olivier and Cox2018). Crow et al. (Reference Crow, Lim, Ballouz, Pavlidis and Gillis2019) examined the predictability of differential gene expression and found that the same sets of genes keep coming up as differentially expressed in experiments, regardless of the treatment applied. In trials that examine the rumen microbiome, we have little knowledge of whether these microbial differences have actual implications for the animal (efficiency, CH4 and milk FA profile). In these areas, omics data analysis may benefit from teaming with MMs, to move towards interpretation of the generated big data. Such MMs might also be able to inform omics pathway analysis via, for example, metabolic control analysis (sensitivity analysis on a real system, as opposed to a simulated one), where control points in a pathway could be identified from differential gene expression data. Academically, MMs may serve as a bridge between quantitative and qualitative analysis, such as this.
Full integration of mechanistic model code with machine learning fitting
As we move towards ‘precision agriculture’ across species, one must ask whether that includes the ability to manipulate and optimize the system or simply have accurate real-time information and the ability to forecast. If the former, there will be the need for biological models, with the cumulative knowledge about how a system works, to be fully integrated with the ML models’ ability to make accurate predictions on individual animals. One possible way to achieve this, may be individual parameterization of MMs, via integrating backwards propagation techniques applied within ANNs (for example) into a MM, while placing biological confidence limits around MM parameters permitted to vary between animals to prevent extending beyond biologically sensible values. Knowledge of the biological uncertainty, and setting bounds to limit purely empirical fitting of the model, may be critical to keep the integrity of the MM. Pomar and Remus (Reference Pomar and Remus2019) propose a real-time closed feedback system to determine nutrient requirements and subsequent feed intakes for individual pigs by combining both MM and ML.
The true challenge to widespread adoption of precision feeding in animal production is likely financial and logistical – requiring a substantial investment in the facility re-design and technology upgrade. Not until the ROI can be demonstrated, logistical barriers overcome and trust in the system is developed (there is much at stake within animal production if things go wrong) (Cartwright, 2016), is precision feeding likely to be taken up by the industry as a solution for the future.
A diagrammatic of how this integration might generate value is presented in Figure 8. Figure 8 summarizes the flow from a problem statement to data to information to knowledge to wisdom (as illustrated in the data-information-knowledge-wisdom pyramid of Ackoff, Reference Ackoff1989) and how MM and ML may assist at different steps of that flow. In general, the ML/big data methods may independently only get us so far as the translation of data into information (perhaps up until knowledge – e.g. disease detection). The MM methods translate knowledge into wisdom but may lack sufficient information. Their integration would seemingly benefit both realms on the path to explainable AI.

Figure 8 Full integration of mechanistic and data-driven models in the translation of data → information → knowledge → wisdom (where MM = mechanistic modelling, ML = machine learning modelling, dotted lines are feedback loops). Research may generate both data (1) and knowledge (3). ‘Big data’ interpreted by ML may generate information (2), which in itself may be used for decision making but relies on correlation (thereby lacking knowledge or wisdom). Within this framework, MMs may be seen as where biological knowledge is accumulated (3), and these may on their own be used to derive wisdom (4) – though they often lack sufficient driving information. Hybridization of ML and MM (*) may close the loop between prediction accuracy/precision and causality.
Summary
This paper illustrates a niche for both MM and ML modelling approaches within animal production based on (1) the way in which we use models and (2) a varying degree of global digitalization, but that substantial opportunity also exists to expand the utilization and interpretation of data by hybridizing these approaches. Hybridization has already been initiated within the precision feeding sector but may be expanded to address other issues including those reviewed in this paper, thereby moving the data science field closer to ‘explainable AI’. Elshawi et al. (Reference Elshawi, Maher and Sakr2019) comment that current ML models are not yet providing the end-user with any ‘smartness’ in the decision-making process. Ching et al. (Reference Ching, Himmelstein, Beaulieu-Jones, Kalinin, Do, Way, Ferrero, Agapow, Zietz, Hoffman, Xie, Rosen, Lengerich, Israeli, Lanchantin, Woloszynek, Carpenter, Shrikumar, Xu, Cofer, Lavender, Turaga, Alexandari, Lu, Harris, DeCaprio, Qi, Kundaje, Peng, Wiley, Segler, Boca, Swamidass, Huang, Gitter and Greene2018) observe that understanding how users should interpret models to make testable hypotheses about the ML model remains an ‘open challenge’. Therefore, we see a distinct niche for the hybridization of approaches (predictive strength meets causality) in the near future.
Second, what might also be evident now is that at their core, MM and supervised ML models use many of the same methodologies (e.g. model parameterization and optimization algorithms), though they may use them differently and apply different terminology. Many DD methodologies are also decades old – but modern computing power and new data streams have revolutionized their use.
Lastly, the expansion to utilize new methodologies and hybridization of approaches between MM and DD will require that the next generation of animal science modellers is provided with a revised toolbox, such that they can utilize the emerging suite of DD modelling methodologies available to them. To address this, universities must (1) adapt course content to include training animal scientists in new and advanced DD methodologies (Xu and Rhee, Reference Xu and Rhee2014), (2) collaborate between departments to bridge the gap between data science and animal science and advocate for multidisciplinary teams or (3) accept passage of the baton to data scientists. The last option may limit the current level of integration of modelling with experimental research and the resulting advancement of knowledge we obtain via this collaboration.
Acknowledgements
This study was enabled in part by support from the Canada First Research Excellence Fund to the ‘Food from Thought’ research program at the University of Guelph. We would also like to thank the reviewers for their support and suggestions to improve this manuscript. Primary results from this paper were previously published in abstract form (Ellis et al., Reference Ellis, Jacobs, Dijkstra, van Laar, Cant, Tulpan and Ferguson2019).
J. L. Ellis 0000-0003-0641-9622
J. Dijkstra 0000-0003-3728-6885
Declaration of interest
The authors declare that there are no conflicts of interest.
Ethics statement
Not applicable.
Software and data repository resources
No data or models were deposited in an official repository.


