


Faults and fractures originate from strains that arise from stress concentrations around flaws, heterogeneities and physical discontinuities, on scales from the microscopic to continental, in response to lithostatic, tectonic and thermal stresses and high fluid pressures (National Research Council, 1996). Faults and fractures that affect rock strength and the mechanical behaviour of rock units, provide both flow-paths and barriers for fluids and often form the host for economic mineralization, are amongst the most important of geological structures (Gillespie et al., Reference Gillespie, Barnes and Milodowski2011).
For many years, the dating of brittle near-surface faults was commonly achieved by indirect geological deduction (Lyons & Snellenberg, Reference Lyons and Snellenberg1971). However, reactive surfaces created by movement within these localized zones led to the retrogressive development of fault gouges composed of rock fragments and authigenic phyllosilicates (Bense et al., Reference Bense, Wemmer, Löbens and Siegesmund2014). The most recent fault activity is revealed by mineralogical and isotopic investigations of the finest particle size fractions of these fault gouges in the fault core (Kralik et al., Reference Kralik, Klima and Riedmueller1987). The commonly illitic composition of the gouge phyllosilicates lends itself to age determination using radiogenic 40K–40Ar or, following microencapsulation, 40Ar–39Ar geochronometers (Foland et al., Reference Foland, Hubacher and Arehart1992).
The importance of understanding basin thermal history in the hydrocarbon industry led to the development of the seminal Illite Age Analysis (IAA) technique (Pevear, Reference Pevear, Kharaka and Maest1992; Vrolijk et al., Reference Vrolijk, Pevear, Covey and LaRiviere2018) and its further application to fault dating to estimate hydrocarbon trap timing and with the potential for evaluating earthquake hazards (Pevear, Reference Pevear, Kharaka and Maest1992).
A plethora of fault-dating studies have since been published (e.g. Vrolijk & van der Pluijm, Reference Vrolijk and van der Pluijm1999; Ylagan et al., Reference Ylagan, Kim, Pevear and Vrolijk2002; Solum & van der Pluijm, Reference Solum and van der Pluijm2005, Reference Solum and van der Pluijm2007; van der Pluijm et al., Reference van der Pluijm, Vrolijk, Pevear, Hall and Solum2006; Mänttärri et al., Reference Mänttärri, Mattila, Zwingmann and Todd2007; Haines & van der Pluijm, Reference Haines and van der Pluijm2008; Schleicher et al., Reference Schleicher, van der Pluijm and Warr2010; Zwingmann et al., Reference Zwingmann, Mancktelow, Antognini and Lucchini2010, Reference Zwingmann, Han and Ree2011; Duvall et al., Reference Duvall, Clark, van der Pluijm and Li2011; Rahl et al., Reference Rahl, Haines and van der Pluijm2011; Verdel et al., Reference Verdel, Niemi and van der Pluijm2011; Pleuger et al., Reference Pleuger, Mancktelow, Zwingmann and Manser2012; Donohue, Reference Donohue2013; Hetzel et al., Reference Hetzel, Zwingmann, Mulch, Gessner, Akal, Hampel, Güngör, Petschick, Mikes and Wedin2013; Viola et al., Reference Viola, Zwingmann, Mattila and Käpyaho2013, Reference Viola, Scheiber, Fredin, Zwingmann, Margreth and Knies2016; Yamasaki et al., Reference Yamasaki, Zwingmann, Yamada, Tagami and Umeda2013; Bense et al., Reference Bense, Wemmer, Löbens and Siegesmund2014; Song et al., Reference Song, Chung, Choi, Kang, Park, Itaya and Yi2014; Garduño-Martinez et al., Reference Garduño-Martínez, Puig, Sole, Martini and Alcalá-Martínez2015; Mancktelow et al., Reference Mancktelow, Zwingmann, Campani, Fugenschuh and Mulch2015, Reference Mancktelow, Zwingmann and Mulch2016; Abd Elmola et al., Reference Abd Elmola, Buatier, Monie, Labaume, Trap and Charpentier2018) to determine tectonic and deformation history in a wide range of geological settings.
The Sronlairig Fault, some 82 km in length, is one of an array of regional-scale, steeply dipping, NE–SW trending, sinistral strike-slip fault structures that transect the Caledonian Grampian Terrane in the Central Highlands of Scotland (Fig. 1a). The well-studied GGFZ is known to have experienced a protracted history of movement, responding to changing stress regimes from the Caledonian (Ordovician–Silurian) throughout the Late Paleozoic to Mesozoic development of the Moray Firth region, and continuing into the Paleogene.
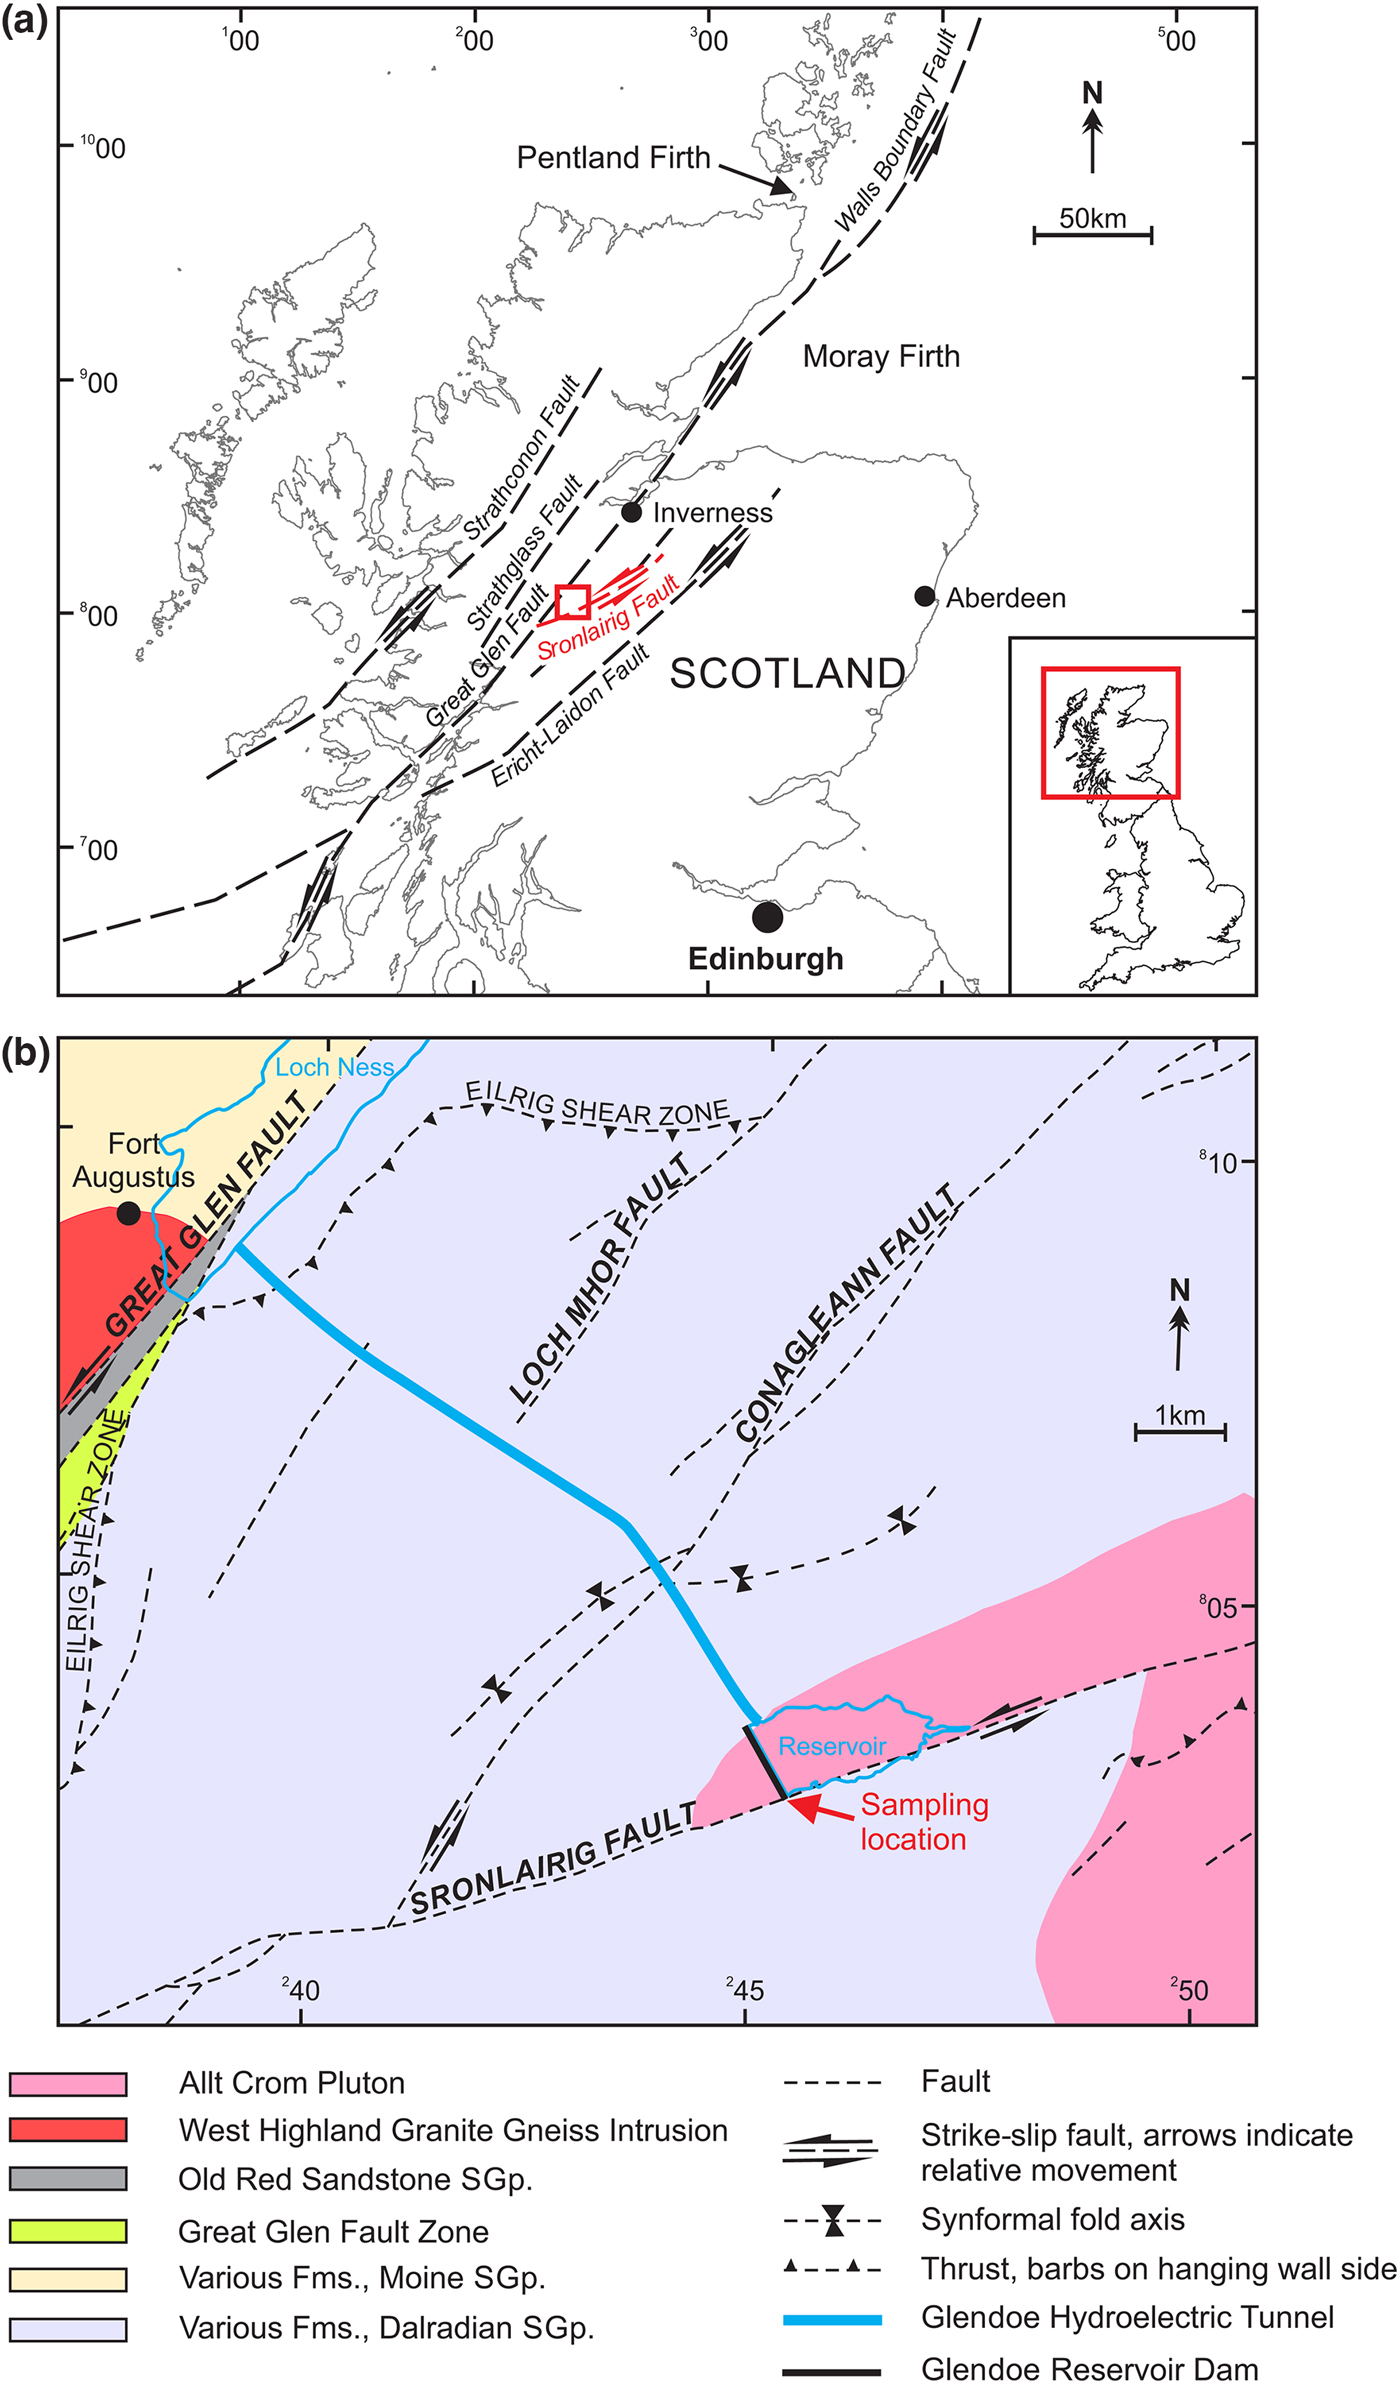
Fig. 1. (a) The location of the Sronlairig Fault in relation to other late Caledonian strike-slip faults in Scotland. The small red box shown in the main map indicates the extent of (b). (b) Geological map showing the trace of the Sronlairig Fault, the sampling location and the Glendoe hydroelectric scheme. Fms = Formations; SGp = Supergroup.
In detail, following on from the dominant sinistral strike-slip regime during the Caledonian (Dewey & Strachan, Reference Dewey and Strachan2003; Mendum & Noble, Reference Mendum and Noble2010), the GGFZ is known to have experienced: extension during the Devonian (Séranne, Reference Séranne1992); dextral displacement in the latest Carboniferous to Early Permian (Speight & Mitchell, Reference Speight and Mitchell1979); transtensional opening and expansion across the Moray Firth–Pentland Firth region from the Permian and through the Mesozoic (Underhill, Reference Underhill1991; Underhill & Brodie, Reference Underhill and Brodie1993); and dextral oblique wrench in the Paleocene–Eocene as Atlantic Ocean opening progressed (Holgate, Reference Holgate1969; Watts et al., Reference Watts, Holdsworth, Sleight, Strachan and Smith2007).
In the Glen Roy District of the Central Highlands, the Sronlairig Fault splays off the GGFZ and is indicated as a simple fault plane trending NE–SW (British Geological Survey, 1995). Northwards, throughout the Strathdearn area, the Sronlairig Fault then appears as a more complex zone of faulting with associated subparallel faults and minor splays cutting granitic intrusions to form wide zones of brecciation and shearing (British Geological Survey, 2004). Further north in the Nairn district, it is shown on published geological maps as twin fault structures trending NNE–SSW, locally constraining small grabens filled with Middle Devonian conglomerate (British Geological Survey, 2012).
The history of displacement on the Sronlairig Fault is poorly constrained. In the southwestern part of the Grampian terrain around Glendoe, folds and shear zones that affect the Caledonian metamorphic rocks are cut by mylonite and cataclasite fabrics as exposed in Glen Buck and the River Tarff (British Geological Survey, 1995; Key et al., Reference Key, Clarke, May, Phillips, Chacksfield and Peacock1997). The Sronlairig Fault was probably initiated at least in the early part of the Caledonian orogeny, and, as orogenic movements declined, strain generated lesser offsets and displacements along the boundaries of the late Caledonian (Silurian–Devonian) granite plutons that intrude the metasedimentary complex (Haselock & Leslie, Reference Haselock and Leslie1992; British Geological Survey, 1996, 2004). The youngest onshore sedimentary strata affected by the Sronlairig Fault are sandstones of Upper Devonian (Famennian) age (British Geological Survey, 2012). It is not clear if the Sronlairig Fault extends offshore, but faults mapped offshore in the Moray Firth and Pentland Firth later accommodated the geological evolution of the late Paleozoic and Mesozoic basins in that region, in part by reactivating the Caledonian structures (Dewey & Strachan, Reference Dewey and Strachan2003).
Although large faults like the Sronlairig Fault have clearly played an important role in the tectono-sedimentary evolution of parts of onshore and offshore Scotland, they are poorly exposed and the evidence for their younger tectonic history has not been reported onshore. Temporary excavations during dam construction for the Glendoe Hydro Scheme provided a rare opportunity to study the exposed trace of the Sronlairig Fault, as well as an exceptional chance to sample and analyse a non-weathered homogeneous brown/grey clay-rich fault gouge and to use a combination of K–Ar geochronology and X-ray diffraction (XRD) techniques to constrain the timing of post-orogenic movements.
Illite Age Analysis and fault dating
Two different mineral transformations in clay gouges have proved suitable for IAA (Pevear, Reference Pevear1999): the illitization of illite-smectite (I-S) and the neocrystallization of authigenic 1M/1M d illite (Haines & van der Pluijm, Reference Haines and van der Pluijm2008). Mixtures of illite and I-S can be identified and the individual components can be quantified relatively simply using XRD profile modelling programs such as NEWMOD© (Reynolds & Reynolds, Reference Reynolds, Reynolds and Reynolds1996; e.g. Solum & van der Pluijm, Reference Solum and van der Pluijm2005; van der Pluijm et al., Reference van der Pluijm, Vrolijk, Pevear, Hall and Solum2006). Identifying and quantifying mixtures of illite polytypes have proved to be more challenging.
Experimental studies indicate that the 2M 1 polytype is the most stable and is thought to form above 280°C (e.g. Środon & Eberl, Reference Środon and Eberl1984), while the 1M/1M d polytypes are thought to form at significantly lower temperatures, below ~200°C (Velde, Reference Velde1965). The sequence 1M d–1M–2M 1 has been proposed to be indicative of increasing temperature and pressure, with authigenic 2M 1 indicating the onset of the lowest-grade metamorphic zone (the anchizone 280–360°C) (Merriman & Kemp, Reference Merriman and Kemp1996).
Early fault-dating studies of clay gouges considered that the fine-grained fraction of illite (<2 µm) was entirely composed of low-temperature 1M or 1M d authigenic illite, with no detrital (2M 1) illite present (e.g. Lyons & Snellenberg, Reference Lyons and Snellenberg1971; Kralik et al., Reference Kralik, Klima and Riedmueller1987). However, more recent studies have revealed that early illite dating produced erroneously old ages due to the presence of detrital (2M 1) material, even in the very fine particle-size fractions (Pevear, Reference Pevear, Kharaka and Maest1992; Grathoff et al., Reference Grathoff, Moore, Hay and Wemmer2001). The most widely accepted interpretation is that 2M 1 illite in fault rocks is derived from the wall rocks and the 1M (and/or 1M d) component is authigenic material formed in the fault during movement (i.e. synkinematic; e.g. Hower et al., Reference Hower, Hurley, Pinson and Fairbairn1963; Reynolds, Reference Reynolds1963; Grathoff et al., Reference Grathoff, Moore, Hay and Wemmer2001). However, it should be noted that none of the many published fault-dating studies has provided direct evidence that 1M authigenesis is synkinematic. Nevertheless, recent research on Alpine, Scandinavian and Pyrenean faults in mostly high-grade metamorphic terranes consistently describes authigenic 2M 1 illite developing within fault gouges (e.g. Zwingmann et al., Reference Zwingmann, Mancktelow, Antognini and Lucchini2010; Viola et al., Reference Viola, Zwingmann, Mattila and Käpyaho2013, Reference Viola, Scheiber, Fredin, Zwingmann, Margreth and Knies2016; Torgersen et al., Reference Torgersen, Viola, Zwingmann and Henderson2015; Abd Elmola et al., Reference Abd Elmola, Buatier, Monie, Labaume, Trap and Charpentier2018). Because these faults may contain a mixture of wall rock-derived and authigenic 2M 1 illite, age dates obtained for these populations should be regarded as minima.
Research has therefore focused on methods to discriminate and quantify the various illite polytypes. Initial methods involved using peak-area or peak-height measurements for polytype-specific XRD peaks, usually dividing these by the area of the 2.58 Å band that is common to all illite polytypes (e.g. Reynolds, Reference Reynolds1963; Maxwell & Hower, Reference Maxwell and Hower1967; Callière et al., Reference Callière, Henin and Rautureau1982). Later, computer modelling programs such as WILDFIRE© (Reynolds Jr, Reference Reynolds1994) were employed to determine quantitatively the amounts (as percentages) of authigenic and wall rock-derived clay in various size fractions (e.g. Grathoff & Moore, Reference Grathoff and Moore1996; Ylagan et al., Reference Ylagan, Kim, Pevear and Vrolijk2002; Solum & van der Pluijm, Reference Solum and van der Pluijm2005, Reference Solum and van der Pluijm2007; van der Pluijm et al., Reference van der Pluijm, Vrolijk, Pevear, Hall and Solum2006; Haines & van der Pluijm, Reference Haines and van der Pluijm2008).
Once determined, the percentage of wall rock-derived illite in each of the particle-size fractions is plotted against their apparent K–Ar (or 40Ar–39Ar) total gas ages and extrapolated linearly to 0% and 100% in order to find the ages of the ‘end-member’ wall-rock and authigenic illite populations (Pevear, Reference Pevear1999).
The K–Ar dating technique was one of the earliest isotopic methods, and it remains a popular geological technique due to its ease of measurement and ideal half-life (1250 Ma; Kelley, Reference Kelley2002). The later 40Ar–39Ar dating technique offers the advantage that K and Ar are measured simultaneously in the same sample and therefore can be applied to very small and heterogeneous samples (Kelley, Reference Kelley2002). Both the K–Ar and 40Ar–39Ar techniques are based on the decay of naturally occurring K and Ar, but they differ in the way K is measured. In K–Ar dating, K is usually measured using flame photometry, atomic absorption spectroscopy or isotope dilution, while Ar isotope measurements are made by mass spectrometry on a separate subsample. In 40Ar–39Ar dating, K is measured by the transmutation of 39K to 39Ar by neutron bombardment; ages are determined from the ratio of Ar isotopes. While K–Ar dates are absolute, 40Ar–39Ar dates are relative to a mineral standard analysed simultaneously.
Both K–Ar and 40Ar–39Ar dating techniques have been applied to illite fault-dating studies (e.g. van der Pluijm & Hall, Reference van der Pluijm, Hall, Rink and Thompson2015; Zwingmann, Reference Zwingmann, Rink and Thompson2015). However, recoil effects during irradiation result in the loss of up to 30% 39Ar and severely compromise 40Ar–39Ar dating of fine-grained species such as illite. More recent encapsulation methodologies have captured the recoil 39Ar and allow non-standardized corrections for age calculations (Dong et al., Reference Dong, Hall, Peacor and Halliday1995; Clauer et al., Reference Clauer, Zwingmann, Liewig and Wendling2012).
Sample site on the Sronlairig Fault
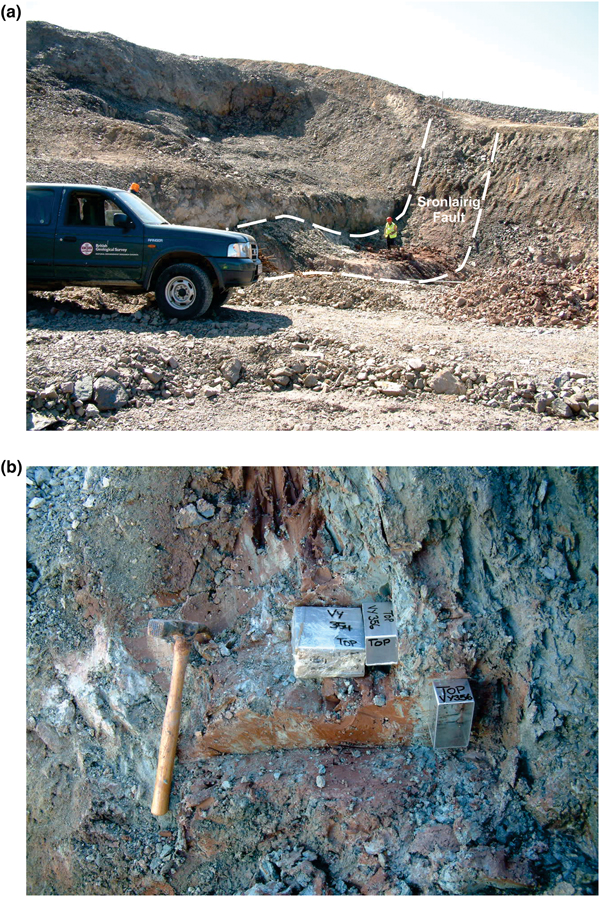
During construction of a dam, forming part of the supporting infrastructure of the Glendoe Hydro Scheme, a 50 m-long section through the Sronlairig Fault was revealed briefly in 2007. At the site (Figs 1b, 2a), the fault juxtaposes granitic rocks of the Allt Crom Pluton (Caledonian Supersuite) against psammitic rocks of the Glen Doe Psammite Formation (Corrieyairack Subgroup/Grampian Group/Dalradian Supergroup). The latter were deposited originally as muds and sands ~650–700 Ma (Key et al., Reference Key, Clarke, May, Phillips, Chacksfield and Peacock1997). The sinistral offset on the Sronlairig Fault, as measured by surface displacement of the pluton contact, is ~2–5 km.

Fig. 2. (a) Sronlairig Fault exposed in the temporary excavations for the Glendoe hydroelectric dam plinth. View is looking to the southwest. (b) Kubiena tin sampling of the Sronlairig Fault gouge. The boundary between the dominantly grey–green and dominantly brown material is aligned ENE (centre-top) to the WSW (lower right-hand corner).
The southern (rear) wall of the temporary exposure revealed fractured psammite with well-defined discrete planar fractures aligned parallel (060°N) to the mapped trace of the Sronlairig Fault. Immediately adjacent (on the NNW side) is a band of greenish–grey to blue cataclasite developed in psammite, which is relatively persistent and ~20–30 cm thick where best developed. This band is separated by a sharp boundary from a band up to 2.5 m wide of clay-rich, brown and greenish–grey fault gouge enclosing fragments of psammitic rock, which is taken to be the fault core (or at least the core of one substantial fault strand within the Sronlairig Fault zone). The fault gouge is malleable and can easily be moulded and shaped by hand. The band of fault gouge pinches and swells along the fault trace, becoming just a few tens of centimetres thick in places (Fig. 2a,b). The rest of the fault zone was not exposed.
Internally, the fault gouge consists of crudely defined, centimetre-scale-thick bands of chocolate brown and grey colour (Fig. 2b). Contacts between the colour bands are sharp and, in general, parallel to the fault strike, but, in detail, can be highly irregular. In other respects, the character of the fault gouge does not vary (when viewed at the outcrop and hand-sample scale). The colour bands are inferred to be due to a redox overprint; the brown banding appears as a local overprint on the grey fault gouge, possibly caused by localized penetration of oxidizing groundwater.
The fault gouge locally preserves clear evidence of a shape fabric in the brown and greenish–grey clay-rich domains, indicating sinistral shear in the lifetime of the fault structure (see below). S–C fabrics are developed in the clay-rich gouge. Representative samples of fault gouge were collected for characterization and dating.
Materials and methods
Samples
Four samples (VY351, 358, 359 and 360) of undisturbed clay-rich gouge for petrographic characterization were carefully collected using Kubiena tins (Kubiena, Reference Kubiena1953). Three of these were collected from the brown fault gouge in mutually orthogonal orientations (Fig. 2b). The fourth was collected to include significant proportions of both grey and brown gouge. The samples, initially wrapped in cling film to minimize drying and shrinking, were slowly impregnated with epoxy resin under vacuum to consolidate the soft fault gouge and preserve delicate structures. A single, large-format (75 mm × 50 mm), polished ‘soil’ thin section was prepared from each.
Two further samples (VY352 and 361) of fault gouge were collected for IAA using large (200 mm × 200 mm × 100 mm) Kubiena tins. These samples, which are from locations ~30 m apart in the same central ‘core’ of the fault gouge, were selected to test the effects of: (1) minor visual variability in fault-gouge character on the sample scale; and (2) more significant visual variability on the outcrop scale.
Petrographic analysis
The thin sections were first examined under plane-polarized light and cross-polarized light conditions using a Zeiss Axioplan 2 polarizing microscope. Following the application of a carbon coating, further examination of the thin sections was undertaken using a LEO 535VP variable-pressure scanning electron microscope (SEM) equipped with an Oxford Instruments INCA Energy 450 energy-dispersive X-ray microanalysis (EDX) system for qualitative phase identification. The sections were analysed under high vacuum with a 15 kV accelerating voltage and a working distance of 19 mm. Photomicrographs were collected under backscatter electron imaging conditions.
• Sample VY352 [245422 802845] consists of chocolate brown (hematite-bearing) fault gouge and is visually clay-rich with variably comminuted/digested rock fragments and wisps and patches of greenish–grey clay, the latter commonly associated with remnant rock fragments. Two subsamples were prepared and analysed: VY352/G1 consists almost entirely (>95%) of chocolate brown fault gouge, while VY352/G2 contains a larger proportion (~10%) of visible rock fragments and grey fault gouge.
• Sample VY361/G1 [245404 802872] consists almost entirely of grey fault gouge, with occasional small, dark green rock fragments and rare wisps of brown (hematite-bearing) gouge.
Illite Age Analysis
Initial sample preparation
Representative subsamples were dried overnight in a moisture extraction oven at 55°C and then hand-crushed in a pestle and mortar to pass a 2 mm sieve. A subsample of the <2 mm crushate was ball-milled, then a portion of each ball-milled sample was micronized following the methodology of Kemp et al. (Reference Kemp, Smith, Wagner, Mounteney, Bell, Milne, Gowing and Pottas2016a). The samples were then spray-dried following the method and apparatus described by Hillier (Reference Hillier1999) and front-loaded into a standard, stainless steel sample holder for analysis.
Nominal <2 µm fractions were isolated from further portions of the <2 mm crushate and oriented mounts prepared using the methodology outlined by Kemp et al. (Reference Kemp, Ellis, Mounteney and Kender2016b).
Further size fractionation
In order to prepare fine-size fractions for K–Ar analysis and age dating, further <2 µm fractions were isolated. However, in order to retrieve all of the fine-grained material, the gravity separation process was repeated until no further particles were visible in suspension.
The dispersed <2 µm fractions were then centrifuged (MSE Blue Force) for a calculated time period and speed (e.g. Hathaway, Reference Hathaway1956) and the <0.2 µm supernatant decanted into a stock beaker. The dispersion and centrifugation process was then repeated three times, adding the decanted <0.2 µm suspension to the stock beaker each time. Finally, the 2.0–0.2 µm sediment was removed from the base of the centrifuge bottles, dried at 55°C and stored. Similar procedures, using a higher-speed Sorvall RC 5B Plus centrifuge, were performed sequentially to produce finer particle-size fractions (0.2–0.1, 0.10–0.05 and <0.05 µm). All fractions were dried at 55°C and stored.
For capillary mount preparation, small quantities (<30 mg) of each size fraction were ground in an agate pestle and mortar to pass a 32 µm sieve cloth. The powdered samples were then loaded into borosilicate glass capillary tubes (80 mm long, external diameter 0.7 mm, wall thickness 0.01 mm) and sealed with a flame. A Capillary Boy (Huber Diffraktionstechnik GmbH & Co.) was employed to accelerate the capillary-filling process. Each capillary was then mounted in a brass collet for XRD analysis.
X-ray diffraction analysis
X-ray diffraction analysis was carried out using a PANalytical X'Pert Pro series diffractometer equipped with a cobalt-target tube and X'Celerator detector and operated at 45 kV and 40 mA. The spray-dried samples were scanned from 4.5 to 85°2θ at 2.06°2θ/min. Diffraction data were initially analysed using PANalytical X'Pert HighScore Plus version 4.1 software coupled to the latest version of the International Centre for Diffraction Data (ICDD) database.
Following identification of mineral species, quantification was achieved using the Rietveld refinement technique (e.g. Snyder & Bish, Reference Snyder, Bish, Bish and Post1989) using PANalytical X'Pert HighScore Plus software. Errors for the quoted mineral concentrations are typically better than ±1% for concentrations >50 wt.%, ±5% for concentrations between 20 and 50 wt.% and ±10% for concentrations <10 wt.% (Kemp et al., Reference Kemp, Smith, Wagner, Mounteney, Bell, Milne, Gowing and Pottas2016a). Where a phase was detected but its concentration was indicated to be below 0.5%, it is assigned a value of <0.5%, as the error associated with quantification at such low levels becomes too large.
The <2.0, 2.0–0.2, 0.2–0.1, 0.10–0.05 and <0.05 µm oriented mounts were scanned from 2 to 40°2θ at 1.02°2θ/min after air-drying, ethylene glycol solvation and heating at 550°C for 2 h. Clay mineral species were then identified from their characteristic peak positions and their reaction to the diagnostic testing program (Moore & Reynolds, Reference Moore and Reynolds1997). Modelling of the <2 µm XRD profiles was carried out using Newmod-for-Windows™ (Reynolds & Reynolds, Reference Reynolds, Reynolds and Reynolds1996) software following the procedure outlined by Kemp et al. (Reference Kemp, Ellis, Mounteney and Kender2016b).
For capillary analysis, the configuration of the diffractometer was altered to convert the diverging X-ray beam into a high-intensity, narrow parallel beam and Kβ radiation was removed using a PANalytical parabolic mirror. Each capillary and brass collet was individually mounted in the goniometer head of the diffractometer and aligned to the X-ray beam using a bespoke microscope attachment. The capillary was rotated at a speed of 5 revolutions/s. To increase the counting statistics obtained from such small amounts of material, extremely slow scans from 5 to 75°2θ were performed at a speed of 0.16°2θ/min.
In order to remove the component of the XRD trace produced by the borosilicate glass capillary, an empty capillary was scanned using the same analytical program and the ‘blank‘ subtracted from each sample trace.
Illite polytypes were identified from their characteristic peak positions, intensities and widths measured using PANalytical X'Pert HighScore Plus version 4.1 software. Peak data were then compared with standard data from the latest version of the ICDD database, publications (e.g. Dalla Torre et al., Reference Dalla Torre, Stern and Frey1994; Grathoff & Moore, Reference Grathoff and Moore1996; Haines & van der Pluijm, Reference Haines and van der Pluijm2008) and modelled profiles obtained from the WILDFIRE© software package (Reynolds Jr, Reference Reynolds1994). No attempt was made to differentiate between mica/illite 1M and 1M d polytypes in this study.
K–Ar analysis
The K–Ar dating technique followed standard methods described in detail by Dalrymple & Lanphere (Reference Dalrymple and Lanphere1969). K content was determined by atomic absorption with a pooled error of duplicate K determinations (on several samples and standards) better than 2.0%. Ar isotopic measurements were based on a procedure described by Bonhomme et al. (Reference Bonhomme, Thuizat, Pinault, Clauer, Wendling and Winkler1975). Clay fraction sample portions were preheated under vacuum at 80°C for several hours to reduce the amount of atmospheric Ar adsorbed onto the mineral surfaces during sample preparation. Blanks for the mass spectrometer and extraction line were systematically determined and the mass discrimination factor was determined by airshots (small amounts of air for 40Ar/36Ar ratio measurement). Approximately 10 mg of sample material was required for Ar analyses. Special care was taken in the preparation of both K and Ar sample portions due to the hygroscopic nature of clays. For Ar analysis by noble gas spectrometry, sample portions were loaded onto clean Mo foil (Goodfellow molybdenum foil, thickness 0.0125 mm, purity 99.9%), weighed and subsequently preheated to 80°C overnight to remove moisture, and reweighed using a Mettler AT20 balance. The measured dry weight was used in the K–Ar age calculation. Samples were stored prior to loading into the Ar purification line in a desiccator. During the analysis, seven international standards (3 HD-B1, 3 LP6 and 1 GLO) were measured. The error for Ar analyses was below 1.00% and the 40Ar/36Ar value for airshots averaged 295.46 ± 0.37 (n = 4) (Tables 1, 2). The K–Ar ages were calculated using the 40K abundance and decay constants recommended by Steiger & Jäger (Reference Steiger and Jäger1977). The age uncertainties take into account the errors during sample weighing, 38Ar/36Ar and 40Ar/38Ar measurements and K determination. The reported errors for K–Ar age values represent 2σ uncertainty. Ages are stated according to the stratigraphical timescale of Gradstein et al. (Reference Gradstein, Ogg and Smith2004).
Table 1. K–Ar standards data. Standard error to references GLO (Odin et al., Reference Odin and Odin1982). HD-B1 (Hess & Lippolt, Reference Hess, Lippolt and Odin1994) and LP6 (Odin et al., Reference Odin and Odin1982).
Table 2. Airshot data.
Results
Petrographic analysis
The three mutually orthogonal thin sections show a dense, brown (hematite-bearing), cryptocrystalline ‘clay’ matrix enclosing scattered 100 μm- to centimetre-scale porphyroclasts of quartz and lithic fragments (Fig. 3a). The lithic fragments, which are probably derived from both granitic and psammitic protoliths, are hematized to varying degrees (Fig. 3a). Some of the fragments consist of cataclastic fault rock (clasts in a matrix), with a fabric of brittle–ductile character (at the 100 µm–cm scale) that can be markedly discordant with that in the enclosing fault gouge. The deformation within these fragments clearly predates the deformation that produced the enclosing clay-rich matrix, but it is not clear if it occurred during an earlier episode of fault displacement or earlier in the same episode that produced the enveloping clay-rich gouge. One thin section, cut vertically and normal to the fault plane, shows a strong foliation dipping ~70⁰ towards SSE, with subtle kinematic indicators (e.g. mantled porphyroclasts) suggesting a possible reverse sense of movement (SSE side up) in the lifetime of the fault structure (Fig. 3a). A second thin section, cut vertically and parallel to the fault plane, is essentially isotropic (lacking a foliation). The third, cut horizontally, shows a relatively weak ENE–WSW-trending foliation with a sinistral sense of displacement (developed at some point in the lifetime of the fault structure) and both sliding and rotation of objects/domains in the shear fabric.
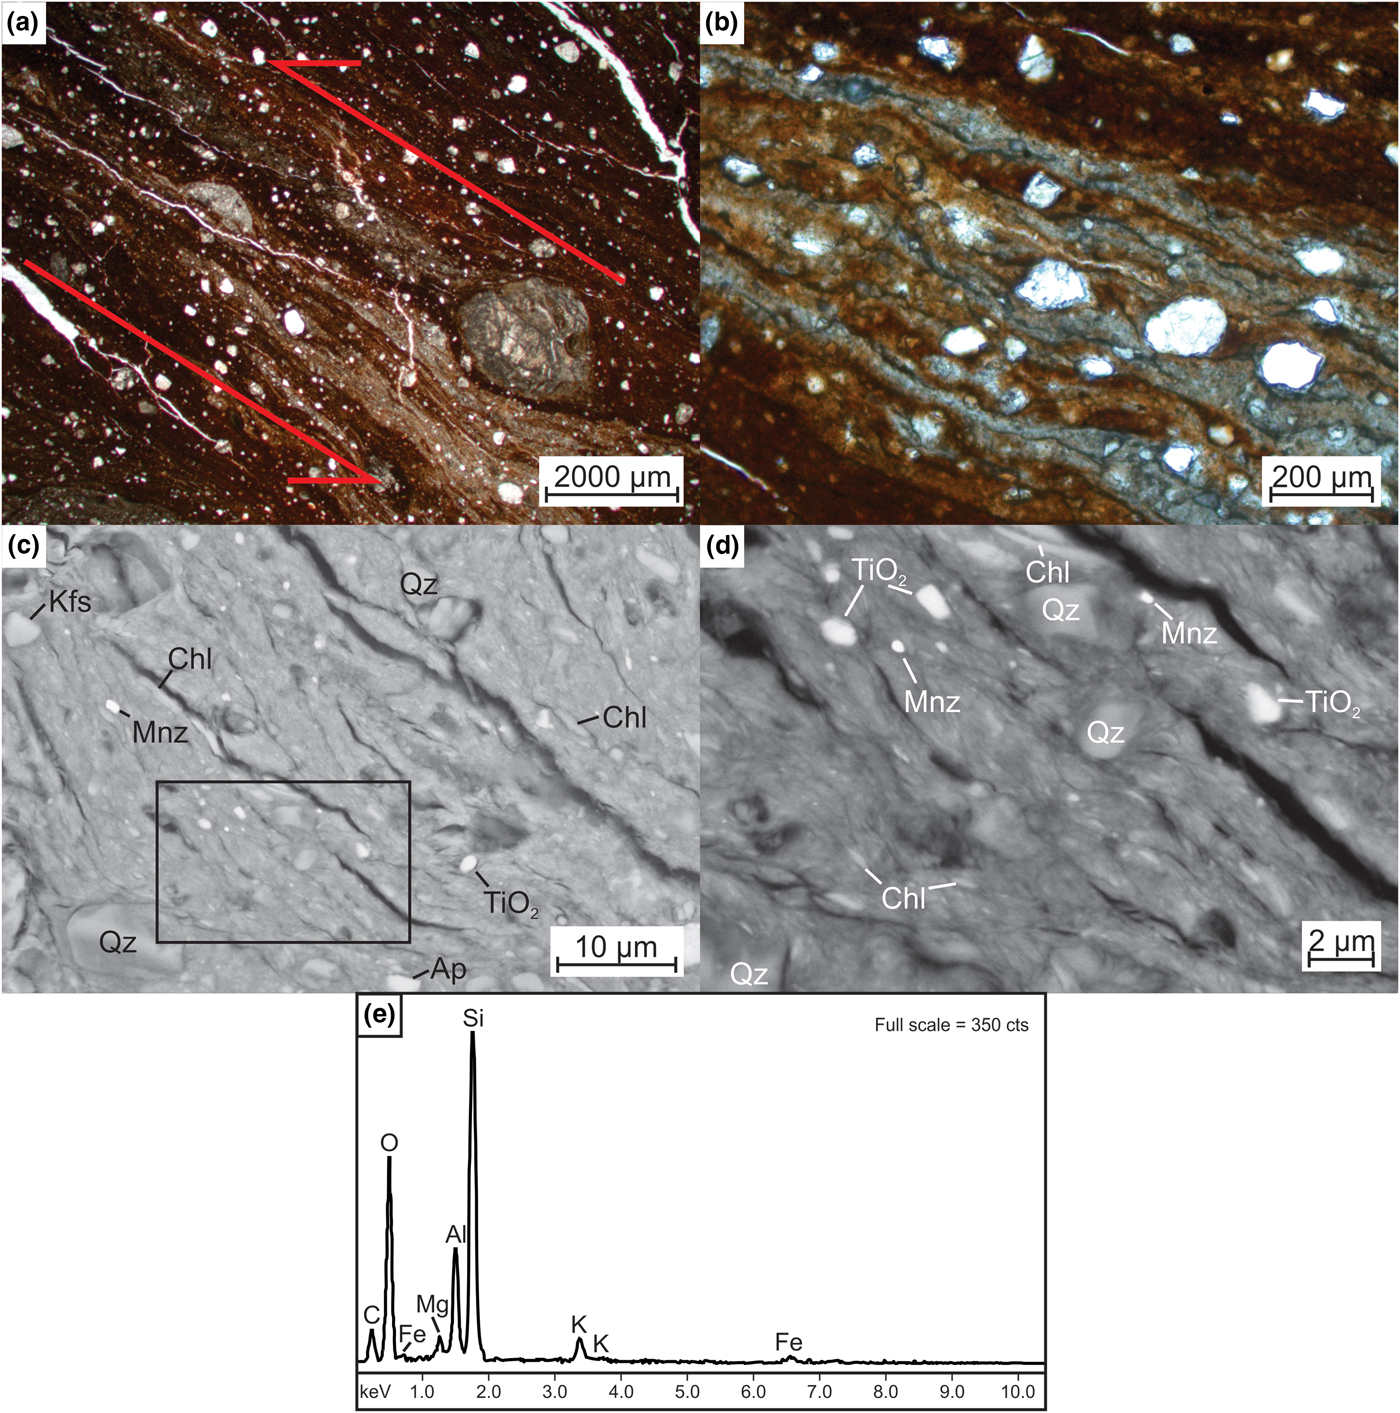
Fig. 3. Petrographic features of the Sronlairig Fault gouge, sample VY359. (a) Low-magnification optical photomicrograph (plane-polarized light) showing general fine-grained, oriented texture with sand- and silt-sized quartz (Qz) grains and occasional large, rounded lithic fragments (porphyroclasts); arrows indicate sense of shear. (b) Higher-magnification optical photomicrograph (plane-polarized light) showing more detailed view of the oriented fabric. (c) Backscatter electron photomicrograph showing fine-grained clay-rich matrix and occasional silt- and sand-grade, generally sub-rounded Qz, K-feldspar (Kfs), Ti oxides (TiO2) and chlorite (Chl) flakes; box indicates the extent of photomicrograph (d). (d) Backscatter electron photomicrograph showing details of the clay-rich matrix and submicron monazite (Mnz) grains. (e) EDX spectrum for the gouge matrix.
Taken together, the preserved evidence indicates that a sinistral–oblique deformation was a significant part of the history of movement on this fault structure. Any foliation developed in association with the earlier phase(s) of displacement (indicated by the porphyroclasts of deformed rock) has been obliterated by the fabric developed in association with later displacement. There is no microscopic evidence that the fabric now dominating the fault gouge has been modified since it formed by subsequent displacement on the fault.
The fourth thin section, cut to include a boundary between dominantly brown and dominantly grey fault gouge, reveals a highly complex distribution of the two colour variants at the thin-section scale (and evidence for sinistral shear), but confirms that the gouge otherwise displays no discernible difference in character (Fig. 3a,b).
Higher-magnification SEM examination provided further evidence of the very fine-grained nature and oriented fabric of the clay-rich gouge (Fig. 3c,d). As well as the larger quartz and lithic grains, occasional silt- and sand-grade, generally sub-rounded quartz, K-feldspar, Ti oxide and apatite grains were observed together with chlorite flakes and submicron monazite grains (Fig. 3c,d). The EDX analyses suggest that the gouge matrix is composed of a mixture of illite and chlorite (Fig. 3e).
X-ray diffraction analysis
In broad agreement with the petrographic analysis, powder XRD analysis indicates that the whole-rock mineralogy of the fault-gouge samples is dominated by undifferentiated mica (‘mica’ possibly including muscovite, biotite, illite and I-S) and quartz with subordinate amounts of K-feldspar and chlorite and traces of calcite. Minor amounts of plagioclase feldspar were detected in sample VY361/G1, along with traces of hematite in the brown samples (VY352/G1 and G2) and anatase in sample VY352/G2 (Table 3).
Table 3. Summary of the whole-rock mineralogy of the fault-gouge samples.
nd = not detected.
Reconnaissance <2 µm oriented-mount XRD indicated that the clay mineral assemblages consisted predominantly of illite with minor amounts of chlorite (Fig. 4). Traces of quartz were identified in each of the <2 µm separates together with hematite in the brown samples (Table 4).
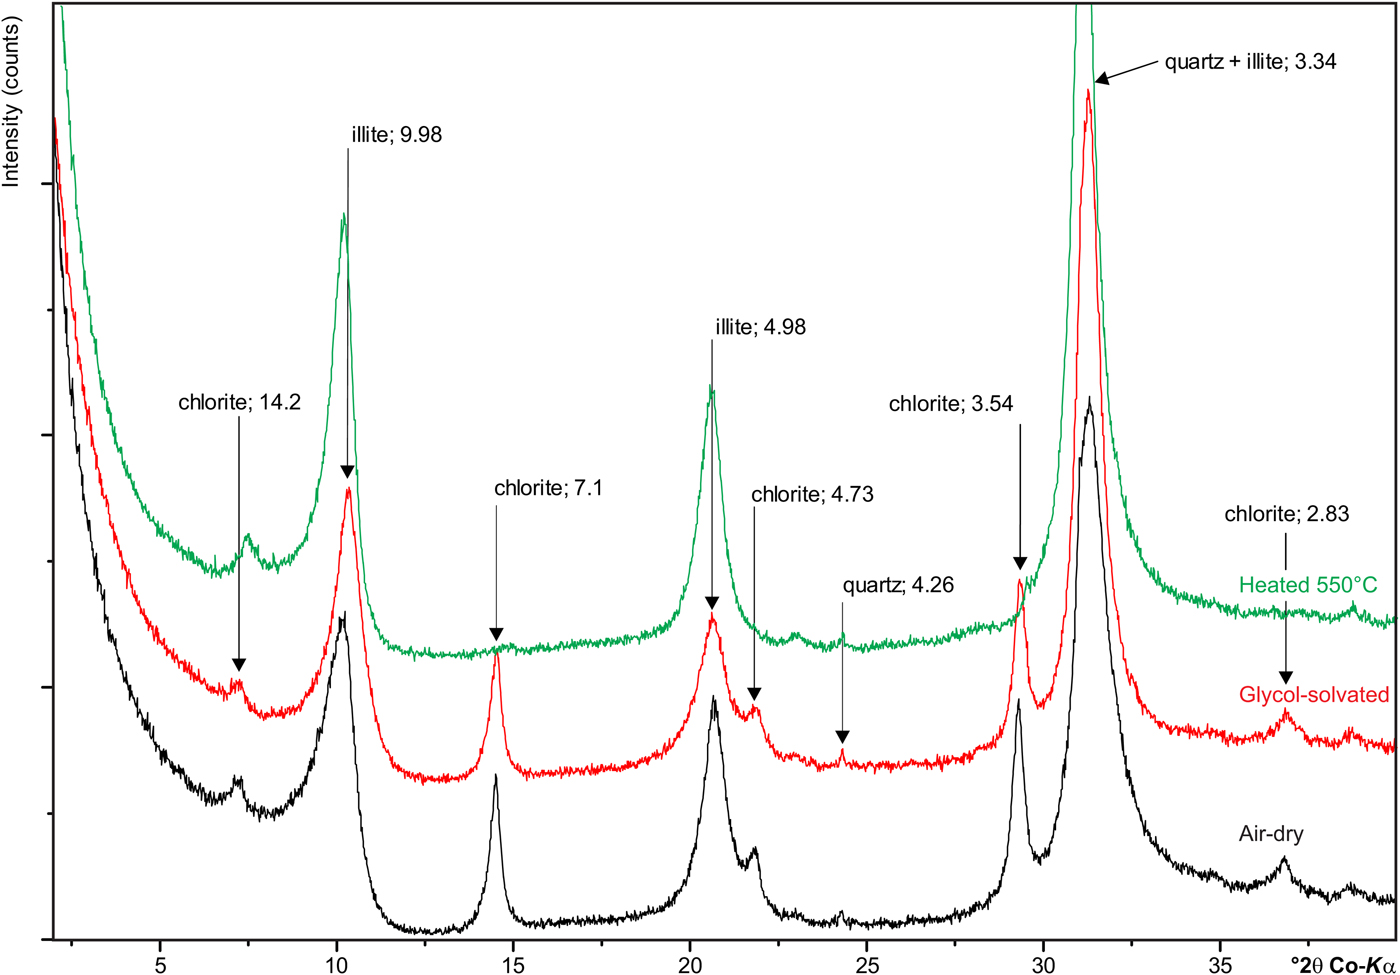
Fig. 4. Less than 2 µm XRD traces to illustrate the diagnostic testing scheme; sample VY352/G1, brown.
Table 4. Summary of the relative proportions of clay minerals in the <2 µm fractions extracted from the fault-gouge samples and their full width at half maximum (FWHM) measurements.
Oriented-mount XRD analysis of the 2.0–0.2, 0.2–0.1, 0.10–0.05 and <0.05 µm separates revealed increasing illite and decreasing chlorite content with decreasing particle size (Table 5). Measurements of the width of basal reflections (full width at half maximum; FWHM, Δ°2θ) also increased with decreasing particle size (Figs 5, 6, Table 5).
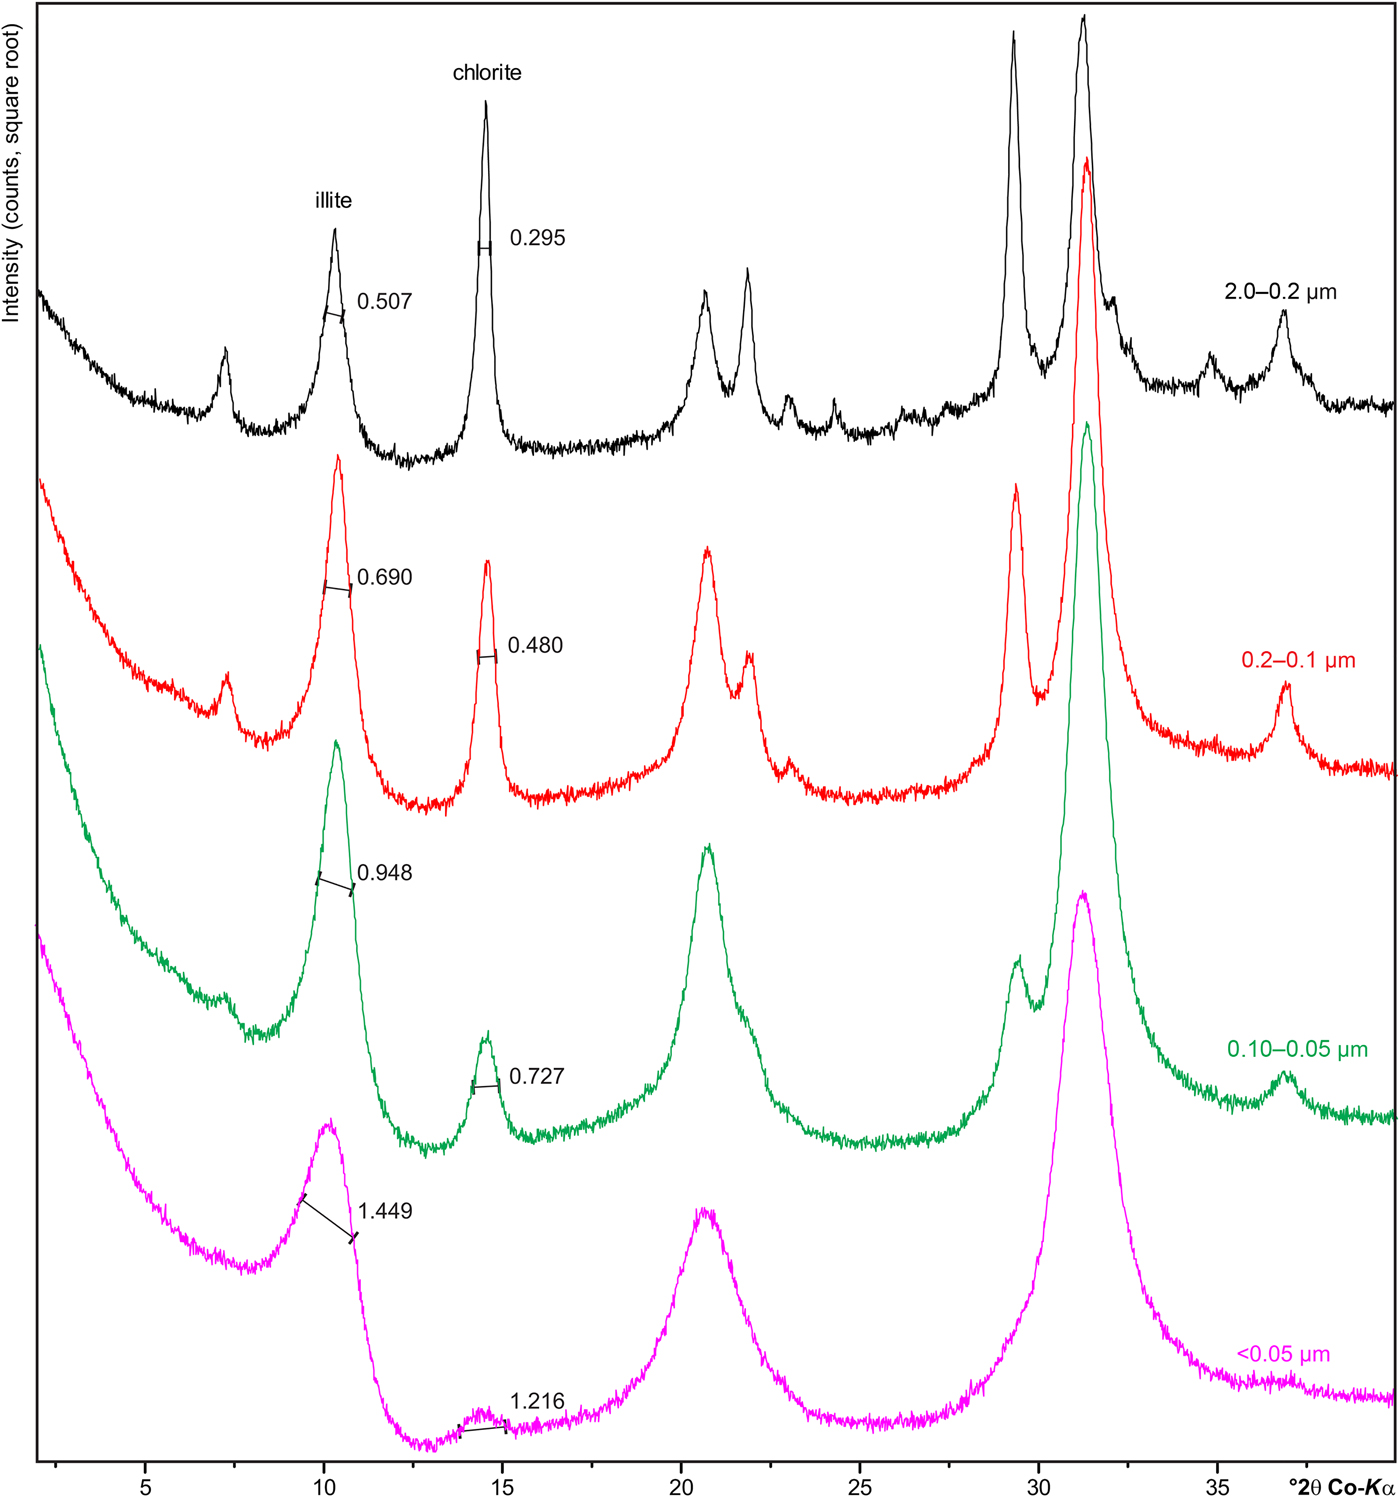
Fig. 5. Example XRD traces to illustrate the increasing illite and decreasing chlorite concentrations with decreasing particle size; sample VY361/G1, grey–green. Note the decreasing crystal order of the illite and chlorite with decreasing particle size, shown by the FWHM (Δ°2θ) measurements of the basal spacing peaks. Note also the square root intensity scale.
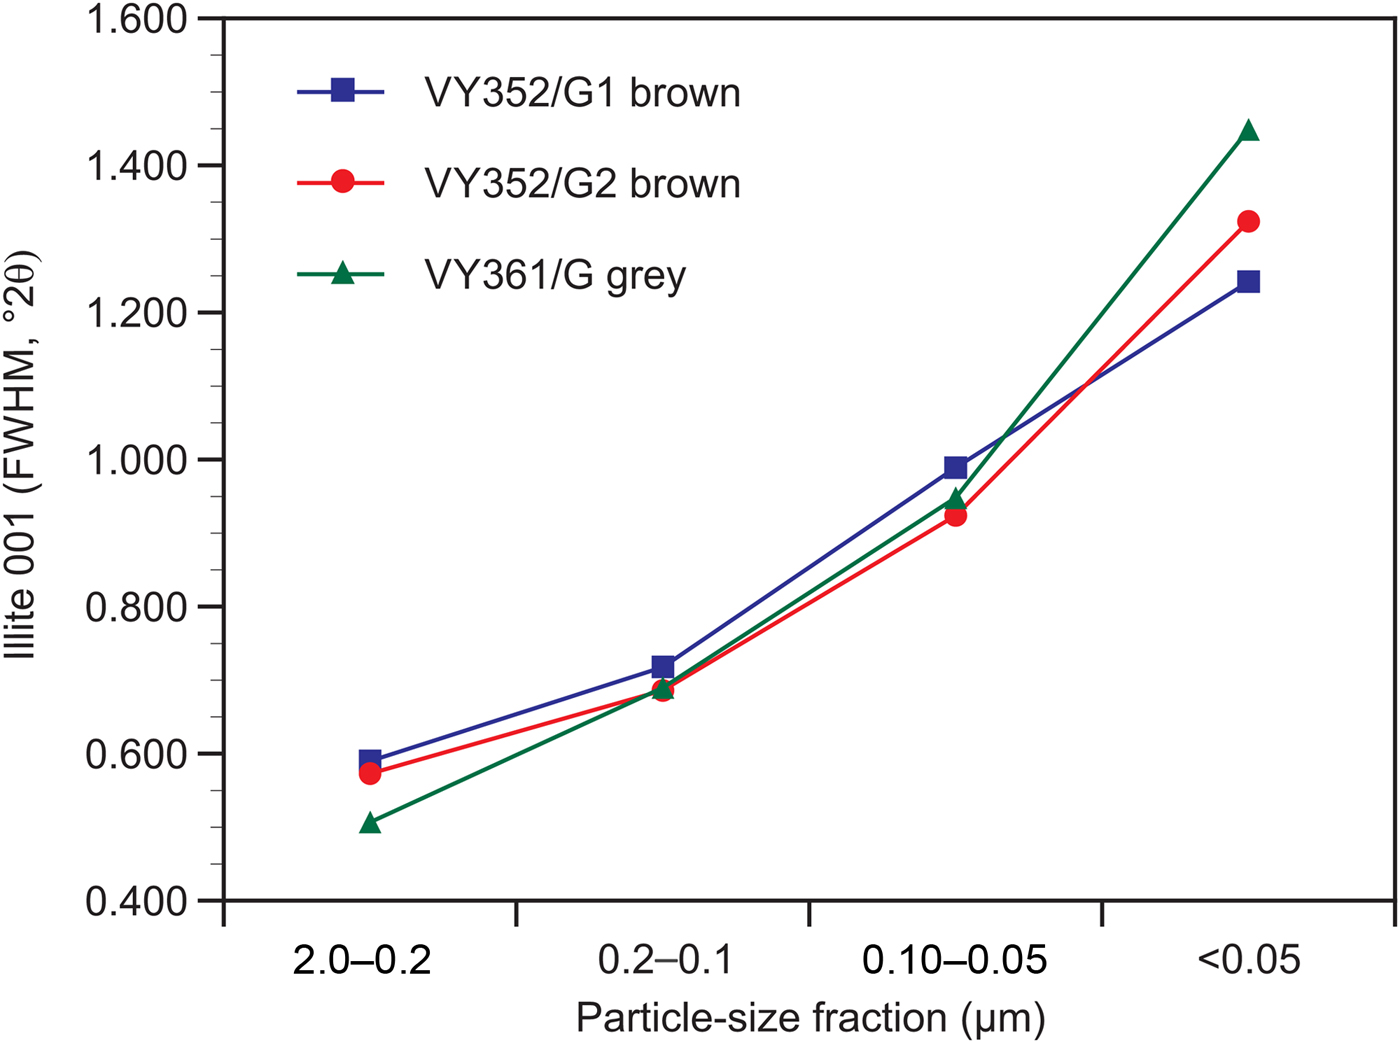
Fig. 6. Comparison of illite 001 FWHM (Δ°2θ) with particle size.
Table 5. Summary of size-fraction clay mineral assemblages and K–Ar analyses.
nd = not detected; dist. = distribution; mdfd = mean defect free distance.
Slow XRD scans of the 2.0–0.2, 0.2–0.1, 0.10–0.05 and <0.05 µm separates encapsulated in glass capillaries present excellent random orientations. Grathoff & Moore (Reference Grathoff and Moore1996) suggested that random orientations have been achieved if the peak intensity of illite 020 (4.49 Å) is significantly more intense than the illite 002 (5.00 Å). Samples prepared for this study present typical 002/020 peak intensity ratios of ~0.1 (Fig. 7), suggesting that excellent random orientations were achieved using the capillary methodology. This represents a major step forward for the identification and quantification of illite polytypes, crucial for IAA forward modelling, particularly where only extremely small amounts of material are available.
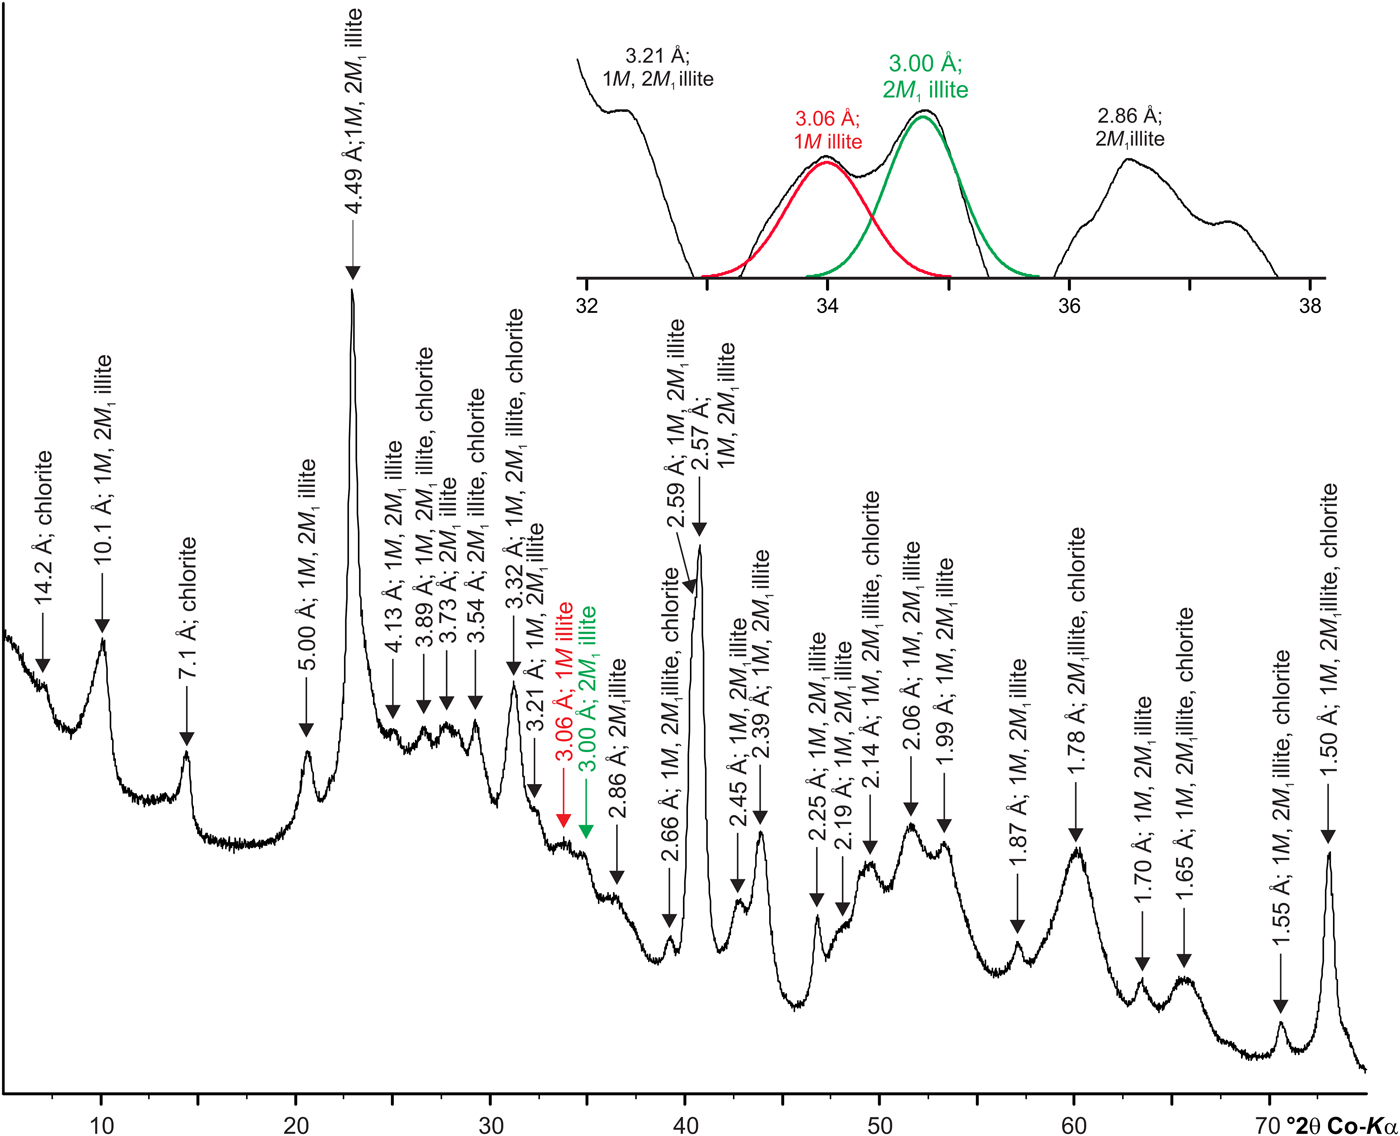
Fig. 7. Example capillary mount XRD trace to illustrate excellent random orientation of the material and the diagnostic peaks for the 1M and 2M 1 polytypes; sample VY361/G1, 0.2–0.1 µm. Inset shows zoomed view to illustrate polytype peak area measurements on the background-subtracted trace.
Despite the excellent random orientations achieved, illite polytype identification was still a difficult task due to peak overlap and the paucity of diagnostic reflections (Fig. 7). Initial examination suggested that the coarser size separates were composed of greater proportions of 2M 1 illite, while the finer grain sizes showed increasing proportions of 1M illite. No evidence was obtained for 2M 1 polytype in the finest-size separates (<0.05 µm).
A range of approaches was trialled for quantifying the proportions of each illite polytype. The WILDFIRE© (Reynolds Jr, Reference Reynolds1994) modelling approach, favoured in several recent studies (e.g. Solum & van der Pluijm, Reference Solum and van der Pluijm2007; Haines & van der Pluijm, Reference Haines and van der Pluijm2008; Song et al., Reference Song, Chung, Choi, Kang, Park, Itaya and Yi2014), proved successful at generating generally realistic 2M 1 polytype profiles. However, despite repeated attempts using the full range of available options, the generated profiles failed to provide satisfactory simulations for the observed 1M illite. This inability to match the 1M illite profile in the sample's finest fractions, where it is found in its greatest abundance, means that any quantification in coarser fractions, where its degree of crystal order might be different, is highly uncertain. Similar difficulties with WILDFIRE© modelling have been experienced by other current researchers (Vrolijk et al., Reference Vrolijk, Pevear, Covey and LaRiviere2018; A. Schleicher, pers. comm., 2017; M. Raven, pers. comm., 2019). Quantification using the Rietveld refinement technique (Rietveld, Reference Rietveld1969; Bish & Post, Reference Bish and Post1993) was also precluded by a lack of suitable structural data for illite polytypes in the Inorganic Crystal Structure Database (2018).
Therefore, in this study, we reverted to a more simplistic, corrected peak-area-measurement methodology. Dalla Torre et al. (Reference Dalla Torre, Stern and Frey1994) conducted a review of XRD mica polytype quantification methods and recommended the approach of Callière et al. (Reference Callière, Henin and Rautureau1982), and these guidelines were followed here. Specifically, this involved measuring the peak areas (I) of the 2M 1-specific 3.00 Å and 1M-specific 3.06 Å peaks (Fig. 7) and ratioing these using the simple formula:
 $${\rm \%} 2M_1 = \displaystyle{{I\lpar {3.00{\rm \;{\Aring}}} \rpar } \over {I\lpar {3.00{\rm \;{\Aring}}} \rpar {\rm \;} + {\rm \;} I\lpar {3.06{\rm \;{\Aring}}} \rpar }}$$
As the chosen peaks form slightly different relative intensities (3.00 Å, 76%; 3.06 Å, 83%), these were further refined by normalizing on the basis of peak intensity data from ICDD (Reference Kabekkodu2014) standard patterns (Fig. 7, Table 5).
To establish absolute errors for the quantification method, Dalla Torre et al. (Reference Dalla Torre, Stern and Frey1994) produced a series of synthetic mixtures of pure 2M 1 and 1M polytypes and determined their proportions using the polytypic reflections suggested by Callière et al. (Reference Callière, Henin and Rautureau1982). The resultant calibration curve showed a high degree of reproducibility and a good correlation (R 2 = 0.99). Ten samples containing 50% 2M 1 produced a mean value of 0.47 (standard deviation, 2σ: 0.02) and an absolute error of ± 2%. A more conservative error of ± 5% was applied in this study.
K–Ar analysis
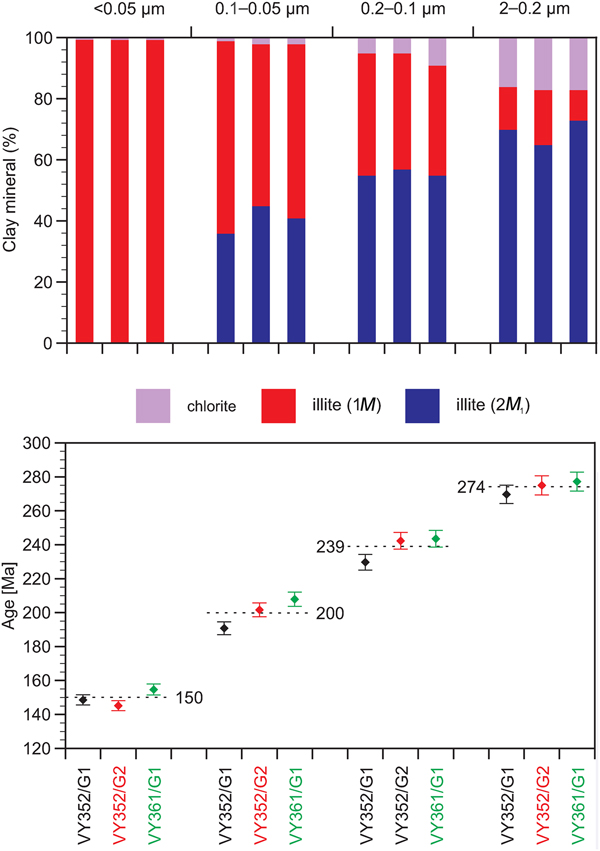
Twelve K–Ar illite ages, covering four grain-size ranges comprising: (1) a very fine <0.05 µm size; (2) intermediate 0.10–0.05, 0.2–0.1 µm sizes; and (3) a coarse 2.0–0.2 µm size were obtained (Fig. 8, Table 5). The K–Ar ages range from 145.2 ± 2.9 Ma (Lower Cretaceous–Berriasian, VY352/G2, <0.05 µm) to 277.2 ± 5.6 Ma (Permian–Cisuralian–Artinskian, VY361/G1, 2.0–0.2 µm). Radiogenic 40Ar contents range from 79% to 97% indicating reliable analytical conditions for all analyses with no significant radiogenic 40Ar contamination. K contents range from 4.80% to 5.67%. The lower K concentration in some size fractions is caused by contamination with other mineral phases, such as quartz and chlorite, which is supported by XRD data (Table 4). The K–Ar ages increase with increasing grain sizes (Fig. 8). A detailed comparison of the analyzed grain-size fractions with a discussion of mineralogical constraints is presented below. In general, illite content increases with decreasing grain size (Table 5, Fig. 8).
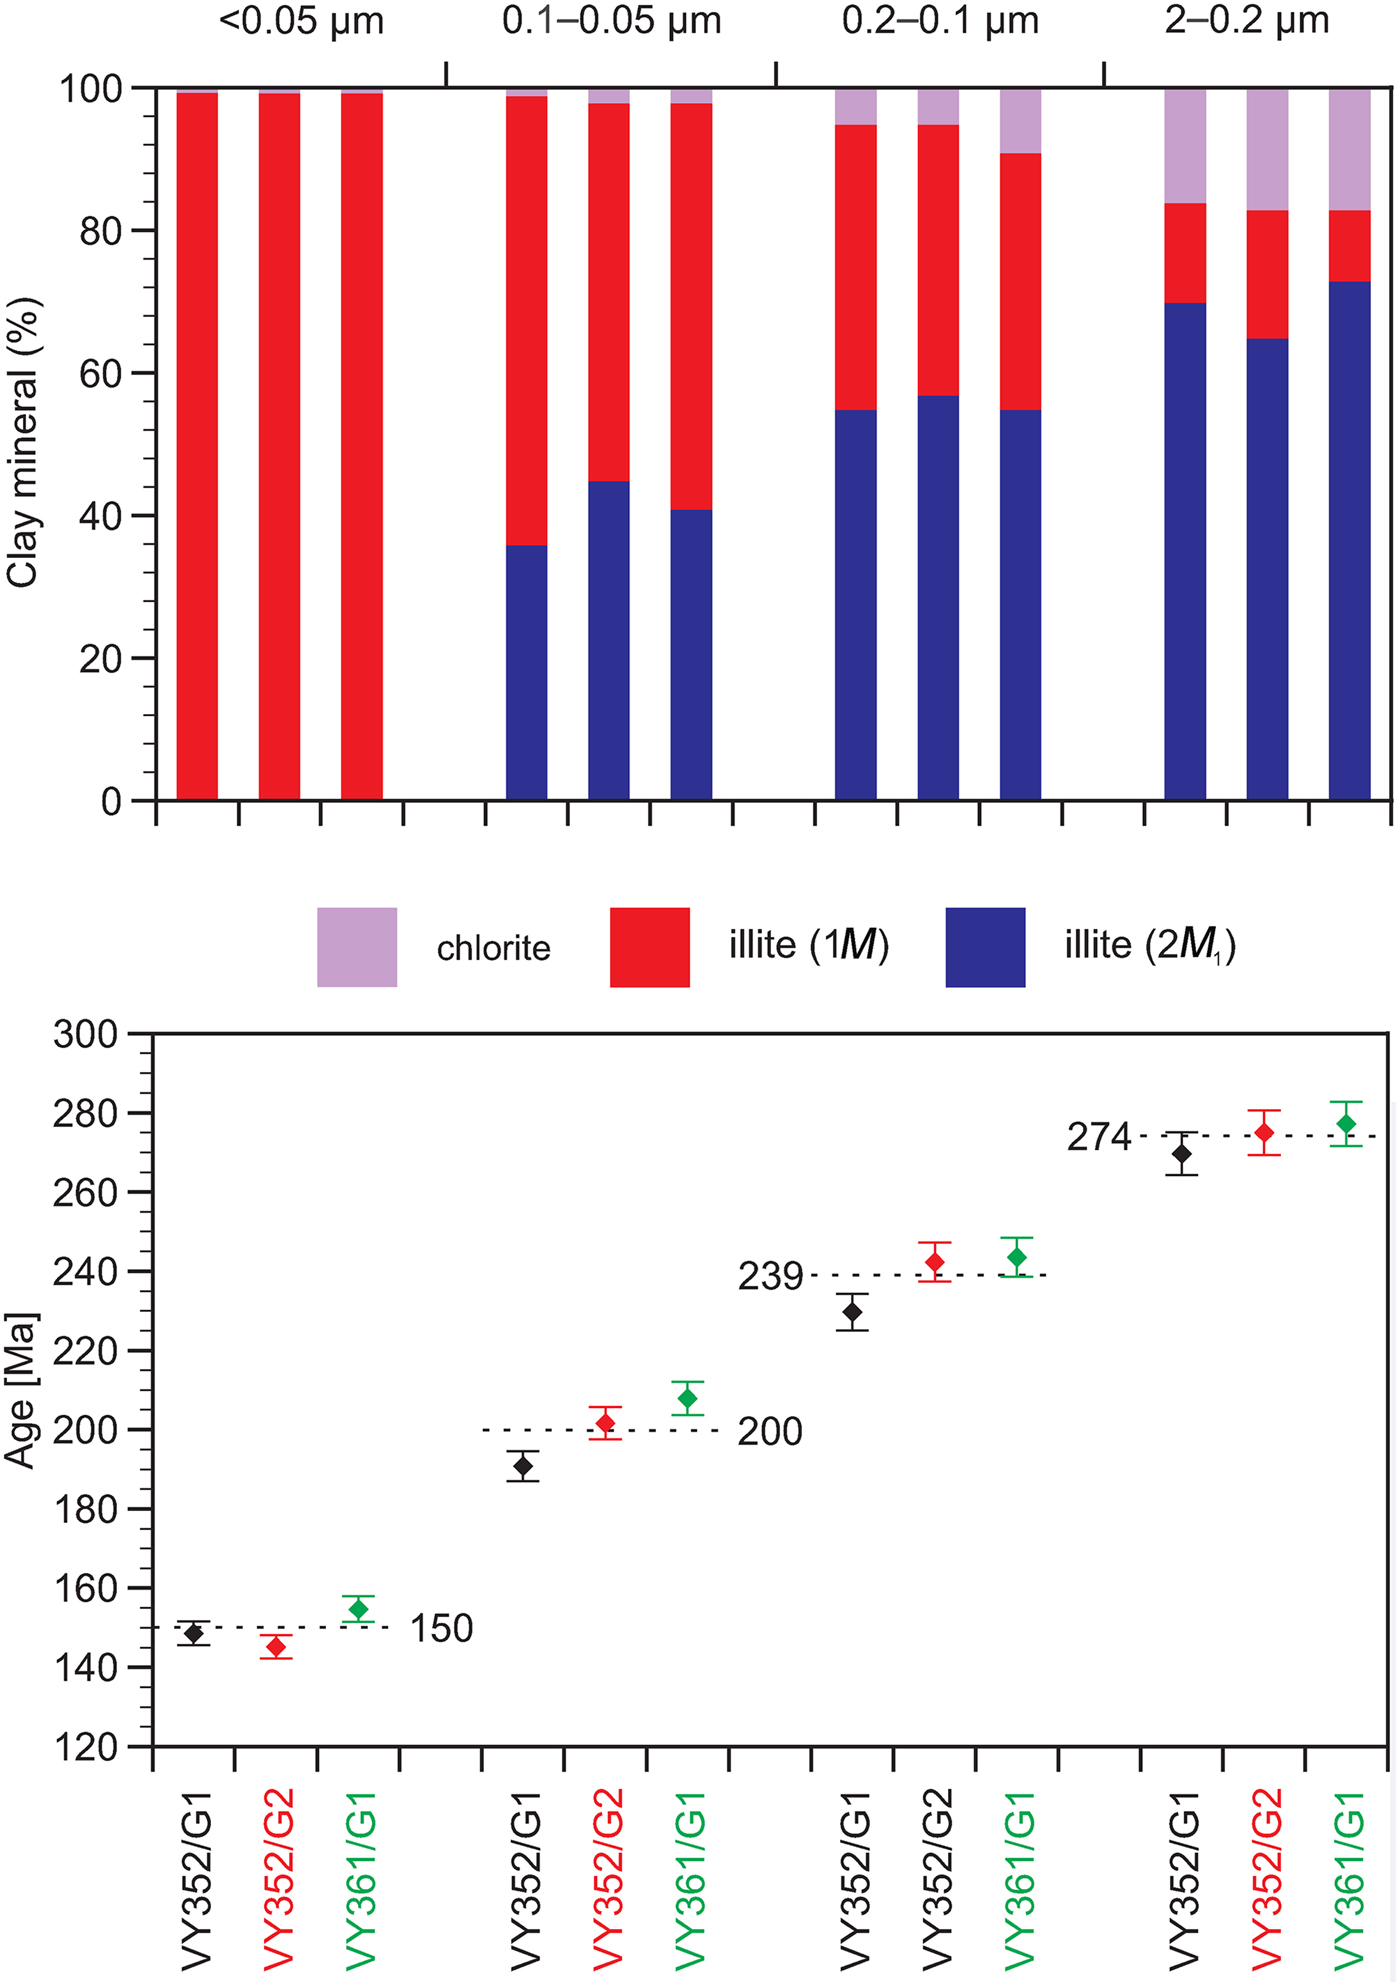
Fig. 8. Comparison of the clay mineralogy and K–Ar age data for the isolated size fractions. Dashed lines indicate the mean K–Ar age for the differently sized fractions.
The 2.0–0.2 µm fractions yield ages within error and an average age of 274.0 ± 5.5 Ma, suggesting an homogeneous illite source. The K content for the coarse fractions ranges from 4.81% to 5.48%, with the range reflecting contamination with non-K-bearing mineral phases (Table 4).
The 0.2–0.1 µm size fractions yield ages ranging from 229.7 ± 4.6 Ma to 243.5 ± 4.9 Ma. K content ranges from 5.49% to 5.67%, caused by minor changes in mineralogy (Table 5). The 0.10–0.05 µm fractions yield ages ranging from 190.8 ± 3.8 Ma to 207.9 ± 4.2 Ma with similar K contents to the 0.2–0.1 µm grain size, ranging from 5.45% to 5.63% and again caused by minor variations in mineralogy (Table 5).
The <0.05 µm fractions yield ages ranging from 145.2 ± 2.9 Ma to 154.7 ± 3.2 Ma and contain less, homogeneous K, ranging from 4.80% to 4.94%, again caused by minor mineralogical variations (Table 5).
Illite Age Analysis modelling
A series of IAA plots was produced using the proportion of the 2M 1 polytype plotted against the function exp(λt) –1 (where λ is the decay constant of potassium and t is time) with error bars of ± 5% 2M 1 applied. The ‘inclined spectra’ (Pevear, Reference Pevear1999) shown in Fig. 9 are conceptually similar to those obtained by other fault studies (Torgersen et al., Reference Torgersen, Viola, Zwingmann and Henderson2015). As noted by Haines & van der Pluijm (Reference Haines and van der Pluijm2008), the percentage of 2M 1 illite is linearly related to the exponential decay of potassium and not to chronological time. Excellent R 2 values of >0.97 were obtained with predicted mean ages of 296 ± 7 Ma (‘Faulting event 1’) and 145 ± 7 Ma (‘Faulting event 2’) (Fig. 9a,b,c). The similarity of the IAA dates suggests that trace amounts of K-feldspar in the coarse (2.0–0.2 µm) fraction of sample VY361/G1 has had a negligible effect, as increased temperatures in the fault zone might have partially or fully reset its isotopic signatures as described by Zwingmann et al. (Reference Zwingmann, Mancktelow, Antognini and Lucchini2010).
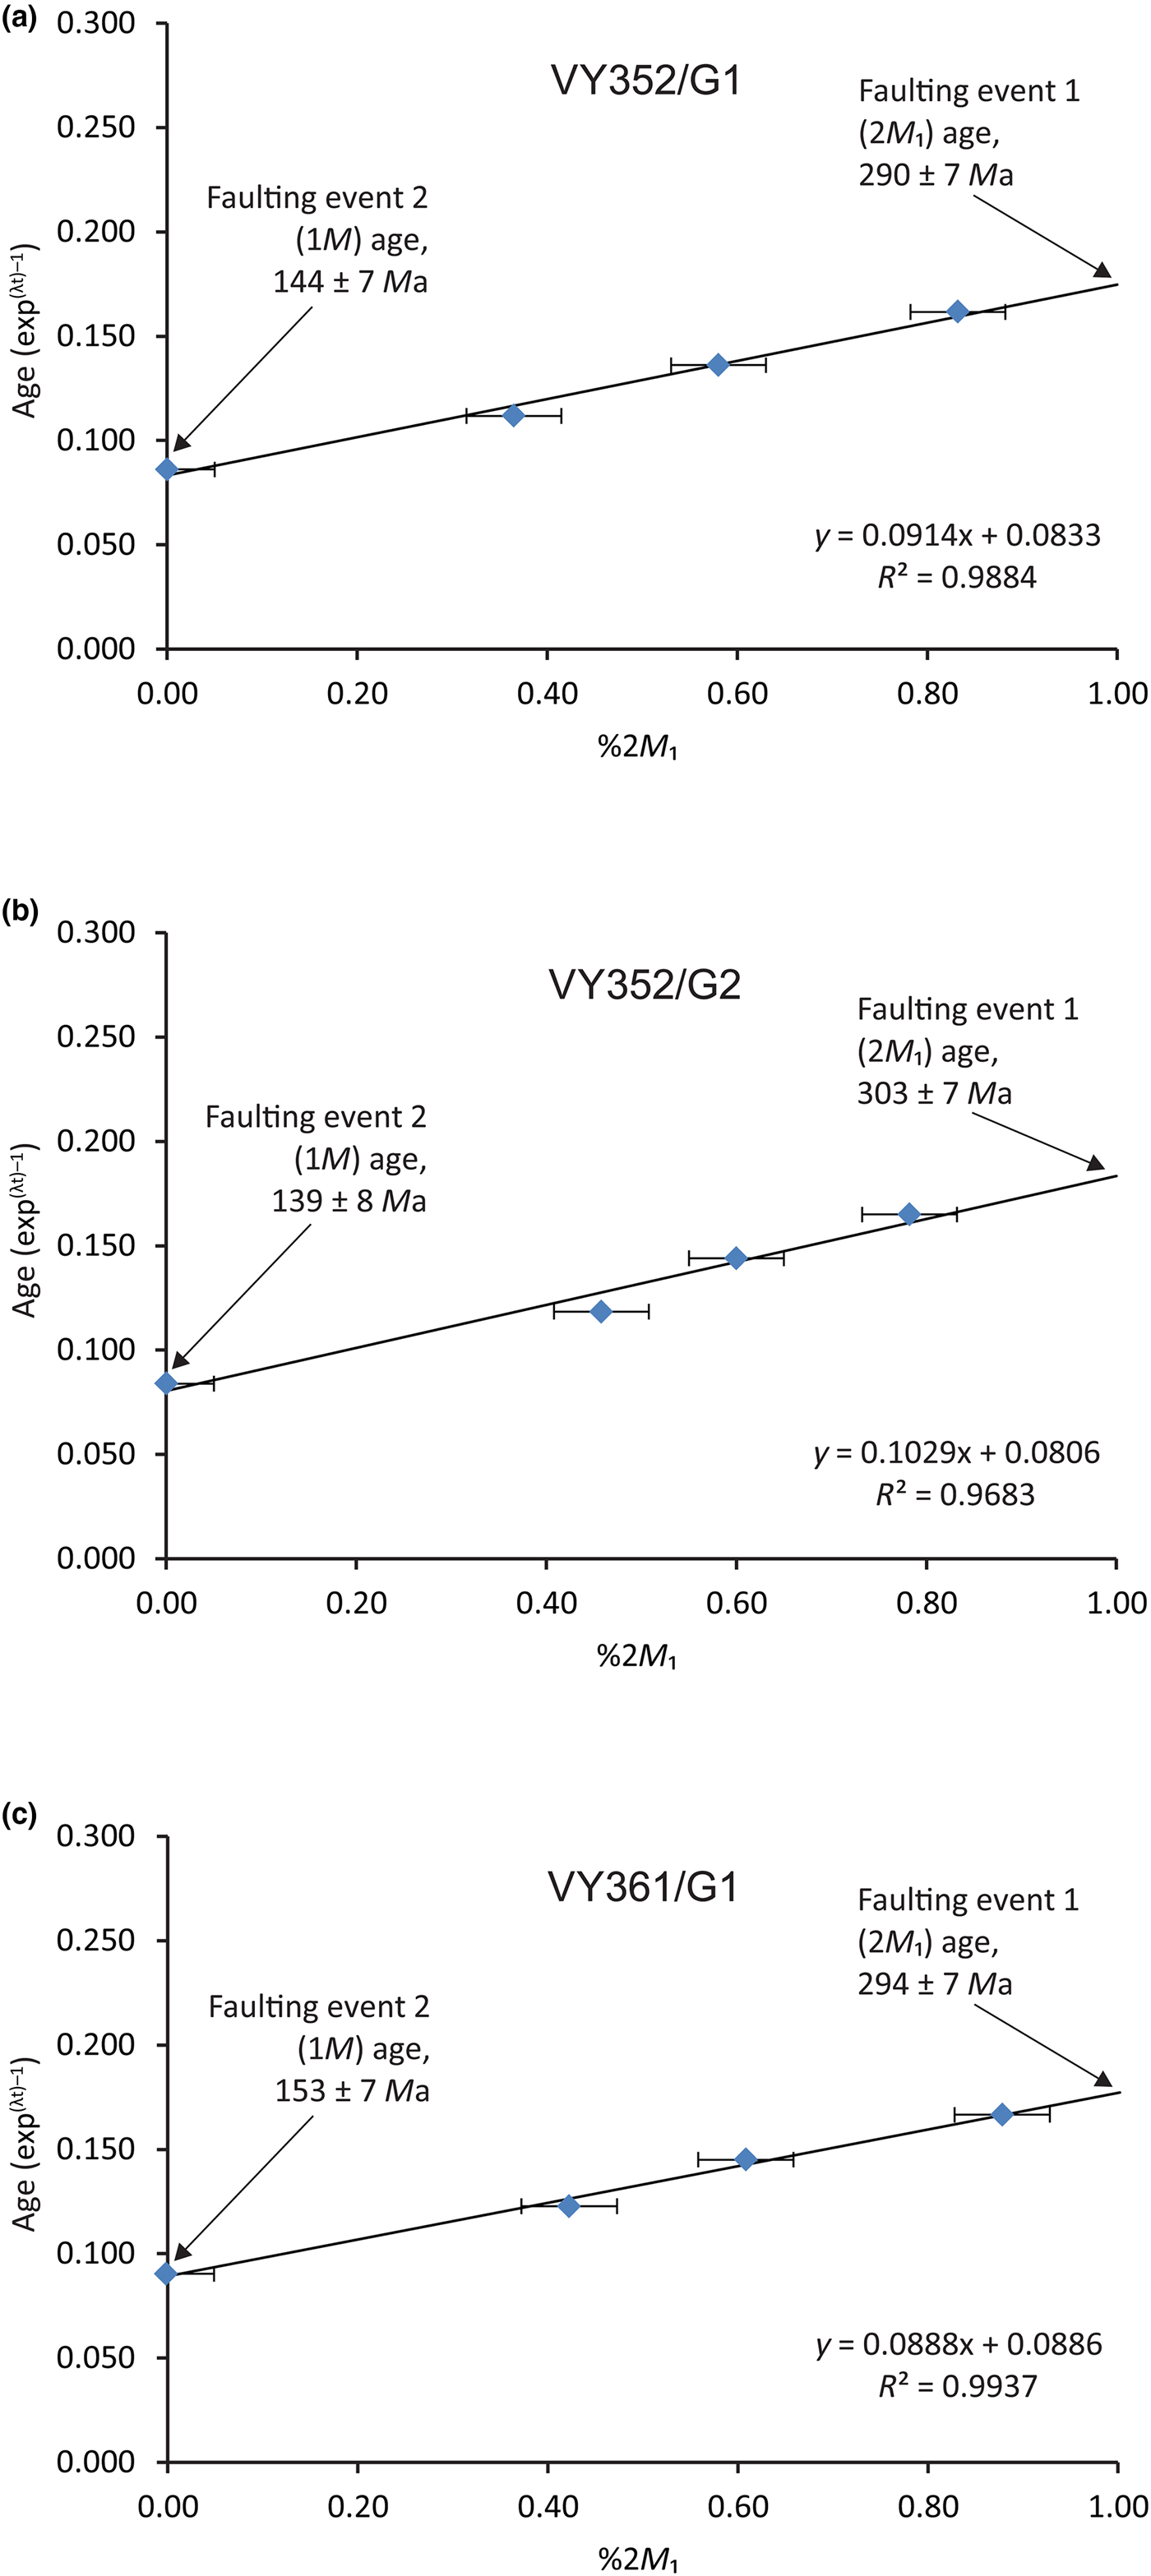
Fig. 9. IAA plots for the three Sronlairig Fault samples (a) VY352/G1, (b) VY352/G2 and (c) VY361/G1. Fraction error bars reflect ±5% error in quantification of the %2M 1 illite polytype. Propagated errors for end-member ages are shown in labels only.
Geological interpretation
Field evidence and the dating of synkinematic plutons suggest a mid- to late-Silurian age for the initiation of sinistral displacements on the major Scottish strike-slip faults such as the GGFZ (e.g. Stewart et al., Reference Stewart, Strachan, Martin and Holdsworth2001). Based on the presence of overlying Devonian sedimentary rocks, sinistral movements along the GGFZ ceased by c. 390 Ma (Stewart et al., Reference Stewart, Strachan and Holdsworth1999). Primary, sinistral strike-slip displacements along the Walls Boundary Fault Zone, a northerly extension of the GGFZ, were probably initiated later than movements in the GGFZ as a whole (before c. 400 Ma) and ceased before c. 370 Ma (Watts et al., Reference Watts, Holdsworth, Sleight, Strachan and Smith2007).
Based on field observation and these previous indirect dating studies, we expected our illite dating study to prove similar ages for the Sronlairig Fault gouge. Our initial hypothesis envisaged that the oldest event age from the Sronlairig Fault gouge would reflect mica derived from Dalradian metasedimentary rocks (south wall, >470 Ma) and/or the Allt Crom Pluton (north wall, c. 434 Ma). These would almost certainly have been reset during the metamorphism associated with the Caledonian orogeny (490–390 Ma; McKerrow et al., Reference McKerrow, MacNiocaill and Dewey2000). However, the IAA age of 296 ± 7 Ma for Faulting event 1 is much younger than the wall rock or orogenic features and therefore requires a different interpretation (Fig. 10).
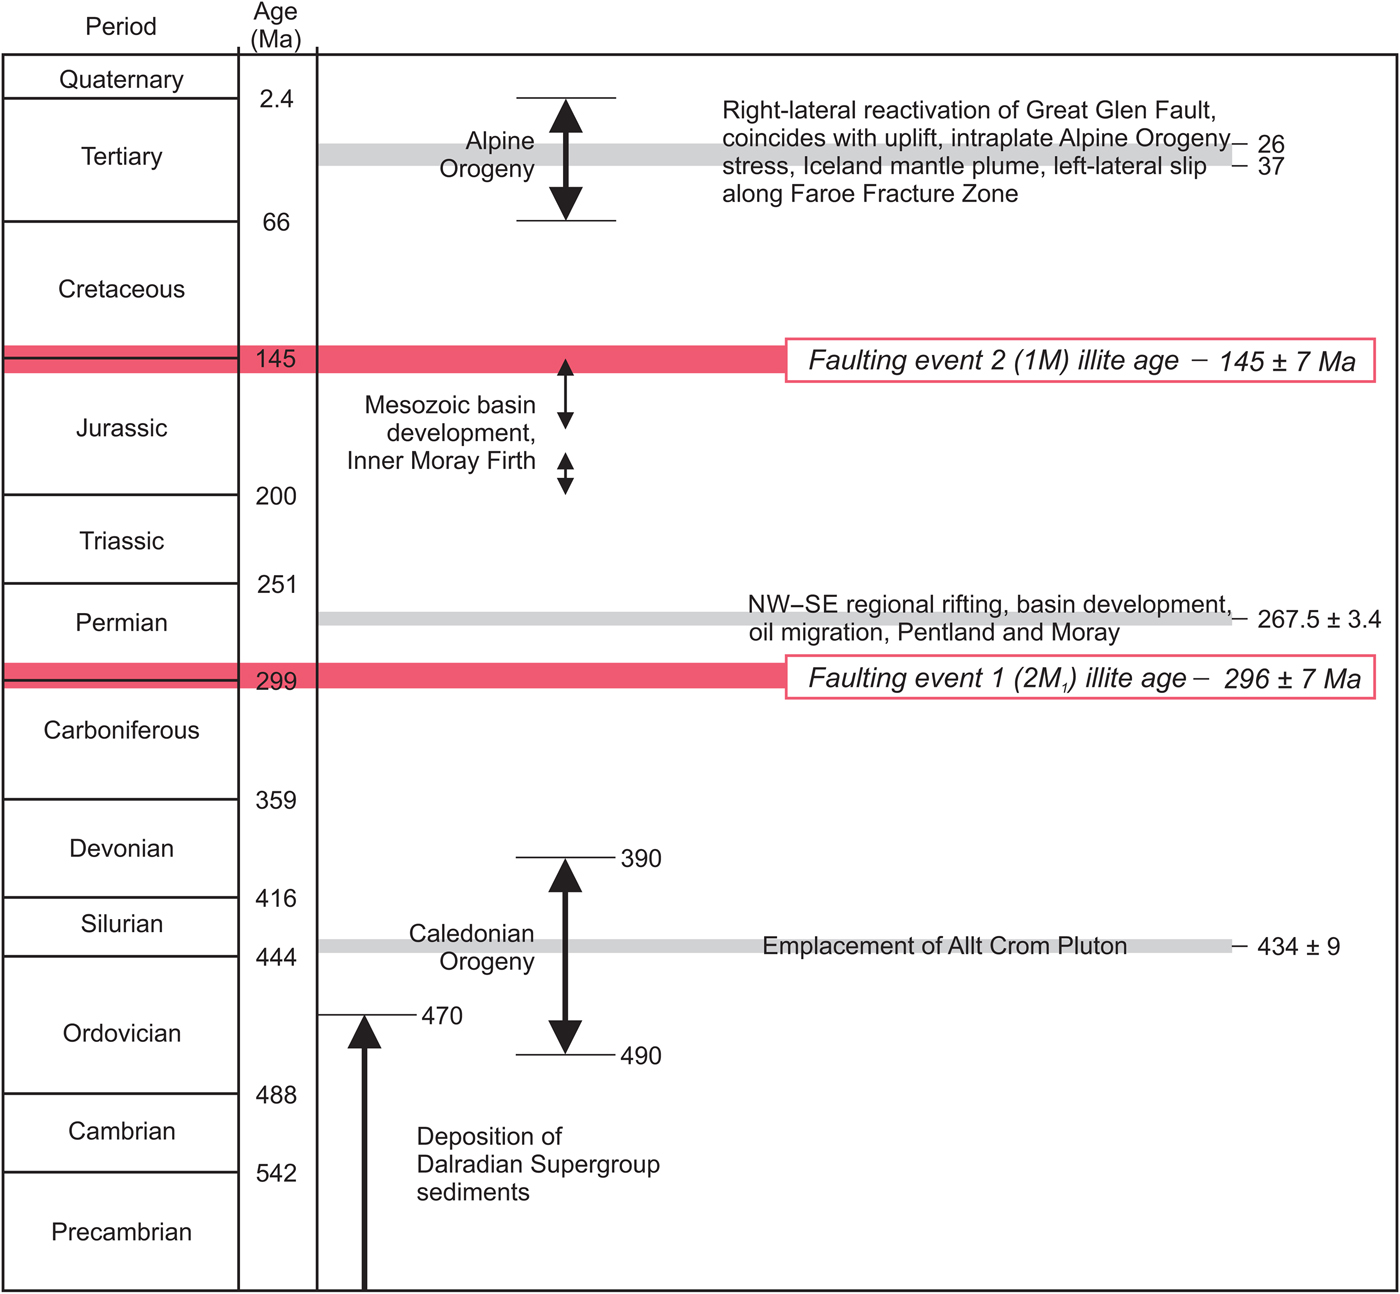
Fig. 10. Summary and correlation of events related to the Sronlairig Fault (information from Underhill, Reference Underhill1991; Le Breton et al. Reference Le Breton, Cobbold and Zanella2013; Dichiarante et al., Reference Dichiarante, Holdsworth, Dempsey, Selby, McCaffrey, Michie, Morgan and Bonniface2016). Simplified timescale after Gradstein et al. (Reference Gradstein, Ogg and Smith2004).
Faulting event 1 age
The Faulting event 1 age might reflect mica derived from Late Carboniferous protolith, but we consider this extremely improbable due to a lack of suitable sources. Instead, the age may reflect the full or partial resetting of earlier-formed, inherited or authigenic micas (resulting in lost Ar or gained K) or the authigenic, synkinematic crystallization of 2M 1 illite-muscovite during an earlier, hotter fault-displacement event. Diffusion of 40Ar may have been caused by regional heating, frictional heating or high-temperature fluid advection during fault reactivation (e.g. Tagami, Reference Tagami2012; Tonai et al., Reference Tonai, Ito, Hashimoto, Tamura and Tomioka2016).
Generally, the Earth has a one-dimensional (vertical) temperature profile, averaging ~30°C/km in the upper continental crust (Ehlers, Reference Ehlers2005). At a regional scale, the background thermal history depends on a range of factors, including surface topography, spatial variation of geothermal structure, tectonic tilting and ductile deformation at depth (Tagami, Reference Tagami2012). Normal or slightly elevated geothermal gradients as a result of end-Caledonian granite plutonism are suggested as appropriate during the earlier stages of shearing along the GGFZ (Stewart et al., Reference Stewart, Strachan and Holdsworth1999). The development of 2M 1 illite in a brittle fault gouge due to cooling of the host rock and its passage through epizonal conditions contemporaneous to faulting and retrograde metamorphism (Bense et al., Reference Bense, Wemmer, Löbens and Siegesmund2014) is improbable in the Sronlairig Fault.
Brittle deformation may cause fault frictional heating, which is characterized by episodic, several-second temperature increases of up to 1000°C that reach several millimetres into the wall rock (Brown, Reference Brown1998; Tagami, Reference Tagami2012). Such changes can result in melting and, where pressures exceed 0.7 GPa, the development of pseudotachylytes (Lavallée et al., Reference Lavallée, Hirose, Kendrick, Hess and Dingwell2015). Leloup et al. (Reference Leloup, Ricard, Battaglia and Lacassin1999) suggested shear heating increases of ~590°C at the Moho, ~475°C at 20 km depth and lower temperatures (still sufficient to cause high-grade metamorphic conditions) in strike-slip shear zones. Mineralogical response such as crystal–plastic straining of quartz (250–300°C) and fracturing and brittle deformation of feldspar (<500°C) provide useful indicators of syntectonic temperatures in the GGFZ (Stewart et al., Reference Stewart, Strachan and Holdsworth1999). Micas deform mainly by mechanical sliding along basal 00l crystal planes, but may also become kinked or fragmented and locally experience intense subgrain development and dynamic recrystallization close to the centre of the GGFZ (Stewart et al., Reference Stewart, Strachan and Holdsworth1999).
Fluid advection, often related to volcanism, with temperatures above the Ar-closure temperature of micas (>280°C), may also be responsible for Ar-resetting in the micas, as noted in faults and thrust zones elsewhere (e.g. de Jong et al., Reference de Jong, Wijbrans and Féraud1992; Kondo et al., Reference Kondo, Kimura, Masago, Ohmori-Ikehara, Kitamura, Ikesawa, Sakaguchi, Yamaguchi and Okamoto2005; Rowe et al., Reference Rowe, Meneghini and Casey Moore2009; Tagami, Reference Tagami2012). Petrographic examination of red- to brown-coloured gouges from the Walls Boundary Fault (Fig. 1a) suggests widespread sericitization and chloritization reactions attributed to chemically active fluid alteration (Watts et al., Reference Watts, Holdsworth, Sleight, Strachan and Smith2007). These hematitic, phyllosilicate-rich gouges appear to be very similar to those observed in the present Sronlairig Fault study (Fig. 3). However, the Sronlairig Fault gouge appears to lack veins of calcite, quartz and ore deposits typically developed by fluid advection and in situ chemical precipitation that might offer other dating opportunities (e.g. U–Th disequilibrium; Watanabe et al., Reference Watanabe, Nakai and Lin2008).
Stewart et al. (Reference Stewart, Strachan and Holdsworth1999) noted that the original feldspar-dominated protoliths along the GGFZ produced load-bearing frameworks that were converted to weaker, phyllosilicate-dominated, foliated cataclasites and phyllonites. Any post-Devonian reactivation appears to have been concentrated within or along the margins of these hydrated assemblages.
The ~20–30 km of dextral displacement on the GGFZ (Coward et al., Reference Coward, Enfield, Fisher, Cooper and Williams1989; Rogers et al., Reference Rogers, Marshall and Astin1989), considered to be of late Carboniferous age on the basis of regional geological considerations (Séranne, Reference Séranne1992), would appear to offer the most probable event for resetting of early-formed micas in the Sronlairig Fault or authigenesis of 2M 1 illite-muscovite (Fig. 10). The dextral movement has also been recognized on the Walls Boundary Fault by an inversion event within the Devonian rocks of Shetland, as well as the Orcadian Basin on Orkney and in northern Scotland (Watts et al., Reference Watts, Holdsworth, Sleight, Strachan and Smith2007). Further north, significant Carboniferous to Permian movements are also seen along the Norwegian Møre–Trøndelag Fault Complex, although these are sinistral rather than dextral (e.g. Osmundsen et al., Reference Osmundsen, Eide, Haabesland, Roberts, Andersen, Kendrick, Bingen, Braathen and Redfield2006).
Post-Caledonian tectonic patterns were established in response to the movement of Baltica relative to Laurussia (Coward, Reference Coward1993). In the Late Carboniferous, regional stresses generated by the relative south-westwards movement of Baltica drove dextral shear in the GGFZ, coincident with strongly partitioned strain in the North Sea basin interior. The Sronlairig Fault is therefore responding along with other structures in this region (e.g. the Banff and Wick faults) to the WNW(NW)–ESE(SE) extension, which becomes important for basin development and hydrocarbon migration in the Pentland and Moray Firth regions (Dichiarante et al., Reference Dichiarante, Holdsworth, Dempsey, Selby, McCaffrey, Michie, Morgan and Bonniface2016; Leslie et al., Reference Leslie, Monaghan, Arsenikos and Quinn2016).
Faulting event 2 age
The Faulting event 2 IAA age may relate to an instantaneous event such as contact metamorphism (e.g. Aronson & Lee, Reference Aronson and Lee1986) or hydrothermal activity (e.g. Lonker & FitzGerald, Reference Lonker and FitzGerald1990) or alternatively to gradual burial activity (e.g. Grathoff & Moore, Reference Grathoff and Moore1996). Previous studies have demonstrated that the age of the finest fraction constrains the timing of faulting (or last movement), as this fraction is usually dominated by the most recently grown authigenic illite (Torgersen et al., Reference Torgersen, Viola, Zwingmann and Henderson2015).
The lack of any foliation and the preservation of the syntectonic fabric within the clay gouge suggests only very minor (if any) movement post-illite growth. Whether the illite formed during individual slip events, gradually during aseismic creep or between individual seismic events due to fluid flow along the fault is unclear (cf. Haines & van der Pluijm, Reference Haines and van der Pluijm2008). As the gouge provides no evidence of further slip, direct precipitation of the 1M illite polytype would indicate formation temperatures of <200°C (Velde, Reference Velde1965).
Alternatively, the illite-rich assemblage in the Sronlairig Fault gouge may, in part, result from burial metamorphism of a precursor, authigenic smectite or I-S. The completion of the thermally driven dehydration of smectite to illite would have required temperatures at the higher end of the 120–150°C range (Merriman & Kemp, Reference Merriman and Kemp1996). There is no evidence for contact metamorphism or further extensive hydrothermal activity at this time in the region.
In a rare case, Duvall et al. (Reference Duvall, Clark, van der Pluijm and Li2011) noted that the authigenic illite age does not always represent the latest phase of fault motion and may document the initiation of faulting. Those authors also suggested that, using XRD analysis, it would be impossible to distinguish between different preserved populations of authigenic 1M illite produced by multiple fault-slip episodes. Here, the pseudoauthigenic illite age would record a mixture of ages rather than the time of a particular event. However, in this case, the excellent linear relationship between the Sronlairig Fault illite age and the %2M 1 illite-muscovite component (Fig. 9), requiring illite polytypes to have grown in the same relative proportions during each event for all size fractions, is strongly indicative of a single faulting episode (or successive events within the uncertainty of the dating methodology) (Duvall et al., Reference Duvall, Clark, van der Pluijm and Li2011).
The Late Jurassic–Early Cretaceous (145 ± 7 Ma) Faulting event 2 IAA age does not correspond with any known local geological event, but coincides with possible dextral movements along the GGFZ and Mesozoic rift, graben and basin development in the Inner Moray Firth (McQuillan et al., Reference McQuillan, Donato and Tulstrup1982) (Figs 1, 10). Later seismic interpretations have disputed the contribution of the GGFZ to this episode of basin development, arguing that the GGFZ lay dormant during the Mesozoic (Underhill, Reference Underhill1991). However, the GGFZ and related structures may have helped to partition active extension in the Moray Firth region from relative inactivity in the Pentland Firth area (Thomson & Underhill, Reference Thompson, Underhill and Parker1993; Dichiarante et al., Reference Dichiarante, Holdsworth, Dempsey, Selby, McCaffrey, Michie, Morgan and Bonniface2016).
The GGFZ resumed activity as a divergent wrench structure as part of limited oblique slip in the Tertiary Alpine Orogeny, probably contemporaneous with uplift of the Scottish Highlands during Paleocene–Eocene northeast Atlantic rifting (Underhill, Reference Underhill1991) or Oligo-Miocene tectonics (Thomson & Underhill, Reference Thompson, Underhill and Parker1993; Underhill & Brodie, Reference Underhill and Brodie1993). More recently, field observations of Jurassic outcrops in northeast Scotland and their ‘beef’ structures suggest right-lateral reactivation of the order of 10–18 km during the Late Eocene to late Oligocene, c. 37–26 Ma (Le Breton et al., Reference Le Breton, Cobbold and Zanella2013).
The Late Jurassic–Early Cretaceous Faulting event 2 IAA age therefore suggests that the Sronlairig Fault was only subject to low-temperature frictional heating and low-temperature fluid flow during the Tertiary period. The drive of the right-lateral reactivation of the GGFZ and the heat provided by the Iceland mantle plume were clearly insufficient to reset the 1M illite component of the Sronlairig Fault gouge.
Conclusions
Fault cores and their component fault rocks are very rarely preserved in natural exposures, and especially so in the Scottish Highlands, where differential erosion along faults and the degree of vegetation act together to often completely obscure such features. Temporary exposures therefore provide important opportunities to interrogate regionally important tectonic frameworks.
By employing novel capillary XRD analysis techniques to facilitate polytype identification and quantification, IAA of gouge from the Sronlairig Fault has revealed two event ages of 296 ± 7 and 145 ± 7 Ma, respectively.
We suggest that the earlier age may either represent resetting of the wall rock-derived Sronlairig Fault micas or growth of authigenic 2M 1 illite-muscovite during Late Carboniferous–Early Permian dextral displacement of structures related to the GGFZ. The Late Jurassic–Early Cretaceous age coincides with possible dextral movements along the GGFZ and related structures, helping to partition active extension in the Moray Firth region from relative inactivity in the Pentland Firth area.
These new age dates therefore record younger parts of the record of the long-lived activity on the GGFZ. In contrast to the offshore region where the Mesozoic to Cenozoic lithostratigraphy provides good constraints for deformation superimposed on those successions, the absence of these younger successions onshore means that such constraints are lacking in those regions. However, movements associated with the GGFZ are unlikely to have been restricted to the Moray Firth region at this time. These new data and this methodology reveal important new insights into an integrated regional-scale record of tectonic displacement in the GGFZ that has the potential to link the onshore and offshore domains.
Author ORCIDs
Simon J. Kemp, 0000-0002-4604-0927
Acknowledgements
Ian Mounteney (British Geological Survey; BGS) is thanked for his assistance with sample preparation and size fractionation for this study. Jeremy Rushton (BGS) assisted with the SEM examination. Andrew Todd (Commonwealth Scientific and Industrial Research Organisation; CSIRO) is acknowledged for his technical assistance with the K–Ar analysis. HZ (formerly CSIRO, now Kyoto University) set up and supervised the K–Ar analysis at CSIRO, Perth, Australia. We thank Espen Torgersen, Martin Smith and two anonymous reviewers for their helpful comments that considerably improved this manuscript. SJK, MRG, GAL and SDGC publish with the permission of the Executive Director, BGS (UK Research and Innovation).


 Open access