


I. INTRODUCTION
Cu–Zn alloys are widely used as industrial materials because of their excellent characteristics such as non-magnetic, high corrosion resistance, and good machinability. With the development of the industry, higher strength is a common requirement for metallic materials. In the past decades, there have been two kinds of metal materials according to different strengthening mechanisms. The first kind is aging precipitation strengthening alloys (APSAs), which have benefited from a high number of nanoscale precipitates that significantly strengthen the alloys without sacrificing the electrical conductivity. For example, Cu–Cr alloys precipitate dispersive Cr particles. Reference Chatterjee, Mitra, Chakraborty, Rotti and Ray1–Reference Zhang, Tian, Volinsky, Chen, Sun, Chai, Liu and Liu3 The addition of Zr, Ni, and Si elements precipitates Cu5Zr and Ni2Si particles to strengthen the alloy. Reference Yong, Xia, Wang, Li, Xiao, Wei, Sheng, Jia and Chen4 Moreover, adding elements of Ni, Al, and Si precipitates Ni3Al and Ni2Si particles which contributed to a strong strengthening effect. Reference Shen, Zhou, Dong, Zhu and Chen5 Thus, APSAs are one of the most important alloys in metallic materials research field. Reference Chen, Wu, Zhang, Zhang, Shi and Li6–Reference Chen, Shen, Luo, Wang, Li and Zhang9 The second kind of strengthened metallic materials is solid solution strengthened alloys (SSSAs). A metallic matrix is composed by adding one or more alloying elements, such as adding Zn to Cu in Cu–Zn alloys, Reference Liu, Xu, Nie, Ren and Yuan10 and Zn to Al in Al–Zn alloys. Reference Cui, Oikawa, Kainuma and Lshida11 SSSAs usually have lower strength and electrical conductivity than APSAs, but SSSAs are easier to be processed, and the production costs of SSSAs are much lower than those of APSAs. A great number of nanoscale precipitates with an L12-type ordered structure were formed in the Cu–Zn–Ni–Al alloy after aging treatment. Reference Zhou and Su12 Many researchers have previously focused on the precipitation behavior in APSAs as opposed to the solute atom dislocation pinning behavior in SSSAs. These studies have been used to enhance their combination properties such as hardness, tensile strength, yield strength, ductility, machinability, and corrosion resistance. Reference Zhou and Su12–Reference Li, Barrirero, Sha, Aboulfadl, Mücklich and Schumacher17 However, investigations on the morphology, precipitation, and strengthening of an alloy with both aging hardening and solid solution hardening still require more extensive explorations.
Recently, Ni–Si compounds in Cu–Ni–Si alloys attracted much interest due to their significant strengthening effect. Reference Lei, Li, Wang, Xie, Chen, Li, Gao and Li18–Reference Lockyer and Noble23 In this work, we try to explore the effect of Ni and Si on the microstructure and properties in Cu–Zn alloys. Microstructure, mechanical properties, precipitation behavior, as well as the strengthening mechanisms of Cu–Zn alloys with and without Ni and Si will be studied in detail to explore a new strategy to develop high strength brass alloys.
II. EXPERIMENTAL PROCEDURE
The nominal mass percent compositions of the studied alloys are Cu–10Zn, Cu–20Zn, Cu–10Zn–1.5Ni–0.34Si, and Cu–20Zn–1.5Ni–0.34Si. Electrolytic copper blocks (4N, purity of 99.99%), zinc granules (4N), nickel granules (4N), and silicon pieces (4N) were prepared and melted in a medium frequency induction furnace. Then, the melt was gravity cast in an iron mold with a dimension of 150 × 70 × 35 mm. Both the top and the bottom surfaces of the as-cast ingots were machined to remove the surface defects. Furthermore, the as-cast ingots were heat treated at 900 °C for 2 h and then, they were cut into several strips with a thickness of 25 mm. Some of the strips were cold rolled by 80% and then aged at 350 °C for various durations.
The microhardness measurements were carried out on an HV-5 type microhardness tester (Laizhou Huayin Testing Instrument Co. Ltd., Laizhou, China) with a load of 20 N and a loading time of 10 s. At least seven values were taken for the average hardness. Room temperature tensile tests were performed using an Instron 8019 tester machine (Instron, Norwood, Massachusetts) with a constant strain rate of 10−3 s−1. The optical microscopy specimens were etched with a solution including K2CrO4, sulfuric acid, hydrochloric acid, and distilled water. Optical observations were carried on a Leica optical microscope (Leica Microsystems, Wetzlar, Germany). The scanning electron microscopy (SEM) observations were carried on a Sirion 200 scanning electron microscope (FEI Company, Hillsboro, Oregon), and the energy-dispersive X-ray spectroscopy (EDS) analyses of the experimental alloy were performed simultaneously using the same scanning electron microscope equipped with energy-dispersive X-ray spectrum detector. The transmission electron microscopy (TEM) samples were prepared by dual-jet electropolishing technique with a solution containing 20% nitric acid and 80% methanol; the operation temperature was −35 ± 2 °C. TEM observations were carried out on a TECNAI G2 F20 transmission electron microscope (FEI Company) with an operation voltage of 200 kV.
III. RESULTS
A. Microstructure
The micrographs of the as-cast studied alloy ingots are shown in Fig. 1. Cu–10Zn and Cu–20Zn alloys showed faint dendrites in the grains [Figs. 1(a) and 1(c)], while both the Cu–10Zn–1.5Ni–0.34Si and the Cu–20Zn–1.5Ni–0.34Si alloys presented developed dendrites structure [Figs. 1(b) and 1(d)]. Moreover, the dendrite arm spacing in the Cu–20Zn–1.5Ni–0.34Si alloy was larger than that in the Cu–10Zn–1.5Ni–0.34Si alloy. Some precipitates were detected in the Cu–10Zn–1.5Ni–0.34Si alloy, as shown by the arrows in Fig. 1(b), and these intermetallic compounds were Ni2Si and Ni3Si. Reference Lei, Li, Dai, Wang, Chen, Xie, Yang and Chen24 EDX measurements were performed on the as-cast Cu–10Zn–1.5Ni–0.34Si alloy to determine the element distribution. The elemental distributions of Cu, Ni, Si, and Zn elements are shown in Fig. 2. Some dark gray and sub-spheroidal particles were detected in the Cu–10Zn–1.5Ni–0.34Si alloy. According to the EDS results [Fig. 2(b)], spheroidal particles were rich in Ni and Si, and the atomic ratio of Ni/Si was close to 2/1. Thus, the spheroidal particles were Ni2Si. Whereas, EDS analysis of the matrix marked by the blue dotted line square frame in Fig. 2(a) reveals a Zn content of 10.39 wt% [Fig. 2(c)], which indicates that the Zn element was dissolved homogeneously in the Cu matrix.

FIG. 1. Optical microstructure obtained from the as-cast alloys: (a) Cu–10 Zn; (b) Cu–10Zn–1.5Ni–0.34Si; (c) Cu–20Zn; and (d) Cu–20Zn–1.5Ni–0.34Si.

FIG. 2. SEM micrographs and EDS results of the as-cast Cu–10Zn–1.5Ni–0.34Si alloy. (a) Secondary electron image; (b) corresponding EDS and element content in the rectangle area “A” in (a); and (c) corresponding EDS and element content in the rectangle area “B” in (a).
B. Precipitation
For the binary Cu–Zn alloys, Zn elements were solute atoms in the matrix. Figure 3 shows the microstructure evolution of the Cu–10Zn alloys having been annealed at 350 °C for various durations. After annealing for the time range from 15 min to 240 h, there are no precipitates detected in the sample. The addition of Ni and Si in the studied alloys would change the phase behaviors. Ni2Si is a dominant strengthening phase in the previous Cu–Ni–Si alloys. It has an orthorhombic structure in the space group of Pbnm (62), with the structure parameters as follows: a = 0.706 nm, b = 0.499 nm, and c = 0.372 nm. Reference Hussein and Abd25 TEM images and the corresponding selected-area diffraction patterns (SADPs) of the solution treated Cu–10Zn–1.5Ni–0.34Si alloy sample after aging at 350 °C for different durations are presented in Fig. 4. When the sample was aged at 350 °C for 15 min, a great number of nanoscale precipitates were observed [Fig. 4(a)]. While the sample was aged for 10 h, these precipitates slowly grew up to about 8 nm [Fig. 4(b)]. With further aging for 240 h, these precipitates grew up to 22 nm [Fig. 4(d)]. Many rod-shaped and disc particles were observed. The diffraction spots from δ-Ni2Si precipitates occurred clearly in their corresponding SADP with the electron beam parallel to [001]Cu [Fig. 4(c)]. The indexation result indicated that the crystal orientation relationship between the matrix and δ-Ni2Si precipitates was (001)Cu‖(001)δ, [110]Cu‖[100]δ. The disk’s plane of δ-Ni2Si precipitates was parallel to the electron beam and the (110)Cu plane. The lattice parameters of δ-Ni2Si and the orientation relationship between δ-Ni2Si and Cu matrix also would be obtained from the high-resolution electron microscopy (HREM) images [Fig. 4(e)]. From the fast Fourier transform (FFT) algorithm pattern, it is also found that single precipitate did not elongate along the diameter direction, whereas it elongated along the thickness direction [Fig. 4(f)]. Figure 5 shows TEM images and the corresponding SADPs of the solution treated Cu–20Zn–1.5Ni–0.34Si samples after aging at 350 °C for different durations. As same as the Cu–10Zn–1.5Ni–0.34Si alloy, the particles precipitating out from the Cu–20Zn–1.5Ni–0.34Si alloy were also δ-Ni2Si, and they coarsened with increasing the aging duration [Figs. 5(a), 5(b), 5(d), and 5(e)]. However, the size and coarsening rate of the particles in the Cu–20Zn–1.5Ni–0.34Si alloy are quite different from those of the Cu–10Zn–1.5Ni–0.34Si alloy. The average size of δ-Ni2Si was about 7 nm, 25 nm, and 43 nm when aged at 350 °C for 15 min, 10 h, and 240 h, respectively (Fig. 5). Both the average diameter and the thickness of δ-Ni2Si phases in the Cu–20Zn–1.5Ni–0.34Si alloy were larger than that in the Cu–10Zn–1.5Ni–0.34Si alloy after aging treatment at the same condition as seen from the TEM images.

FIG. 3. TEM images and SADP of the Cu–10Zn alloy supersaturated solid solution aged at 350 °C for various durations. (a) 15 min; (b) 10 h; (c) 240 h; (d) SADP of (c), beam along the zone axis of [001]Cu.

FIG. 4. TEM bright-field micrographs and SADPs of the Cu–10Zn–1.5Ni–0.34Si alloy after solution treatment, cold rolled by 80%, and then aged at 350 °C for different times. (a) 15 min; (b) 10 h; (c) SADP of (b), the beam direction of SADP along [001]Cu; (d) 240 h; (e) HRTEM of (d), the beam direction of SADP along [001]Cu; and (f) corresponding FFT pattern of (e).

FIG. 5. TEM bright-field micrographs and SADPs of Cu–20Zn–1.5Ni–0.34Si alloy after solid solution treatment, cold rolled by 80%, and then aged at 350 °C for different times. (a) 15 min; (b) 10 h; (c) SADP of (b); (d) 240 h; (e) HRTEM image of (b); and (f) corresponding FFT pattern of (e) along [001]Cu.
C. Properties
Figure 6 showed the aging hardening response curves and the electrical conductivity variations of the studied alloys after solution treatment, cold rolled by 80%, and then aged at 350 °C. Before the aging treatment, the hardness of the Cu–10Zn alloy was 180.2 HV, while that of the Cu–10Zn–1.5Ni–0.34Si alloy was 201.7 HV. The addition of Ni and Si increased the initial hardness of the Cu–Zn alloys before aging treatment due to the solid solution strengthening effect. With the increase of the aging time, the hardness of the Cu–10Zn alloy was decreased, while the hardness of the Cu–10Zn–1.5Ni–0.34Si alloy was increased at first and then decreased with the aging time. The hardness decrease in the Cu–10Zn alloy was due to the annealing soften, while the hardness increase in the Cu–10Zn–1.5Ni–0.34Si alloy was due to the precipitation strengthening. The two Cu–10Zn–1.5Ni–0.34Si and Cu–20Zn–1.5Ni–0.34Si alloys exhibited strong hardening responses after aging treatment, as seen in Fig. 6(a). The peak hardness of the Cu–10Zn–1.5Ni–0.34Si alloy was 212.1 HV (which was observed after 15 min), and the peak hardness of the Cu–20Zn–1.5Ni–0.34Si alloy was 270.6 HV (which was observed after 30 min). In comparison, the hardness peak of the Cu–10Zn alloy was 180.2 HV (before aging) and that of the Cu–20Zn alloy was 195.0 HV (before aging). For the studied alloy, the electrical conductivity values showed same trends. The Cu–10Zn and Cu–20Zn alloys present high electrical conductivity of 39% IACS (International Annealed Copper Standard) and 28.4% IACS [Fig. 6(b)]. The addition of Ni and Si in the Cu–10Zn and Cu–20Zn alloys reduced the electrical conductivity due to the lattice distortion and electron scattering by solute atoms in the copper matrix. Within the aging treatment process, the electrical conductivity of the Cu–10Zn–1.5Ni–0.34Si and Cu–20Zn–1.5Ni–0.34Si alloys increased rapidly in the initial stages of aging when solute atoms were precipitated from the supersaturated solution. Further prolonging the aging time, the electrical conductivity reached a stable value and then increased slightly. As a type of solid solution strengthening copper alloy, the Cu–10Zn and Cu–20Zn alloys have no precipitated strengthening phases after aging treatment; thus, there is no precipitation behavior can change the conductivity apparently. While in the Cu–10Zn–1.5Ni–0.34Si and Cu–20Zn–1.5Ni–0.34Si alloys, the solid solution atoms of Ni and Si were precipitated as Ni2Si precipitates, the decrease of solutes would lead to a low electrical resistance.

FIG. 6. The hardness and electrical conductivity of studied alloys after solution treatment, cold rolled by 80%, and then aged at 350 °C for different durations. (a) Vickers hardness; (b) electrical conductivity.
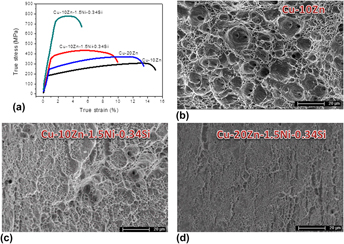
Figure 7 gives the stress–strain curves and fracture of the studied alloy samples having been aged at 350 °C for 15 min. For the Cu–10Zn and Cu–20Zn alloys, they showed high elongations of 16.1% and 13.2%, while their tensile strengths were 306.1 MPa and 373.2 MPa, respectively. However, in the Cu–10Zn–1.5Ni–0.34Si and the Cu–20Zn–1.5Ni–0.34Si alloys, they showed a significant incremental increase in tensile strength, 437.8 MPa for the Cu–10Zn–1.5Ni–0.34Si alloy and 776.4 MPa for the Cu–20Zn–1.5Ni–0.34Si alloy. In the meantime, their elongations were only 8.3 and 5.4%. Physical properties of studied alloy were summarized in Table I. The precipitated particles Ni2Si were very hard and broke away from matrix grains. Shallow dimples formed on the fracture and as a result, a quasi-cleavage fracture with shallow dimples appeared in the Cu–10Zn–1.5Ni–0.34Si and Cu–20Zn–1.5Ni–0.34Si alloy samples. As the alloy aged at 350 °C for 15 min, some deep dimples appeared in the Cu–10Zn alloy [Fig. 7(b)]. Figures 7(c) and 7(d) presented the fracture surface of tensile samples from the Cu–10Zn–1.5Ni–0.34Si and the Cu–20Zn–1.5Ni–0.34Si alloys. The shallow dimple and quasi-cleavage fracture occurred in the Cu–10Zn–1.5Ni–0.34Si and the Cu–20Zn–1.5Ni–0.34Si alloys. The addition of Ni and Si affected the fraction of the quasi-cleavage morphology.

FIG. 7. (a) True stress–true strain curves of studied alloys after solution treatment, cold rolled by 80%, and then aged at 350 °C for 15 min; and fractures of the tensile sample of (b) Cu–10Zn alloy; (c) Cu–10Zn–1.5Ni–0.34Si alloy; and (d) Cu–20Zn–1.5Ni–0.34Si alloy.
TABLE I. Mechanical properties of studied alloys and other Cu–Zn system alloys.

IV. DISCUSSION
A. Strengthening mechanism
Four main strengthening mechanisms contributing to the high strength of the studied alloys are discussed here: work hardening, precipitation strengthening, grain boundary strengthening, and solid solution strengthening.
(i) Orowan strengthening: Some of the yield stresses of the Cu–10Zn–1.5Ni–0.34Si and Cu–20Zn–1.5Ni–0.34Si alloys were due to the δ-Ni2Si particles, which contributed by an Orowan mechanism. Reference Lockyer and Noble26 The incremental increase in strength for the Cu–10Zn–1.5Ni–0.34Si and the Cu–20Zn–1.5Ni–0.34Si alloys is due to precipitation strengthening. The incremental increase in the strength by the nanoscale precipitate particles after the aging treatment can be examined by the Orowan mechanism, Reference Mabuchi and Higashi27,Reference Lei, Li, Zhu, Qiu and Liang28
 $$\Delta {\sigma _{{\rm{Orowan}}}} = {{0.81MGb} \over {2\pi {{(1 - \nu )}^{{\rm{1/2}}}}}}{{\ln \left( {{{{d_{\rm{p}}}} \mathord{\left/ {\vphantom {{{d_{\rm{p}}}} b}} \right. \kern-\nulldelimiterspace} b}} \right)} \over {\left( {\lambda - {d_{\rm{p}}}} \right)}}\quad ,$$
where G is the shear modulus of the pure copper matrix (45.5 GPa). M is the Taylor-factor for fcc-Cu (3.1). d p is the mean diameter of δ-Ni2Si particles. ν was the Poisson’s ratio for Cu (0.34). b was the Burgers vector for Cu (0.255 nm). Moreover, λ was the apparent inter-particle spacing which is given by Reference Le Roy, Embury, Edward and Ashby29
 $$\lambda = {1 \over 2}{d_{\rm{p}}}\sqrt {{{3\pi } \over {2{f_{\rm{v}}}}}} \quad ,$$
where f v is the volume fraction of δ-Ni2Si particles. All of the Ni and Si atoms were considered to be precipitated in the form of δ-Ni2Si precipitates. The volume fraction of δ-Ni2Si precipitates was 0.022. So the incremental increase in ΔσOrowan depending on d p for studied alloys was calculated with Eqs. (1) and (2), and ΔσOrowan for studied alloys can be written as follows:
 $$\Delta {\sigma _{{\rm{Orowan}}}} = {{903\ln {d_{\rm{p}}} + 1233} \over {{d_{\rm{p}}}}}\quad .$$
(ii) Solution strengthening: solution strengthening is an important strengthening mechanism in the Cu–10Zn and the Cu–20Zn alloys, as well as in the Cu–10Zn–1.5Ni–0.34Si alloy and the Cu–20Zn–1.5Ni–0.34Si alloy. The addition of Ni and Si increased the initial hardness of studied alloys due to solid solution strengthening. Solid solution strengthening is a powerful method to improve the strength of a material. The strength imparted by the alloying elements was dependent on the relative difference in size between the solute and solvent. A large difference in the size creates more distortion of the crystalline lattice, which impedes dislocations motion, resulting in higher strength. The equation written by Vöhringer Reference Vohringer30 was applied to explain the solid solution strengthening as a consequence of the addition of Zn, Ni, and Si. It is written as follows:
 $$\Delta \sigma = M \times \left( {{G \over {550}}} \right){\varepsilon ^{{4 \mathord{\left/ {\vphantom {4 3}} \right. \kern-\nulldelimiterspace} 3}}}{c^{{2 \mathord{\left/ {\vphantom {2 3}} \right. \kern-\nulldelimiterspace} 3}}}\quad ,$$
where G was the shear modulus, which could be approximately considered as to be equal to that of pure copper (45.5 GPa), c was the solute mole fraction, and
 $$\varepsilon = \sqrt {{{\left( {15{\varepsilon _{\rm{b}}}} \right)}^2} + {{\left( {{{2{\varepsilon _{\rm{G}}}} \over {2 + \left| {{\varepsilon _{\rm{G}}}} \right|}}} \right)}^2}\quad ,}$$
where εb was the atomic size misfit, εG was the modulus misfit, which was given by εb = (1/a)(da/dc), and εG = (1/G)(dG/dc).
(iii) Work hardening: higher the dislocation density, the higher the flow stress (strength). Taylor’s law predicted a linear relationship between the flow stress and the square root of the dislocation density (ρdislocation), expressed as follows: Reference Lilleodden and Nix31
 $$\Delta {\sigma _{{\rm{H - P}}}} = {K_{{\rm{Taylor}}}}\sqrt {{\rho _{{\rm{dislocation}}}}} \quad .$$
(iv) For grain boundary strengthening, the strength increment, σ y , can be expressed using a Hall–Petch relation Reference Hall32–Reference Hansen34
 $$\Delta {\sigma _{{\rm{H - P}}}} = {\sigma _0} + {K_{{\rm{H - P}}}}\sqrt d \quad ,$$
where σ0 is the frictional stress, K H–P is Hall–Petch coefficient as a measure of the effect of surrounding grains on the resistance to flow, and d is the average grain size. The Hall–Petch coefficient of a copper alloy is K y = 0.11 MPa m1/2 and the lattice friction stress is σ0 = 25 MPa. Reference Smith and Hashemi35
B. Conductivity mechanism
The electrical conductivity of the copper alloy mainly depended on the purity of the copper matrix. Reference Xia, Zhang and Kang36 When alloy elements were added into the copper matrix, the solute atoms could cause lattice distortion of the Cu-crystal lattice, the scattering of electron increased. Accordingly, the electrical resistance increased. Furthermore, when the Cu–10Zn–1.5Ni–0.34Si and the Cu–20Zn–1.5Ni–0.34Si alloys were heat treated at 350 °C, Ni and Si atoms were precipitated from the copper matrix (Figs. 5 and 6). The electron scattering of Cu alloy decreased with the increase of precipitation of Ni and Si from the matrix, which benefited to the enhancement of the electrical conductivity of the studied alloys. Reference Liu, Shao, Liu, Yang and Lu37
C. Properties comparison
Cu–Zn system alloys were named as brass alloys, which have wide applications. The concentrations of the Zn element were ranged from 10% to 50% with different structures and properties. Table I listed some Cu–Zn alloys with different mechanical properties. Reference Zhou and Su12,Reference Xia, Zhang and Kang36–Reference Imai, Li, Kondoh, Kosaka, Okada, Yamamoto, Takahashi and Umeda40 With the increase of Zn concentration, the tensile strength increased accordingly. The addition of the third component would improve the tensile strength, Reference Zhang, Duan, An, Wu, Yang and Zhang38,Reference Imai, Li, Kondoh, Kosaka, Okada, Yamamoto, Takahashi and Umeda40 as well as severe plastic deformation (equal channel angular pressing, ECAP) would also increase the tensile strength of the investigated alloys. Reference Zhou and Su12 In this work, Ni and Si were added to Cu–10Zn and Cu–20Zn alloys; results demonstrated that their tensile strengths had been significantly improved and their elongations were reduced to a certain extent. In this study, experimental results revealed that the addition of Ni and Si played a positive role in refining the microstructure and improving the mechanical properties of Cu–Zn alloys. Compared with those Cu–Zn alloys reported in Refs. Reference Zhou and Su12, Reference Zhang, Duan, An, Wu, Yang and Zhang38–Reference Imai, Li, Kondoh, Kosaka, Okada, Yamamoto, Takahashi and Umeda40, the elongations of the designed alloys in the present work are smaller. This is mainly attributed to the effect of the addition of Ni and Si. Ni and Si can form as Ni2Si particles and precipitate during aging treatment. They can effectively block the dislocation motion. Dislocation pile-up appears locally, leads to stresses concentrating, and passes by or cuts the very hard precipitated particles Ni2Si. Thus, fracture happens and a small elongation will be obtained in the samples.
V. CONCLUSIONS
In summary, four kinds of Cu–Zn alloys with and without Ni and Si were synthesized, and effects of the addition of Ni and Si elements on the microstructure and mechanical properties of the studied alloys have been systematically investigated. The addition of Ni and Si refined the microstructure of as-cast and solid solution treatment specimens. After solid solution treatment, cold rolled by 80%, and then aged at 350 °C for 15 min, the Cu–20Zn–1.5Ni–0.34Si alloy showed a hardness of 262.2 HV, a tensile strength of 776.4 MPa, a yield strength of 718 MPa, an elongation of 5.4%, and an electrical conductivity of 23.4% IACS. A great deal of δ-Ni2Si precipitates was detected in the Cu–20Zn–1.5Ni–0.34Si alloy after aging treatment. It was found that Orowan precipitation strengthening is the main strengthening mechanism and the Cu–20Zn–1.5Ni–0.34Si alloy presented outstanding performances among Cu–Zn system alloys.
ACKNOWLEDGMENTS
The work is financially supported by the National Key Technology K&D Program (2014BAC03B08) and the National Key Research and Development Program of China (2016YFB0301300).


