

Introduction
In a 1977 ABC News Special entitled Sex for Sale: The Urban Battleground, Howard K. Smith concluded a segment with the following:
Commercial sex is often called a victimless crime. We have shown that a glomeration of sex businesses, in fact, have many victims. Residents move out of the areas from fear, customers desert legitimate shops which have to sell out at a loss. City dwellers are victimized by having to pay more taxes to make up for the areas that are in arrears because of sex businesses. In the spreading decay, muggers, dope pushers move in. It's harder to spot their crimes in a general sea of rot. Police and courts tend to give up. Civilization living by rules moves out and we're all victims. Better solutions may emerge, but for now the Detroit plan is the best in sight. Leave aside individual arrests for obscenity, which the law seems to have an impossible time defining. Pass a zoning law allowing no sex-related establishment or service to exist within three blocks, say, of any other. Let none become the nucleus for a cancerous spread.
In the summer of 1976, the city of Detroit, Michigan introduced zoning laws designed to break up the concentrated areas containing sex-related “adult” businesses.Footnote 1 The assumption driving the dispersion of concentrated adult businesses was the presumed negative “secondary effects” of these businesses on the surrounding neighborhood. Enthusiasm for the Detroit zoning approach quickly spread to other cities.
This diffusion of the Detroit zoning approach throughout the nation over the last 25 years has produced a continuing history of constitutional litigation. Since 1976, the Supreme Court has decided a series of cases focusing on whether the free speech clause of the First Amendment allows cities and states to enact legislation controlling the location of adult businesses on the basis of presumed negative secondary effects.Footnote 2
The Court's Presumption of Adverse Secondary Effects
The rationale for the secondary effects doctrine was most completely laid out in Renton v. Playtime Theatres, Inc., in 1986. In Renton, the Supreme Court considered the validity of a Renton municipal ordinance that prohibited any adult theater from locating within 1,000 feet of any residential zone, family dwelling, church, park, or school. The Court's analysis of the ordinance proceeded in three steps. First, the Court found that the Renton ordinance did not ban adult theaters altogether, but merely required that they be a certain distance from so-called “sensitive locations.” The ordinance, the Court said, was properly considered to be a time, place, and manner regulation. The Court next considered whether the ordinance was content neutral or content based. If the regulation were content based, it would be considered presumptively invalid and subject to the “strict scrutiny” standard. The Court held, however, that the ordinance was not aimed at the content of the films shown at adult theaters, but rather at the secondary effects of such theaters on the surrounding community, namely at crime rates, property values, and the quality of the city's neighborhoods. Given this finding, the Court stated that the ordinance would be upheld as long as the city of Renton showed that its ordinance was designed to serve a substantial government interest such as a reducing crime rates or maintaining property values.
Further, in Renton the Court stated, for the first time, that a city interested in restricting the operation of adult businesses was not required to show adverse impact from operation of adult theaters in its own community if no data on adverse impacts existed, but could instead rely on findings of impacts from other cities as a rationale for supporting passage of an ordinance. The Court ruled that Renton could rely on the experiences of and studies produced by the nearby city of Seattle as evidence of a relationship between adult uses and negative secondary effects. Thus, the Court ruled that the First Amendment does not require a city to conduct new studies or produce new evidence before enacting an ordinance, as long as the evidence relied upon is reasonably believed to be relevant to the problem the city faces.
Since Renton, a number of cities, counties, and states have undertaken investigations designed to establish the presence of such secondary effects and their connection to adult facilities. These studies have, in turn, been shared with other municipalities and generally serve as the basis for claims that adult entertainment establishments are causally related to harmful secondary side effects, such as increased crime and decreases in property values. Many local governments have relied on this body of information as evidence of the secondary effects of adult businesses. Further, in most cases, cities and other governmental agencies have used the findings of a core set of studies from other locales as a rationale for instituting regulation of such businesses in their own communities.
In more recent years, the Court has considered the constitutionality of anti-nudity ordinances passed by municipalities or states that have relied on negative secondary effects to justify the legislation.Footnote 3 In a fractured decision issued in 1991, the Court in Barnes v. Glens Theatre Inc. held that the state of Indiana could regulate public nudity.Footnote 4 Justice Souter in a concurring opinion ruled that the government could undertake such regulation on the basis of the presumed negative secondary effects on the surrounding community.Footnote 5
In the 2000 decision City of Erie v. Pap's A.M., the Court again held that municipalities have the right to pass anti-nudity ordinances on the assumption that nudity is associated with adverse secondary effects such as crime.Footnote 6 Again, the Court was fractured; however, three justices agreed with Justice O'Connor's opinion that in conformity with Justice Souter's concurrence in Barnes, combating negative secondary effects associated with adult businesses was a legitimate basis for the imposition of anti-nudity regulations.
Most notable for our purposes, however, was Justice Souter's partial concurrence and partial dissent in the Pap's decision. He significantly revised the position he took regarding the assumption of secondary effects in Barnes. In Pap's, Justice Souter said he was now of the opinion that the evidence of a relationship between adult businesses and negative secondary effects is at best inconclusive.Footnote 7 He called into question the reliability of past studies that purported to demonstrate these effects and suggested that municipalities wishing to ban nudity must show evidence of a relationship between adult businesses and negative effects.Footnote 8
Most recently (2002) Justice O'Connor, joined by the Chief Justice, Justice Scalia, and Justice Thomas (with Justice Kennedy's concurrence) concluded that the city of Los Angeles may reasonably rely on its 1977 study to demonstrate that its present ban on multiple-use establishments serves the city's interest in reducing crime. In City of Los Angeles v. Alameda Books, Inc., et al., the Court maintained that it was “reasonable for Los Angeles to suppose that a concentration of adult establishments is correlated with high crime rates because a concentration of operations in one locale draws, for example, a greater concentration of adult consumers to the neighborhood, and a high density of such consumers either attracts or generates criminal activity.” Justice Kennedy, whose opinion may be the controlling one in the case, reiterated the assumption that adult businesses cause negative secondary effects. In his opinion in Alameda he asserts, “municipal governments know that high concentrations of adult businesses can damage the value and integrity of a neighborhood. The damage is measurable; it is all too real.” The Court held that a municipality may rely on any evidence that is reasonably believed to be relevant for demonstrating a connection between speech and a substantial, independent government interest.
However, the plurality added an important methodological caveat concerning the evidence necessary to validate the assumption that adult businesses cause secondary effects. The Court warned:
“This is not to say that a municipality can get away with shoddy data or reasoning. The municipality's evidence must fairly support its rationale for its ordinance. If plaintiffs fail to cast direct doubt on this rationale, either by demonstrating that the municipality's evidence does not support its rationale or by furnishing evidence that disputes the municipality's factual findings, the municipality meets the Renton standard. If plaintiffs succeed in casting doubt on a municipality's rationale in either manner, the burden shifts back to the municipality to supplement the record with evidence renewing support for a theory that justifies its ordinance.”
Empirically Testing the Assumption of Secondary Effects from Adult Businesses
Justice Souter, joined by Justice Ginsburg, Justice Breyer, and Justice Stevens, took the admonishment by the plurality in Alameda that municipalities cannot rely on methodologically frail demonstrations of secondary effects a step further. Justice Souter faulted the city of Los Angeles because the city did not demonstrate that its theory that regulation requiring adult establishments disburse and be operated as free standing businesses will reduce crime. Justice Souter asked the city to demonstrate, not merely by appeal to common sense but also with empirical data, that adult businesses are associated with crime and that its ordinance will successfully lower crime.
In fact, Justice Souter claims that the only way to avoid a zoning ordinance such as that passed in Los Angeles from being unconstitutional due to the lack of content neutrality, a requirement set out in Renton, is to conduct empirical evaluations of whether such effects, assumed in the past, actually exist. He notes in Alameda:
“(the) risk of viewpoint discrimination is subject to a relatively simple safeguard, however. If combating secondary effects of property devaluation and crime is truly the reason for regulation, it is possible to show by empirical evidence that the effects exist, that they are caused by the expressive activity subject to zoning, and that the zoning can be expected either to ameliorate them or to enhance the capacity of the government to combat them…”
The Present Study
The first purpose of the present study is to conduct the type of empirical study demanded by Justice Souter and noted to be relevant by Justice O'Connor and the other justices in Pap's. Also, it is designed to avoid the collection of “shoddy data” or the use of (shoddy) “reasoning” as demanded in Alameda Books, in order to determine if a relationship exists between adult businesses and negative secondary effects, or whether, as Justice Souter has contended, such a relationship must not be assumed. Further, this evidence is obtained in accordance with established methodological procedures so as to insure a high level of scientific reliability.
Past studies claim to have found crime but lack the essential methodological features necessary to validly make such a claim. Reference Paul, Linz and ShaferPaul, Linz, and Shafer (2001) found numerous problems among the most frequently cited studies by communities across the United States. For example, the Indianapolis, Indiana study (1986) failed to properly match study and control areas on variables, the Phoenix, Arizona study (1979) relied on crime data collected for only a one-year period, and in the Los Angeles study (1977) authors admitted that the police stepped up surveillance of adult businesses during the study period. Each of these methodological problems severely limits the utility of these studies.Footnote 9
More recently, Reference Linz and PaulLinz and Paul (2002) have undertaken an exami-nation of adult cabarets in the city of Fort Wayne, Indiana, that serve alcoholic beverages and that provide exotic entertainment wherein dancers are required to wear pasties and G-strings. Unlike previous studies conducted in other municipalities, specific attention was given to developing an empirical approach that fulfilled the requirements set out by the Supreme Court for the proper conduct of a social scientific inquiry. A 1000-foot circumference surrounding each of eight exotic dance nightclubs in Fort Wayne was established. Comparison areas were selected in Fort Wayne and matched to the club areas on the basis of demographic features associated with crime and commercial property composition. The number of calls to the police from 1997 to 2000 in the areas surrounding the exotic dance nightclubs was compared to the number of calls found in the matched comparison areas. The analysis showed little difference, overall, between the total number of calls to the police reported in the areas containing the exotic dance nightclubs and the total number of offenses reported in the comparison areas.
The present study is also informed by two related bodies of thought about crime and place, social disorganization theory, and routine activity/crime opportunity theory. The second purpose of this study is to examine the impact of adult businesses in a local community in light of these perspectives. These approaches point to variables that predict the frequency and location of criminal activity in a community. This set of ideas is also especially relevant here, first, because they are the implicit theories employed by municipalities addressing the problem of adverse secondary effects, second, because they suggest a number of other variables, predictive of crime events, that must be considered as control variables in any study of the impact of adult businesses on crime, and finally, because these variables have been successful as predictors of crime events.
Routine Activities/Crime Opportunity Theory
While perhaps not the ideal forum for the examination of criminological theory, investigating the secondary effects of adult bars as a stimulus for crime addresses a current and pressing legal policy issue. City planners and other representatives of local governmental bodies have explicitly claimed that adult businesses are associated with crime and disorder and have theorized that the presence of an adult business in a localized area increases the concurrence of offenders motivated to commit crimes together with suitable targets for the crimes.
In Phoenix, for example, the city adopted a zoning ordinance whose restriction of adult business to within 500 or 1000 feet of sensitive land uses such as churches, schools, and daycare centers is predicated on the idea that the presence of adult businesses attracts persons who will engage in crime. The Phoenix ordinance was based on the theory that there are direct impacts that uniquely relate to this class of land use. In fact, the city planners in Phoenix asked: “are the crime impacts…directly related to the adult businesses being there, or to some other societal variables in the neighborhood?” Realizing that these other societal variables need to be controlled for, the Phoenix planners undertook an empirical study in which they considered adult land uses and negative secondary effects in light of other variables related to crime such as number of residents, median family income, percentage of non-white population, percentage of dwelling units built since 1950, and percentage of acreage used residentially and non-residentially (Planning Department of Phoenix 1979:4).
More formal expressions of how certain societal factors that may be related to the commission of crime have come from criminologists propounding routine activities/crime opportunity theory (Reference Cohen and FelsonCohen & Felson 1979; Reference Cohen, Kluegel and LandCohen, Kluegel, & Land 1981). This approach begins by noting that, in order for a predatory crime (e.g., robbery) to occur, there must be a concurrence in space and time of (1) a motivated offender, (2) a suitable target, and (3) an absence of a guardian that is capable of preventing the crime. This theory then focuses on how changes in the time and space of how people order their lives can change the opportunity structure for crime and thus affect crime rates and rates of criminal victimization—even in the absence of an increase in the structural or psychological factors that produce increases in the number of motivated offenders.
Routine activities/crime opportunity theory has been quite successful in empirical tests (see, e.g., Reference Miethe and MeierMiethe & Meier 1994). This theory also has been used to guide research by criminologists on so-called hot spots or locations in urban areas that attract large numbers of crime incidents (see, e.g., Reference Roncek and MaierRoncek & Maier 1991; Reference Smith, Frazee and DavisonSmith, Frazee, & Davison 2000). Researchers have found that perpetrators of street crime such as robbery commit their crimes proximate to where they live, on face blocks with which they are familiar or which they traverse in their routine activities.
This approach suggests a number of variables that must be considered in any investigation of the relationship of crime events to adult businesses in a community. It is necessary to control for population size, because, all else being equal, blocks with many people may have more potential crime victims than do face blocks with few people. Somewhat surprisingly, however, the population control variable is often found to be negatively associated with the number of crimes such as street robberies, suggesting that robbers tend to target victims where fewer people reside, and perhaps where fewer witnesses are likely.
In addition, it is necessary to control for neighborhood business and housing characteristics such as multiple apartments, or even multiple buildings at a given address under the assumption that, all else being equal, the more places, the more likely a robbery victimization will occur on a face block. Higher levels of crime tend to plague places with certain types of facilities and not others. In some cases, for example, crimes seem to be elevated by a target-rich environment—for example, thefts of 24-hour convenience stores, auto thefts from large parking lots, or robberies from shoppers in heavily frequented commercial areas (Reference Engstad, Silverman and TeevanEngstad 1975; Reference DuffalaDuffala 1976). The presence of bars, restaurants, and gas stations identifies blocks that might be particularly attractive for potential offenders because of easy accessibility and the presence of people carrying cash, often under the influence of alcohol (Reference Roncek and MaierRoncek & Maier 1991; Reference Sherman, Gartin and BuergerSherman et al. 1989; Reference StarkStark 1987). The number of other commercial places, such as business offices, industrial buildings, and warehouse facilities on a block is also important in predicting crime events.
Specific land uses are not only important in themselves but also operate in interaction with variables indicative of social disorganization in determining the risk of crime. Variables that have been investigated and been found to be most important as predictors of crime activity include measures of racial composition (number of African Americans and racial heterogeneity), family structure (as measured by number of single-parent households), economic composition (as measured by family income), and the presence of motivated offenders including males between the ages of 18 and 25 (Reference Miethe and McDowallMiethe & McDowall 1993). These social disorganization variables have been examined on the basis of the assumption that a local area's population age structure (especially the presence of young adults) and its race/ethnic composition can affect both the size of the pool of motivated crime offenders and the presence of suitable targets for predatory crimes (see, e.g., Reference Miethe and MeierMiethe & Meier 1994).
Similarly, the socioeconomic status of individuals in a local area can affect both the prevalence of motivated offenders and crime targets. For example, Reference Cohen, Gorr and OlligschlaegerCohen, Gorr, and Olligschlaeger (1993) found that crime hot spots tended to be in areas with higher levels of poverty or low income, and were likewise associated with low family cohesion—an indication of the prevalence of both motivated offenders and crime targets.
Research Question
Once variables known to be related to crime events suggested by social disorganization and routine activities theories have been taken into account we may ask: does the presence of an adult business in a localized area increase the concurrence in space and time of offenders motivated to commit crimes together with suitable targets for the crimes in the absence of guardians capable of preventing or deterring the crimes?
The site for the present study was Charlotte, North Carolina. For each adult topless dance club in that community, a control site (matched on the basis of demographic characteristics related to crime risk) is compared for crime events over the period of three years (1998–2000) using data on crime incidents reported to the police. This research is designed to address the questions of whether and to what extent the adult dance clubs contribute to community disorder—that is, increased crime in neighborhoods—compared to their control neighborhoods that do not have adult dance clubs.
Data and Methods
Establishing Matched Comparison Locations
Twenty topless adult nightclubs in Charlotte, North Carolina are the focal points of the present study. It was not possible to randomly assign units of analysis to an experimental group and a control group to perform a “true” experiment to test the hypothesis that adult nightclubs in Charlotte engender negative effects. Instead, a “quasi-experiment” was conducted in which matched “control” areas were found and compared to “test” areas containing the adult business. In order to insure accurate and fair comparisons, a control area must be selected that is as “equivalent” as possible to the area containing the adult entertainment business(es).
The main hypothesis to be tested in the present study is that the presence of an adult nightclub increases the number of crime incidents reported in localized areas surrounding the club as compared to the number of crime incidents reported in comparable localized areas that do not contain an adult nightclub. In order to test this hypothesis, suitable control (non-adult nightclub) sites must be chosen that are comparable (matched) to the test (adult nightclub) sites on key demographic and other variables that are generally regarded as being related to the incidence of crime.
In order to insure that the research reported here utilized appropriately “matched” adult nightclub (test) and non-club (control) areas, a crime-mapping approach was utilized. Two radii—500 feet and 1,000 feet—were used to identify circular perimeters surrounding each of 20 adult nightclubs in Charlotte. These distances were chosen because they represent the city's presumptions about negative secondary effects. The Charlotte city code, as is the case for hundreds of municipalities across the United States, mandates that adult establishments be no closer than 1000 feet from churches, schools, daycare centers, and other sensitive land uses. Other cities such as New York specify distances of 500 feet.
Comparison areas or control sites (census block groups) of physical size roughly comparable to the areas containing the adult nightclubs, each with 500 and 1000 feet in radius, were selected that matched the adult nightclub areas on the basis of several of the variables known to be related to the risk of crime victimization (on the basis of social disorganization and routine activities theory as reviewed above) and by further informally attempting to equate areas on the basis of commercial property composition. Additional variables were also taken into consideration in order to rule out alternative explanations but were not formally considered for matching purposes.
The following variables were used for the selection of control sites: total population size (1997), percentage of households that are female headed, percentage of the population that is African-American, percentage of the population aged 18–29, percentage of the adult population that is divorced, and median household income. Each of these variables was identified at the U.S. Census block group level. Properly “matching” the subject and control areas is critical in order to insure that the results we obtain can be ascribed to the presence or absence of (in this case) an adult nightclub, and not to some other irrelevant factor.
In addition, although not formally matched on these variables beforehand, measurements were taken of traffic patterns and number of businesses and commercial properties in the areas immediately surrounding the adult and control sites.Footnote 10 Traffic patterns may be important to consider because they are an indication of the number of people moving through an area both suitable as targets and as perpetrators of crime. Business composition is important because of the effect of the number of businesses on crime opportunity and neighborhood deterioration. These variables, while technically measured, are not included in the formal model testing. They will be examined to determine simply whether they covary with crime patterns. If it is found that they correspond to the pattern of crime in a particular area, we may have some indication that these features of the environment may be reasonable explanations for the findings we obtain.
The geographic information system computer program Maptitude (1999) was used to locate the census block group within which each club was located. For each census block group, a Maptitude data set provides counts for most of the demographic variables measured by the 1990 U.S. Census. In addition, 1997 supplements are provided for most variables. The values of each of the variables of interest were identified for the census block within which the adult nightclub was located. When the 1000-foot area surrounding a club location touched more than one census block, the average value for each of the relevant demographic variables was calculated across the blocks that overlapped with the club perimeters. A comparable area, matched for values on the crime-related variables, was then selected via Maptitude. All control areas were selected before the crime data were obtained and thus before any analysis of the crime data was undertaken. Finally, it should be noted that two variables often associated with social disorganization and routine activity theory, social class and residential mobility, are not available in census block data, and thus they cannot be included in the analysis. To the extent that social disorganization variables included in the model correlate with these unavailable variables, the consequences for our conclusions may be minor.
Table 1 displays a comparison of the values for each of the demographic characteristics measured at the census block level both for the adult nightclub locations and the control sites to which they were matched. Table 1 contains a column for the population size variable, four columns for the four percentage variables, and a final column for the median household income variable. Rows for the 20 adult nightclub sites are ordered alphabetically from top to bottom in Table 1, with rows for the three control sites ordered alphabetically at the bottom of the table. For each of the demographic and income variables in the table, it can be seen that there is a substantial amount of variability among the club and control sites.
Table 1. Absolute Values for Demographic Variables Related to Crime in Areas Around Club and Control Sites

To determine which control site to match with which adult nightclub location, the frequency distributions of each of the six demographic variables given in Table 1 were divided into five equally distributed levels (quintiles). For each demographic variable, each of the quintiles was assigned a numerical value that could range from 1 to 5, where 1 indicates that level of the demographic variable that is least likely to be associated with the occurrence of crime events and 5 being equal to the value that is most likely to be related to crime risk. For all but one of the demographic variables in Table 1, this resulted in the assignment of high code numbers for variables that had high values and low code numbers for variables that had low values. The only exception was median household income, for which research suggests that higher levels of household income will be associated with lower crime risk.
Table 2A contains the resulting codes for each of the demographic variables for each of the adult nightclubs and control sites. The right-most column of the table gives the combined means of the quintile codes—ranked from highest (4.0) to lowest (1.67)—where a higher mean quintile code indicates a location with a higher crime risk and a lower mean code indicates a location with a lower crime risk. The adult nightclubs are reordered in Table 2A into three groups corresponding to the three control sites with which the various clubs are associated. The first group in the table identifies seven clubs located in relatively high-crime risk locations—Club Champagne, Fancy Cat, Just Because, Player's Club, Men's Club, Gentlemen's Club, and Temptations. The control site for these clubs is a McDonald's fast food establishment with a mean quintile social disorganization variable score of 3.33. A second group in Table 2A identifies five clubs of medium relative crime risk—Crazy Horse, Tattletales, VIP Showgirls, Office Lounge, and Twin Peeks. The control site for these clubs is a Kentucky Fried Chicken (KFC) fast food restaurant with a mean quintile social disorganization score of 3.0. A third group in Table 2A identifies eight clubs of low relative crime risk—Uptown Cabaret, Paper Doll Lounge, Baby Dolls, Polo Club, Leather 'n Lace South, Leather 'n Lace North, Diamond Club, and Platinum Club. The control site for these clubs is an Exxon gasoline service station with a mean quintile score of 1.67. Note that the average quintile score for each of the control sites is equal to the lowest mean quintile score of the clubs in the group to which it is matched. Because the mean quintile scores are indicative of the criminogenic potential in the areas surrounding the sites, this implies that most of the adult nightclubs to which the control sites are matched should be expected—solely on the basis of the demographics of the surrounding areas—to have higher numbers of crime events recorded.
Table 2A. Quintile Scores for Demographic Variables in Areas Around Club and Control Sitesa

a Values for each variable could fall within one of five equally distributed levels, and were assigned a value for this table that could range from 1 to 5, where 1 was equal to the level of that variable that was least likely to be associated with crime and 5 was equal to the value that was most likely to be related to crime. For all but one variable considered in this table, this resulted in high code numbers for variables that had high values and low code numbers for variables that had low values. The only exception was for income, where a higher value resulted in a lower code score and a lower value resulted in a higher code score, because higher levels of income were expected to be associated with lower levels of criminal activity.
Table 2B displays the vehicular traffic counts for club and control areas in recent years. As can be seen from the table, the relationship between the volume of vehicular traffic and relative crime risk is not straightforward. The high-crime risk control location has a much higher volume of vehicular traffic than the average of the adult nightclub study sites. This pattern does not hold for the medium- and low-crime risk locations, however. The medium-crime risk location has the lowest volume of traffic. The low-crime risk location has an intermediate level of traffic.
Table 2B. Traffic Patterns at the Nearest Intersection to the Study or Control Sites Counted by the Charlotte-Mecklenburg Department of Transportation (all counts are taken at mid-block volume and are average weekday traffic patterns)

Land use, commercial establishments, and business patterns were also taken into consideration by a simple count of commercial establishments for each control location and the computation of average counts for the club locations. Table 2C displays these counts and averages. No particular pattern was observed here either. The high-crime risk control area has a large number of commercial sites compared to the test area. However, on average, the medium-crime risk area test sites have many more commercial businesses in the area than the medium-crime risk control area. Finally, the low-crime risk area has substantially more commercial establishments than the test sites.
Table 2C. Counts of Number of Businesses at Control and Test Sites Within a 1,000-Foot Radius

Data on Crimes Reported
With support from the U.S. Department of Justice Office of Community Oriented Policing Services, the Charlotte-Mecklenburg Police Department maintains a computerized “reported incidents” information system for the city of Charlotte and Mecklenburg County, North Carolina. This system is capable of providing geo-coded information on all crime incidents reported at or near locations in the Charlotte area. Using this computerized database, brief descriptions of all crime incidents reported at or near each of the adult nightclubs and control sites identified above for the three years 1998–2000 were identified and provided to the authors by the Charlotte-Mecklenburg Police Department. The two perimeters identified above were employed, thus yielding records of incidents that occurred within a 500-foot radius and incidents that occurred within a 1,000-foot radius.
There are no formal measurements of the accuracy with which the officers in the Mecklenburg Police Department or the dispatchers of the Computer Aided Dispatch (CAD) system locate a crime event. The dispatcher is at the mercy of the caller who relates an address. The police department does not keep an account of the discrepancy between the original address reported to the dispatcher and the address noted in any subsequent police report.
For crimes such as rape, robbery, and assault, the address of the actual offense may not be the address of the dispatch. Victims of these crimes sometimes go to other locations and call for service. The discrepancy between call address and actual address of the crime event may therefore be sizable, approximately 10%–20%, according to the Charlotte assistant crime analyst. But, these inaccuracies only occur for these crimes. The address of the crime location and the call location are highly consistent between the CAD and the location of the crime for property crimes and serious assaults resulting in incapacitation and murder.
The database used for the present study contains only those crime incidents derived from the CAD database for which the police completed a report. This constitutes approximately 25%–30% of the entire CAD database. The accuracy of addresses listed in the report data file is not checked against the CAD, nor is it checked against a map of the city (although a procedure for verifying addresses has recently been implemented by the department). Accuracy is estimated by the crime analyst to be in the 94%–95% range.
For purposes of the present study, the authors grouped the reported crime incidents into six categories, ordered from the most to the least inclusive, as follows: total crimes (i.e., the total of all crime categories listed below), total Uniform Crime Reports (UCR) Index Crimes (i.e., the total of the UCR Violent and Property Crimes identified below), total Uniform Crime Reports Violent Crime Index Crimes (murder, rape, aggravated assault, and robbery), total Uniform Crime Reports Property Crime Index Crimes (burglary, larceny/theft, motor vehicle theft, and arson), sex crimes (the crime reports data had counts listed only as “sex offenses” to which were added rape/attempted rape counts, to define this variable), and all other crimes (minor incidents such as disorderly conduct, hit and run, non-aggravated assault, embezzlement, and forgery).
Counts of the number of incidents reported in each of these six categories for each of the three years of the study for each of the 23 adult nightclub and control sites for each perimeter constitute the dependent variables to be studied.
Statistical Model
In addition to overall estimates of mean numbers of crime incidents surrounding the adult nightclub and control sites, we conducted a panel regression analysis of the data.Footnote 11 For this, we use fixed-effects or least-squares dummy-variable regression models (see, e.g., Reference Hannan and YoungHannan & Young 1977; Reference HsiaoHsiao 1986) to analyze the Charlotte crime events data arranged in a pooled time-series cross-section with site (club or control)-years as units of analysis. Effects are fixed for years and sites. Site-fixed-effect models eliminate bias created by the failure to include controls for unmeasured characteristics of the sites that have additive effects. Thus, fixed-effects models control for unmeasured characteristics of the sites that may affect the incidence of crime events at or near the adult nightclub and control sites. The regression model is:

where

In this model, the regression parameter β 0 denotes an overall constant term for the model, which corresponds to the overall average number of crime incidents of a given type across all sites and years. This overall average number of crime incidents is adjusted up or down for each site i and year t by the overall error term ɛ it. The overall error term ɛ it is composed of a cross-sectional (site) component u i plus a year component v t plus a purely random component w it. The additive error term effects of the sites are estimated relative to a base nightclub that consistently has low numbers of crime incidents (Fancy Cat), so that most site-specific effects for most crime categories will be positive. Overall year effects on the numbers of reported crime incidents also are estimated for 1999 and 2000, with the year 1998 taken as the base year.
For all models, we used a heteroskedasticity-consistent covariance matrix to estimate the standard errors of the regression coefficients. This method of calculating the standard errors, often referred to in the statistical literature as the HC3 estimator, is a robust estimator similar to the one derived by Reference WhiteWhite (1980), but adding a finite sample correction term to relax the asymptotic requirements of White's original formulation (Reference Davidson and McKinnonDavidson & McKinnon 1993; Reference Long and ErvinLong & Ervin 2000; Reference McKinnon and WhiteMcKinnon & White 1985). The finite sample correction term produces a more conservative estimate of the variance of the parameter estimates by adding an adjustment term that accounts for the small sample size (Reference Long and ErvinLong & Ervin 2000). The HC3 estimator is an approximation of the jackknife variance estimator (Reference Long and ErvinLong & Ervin 2000; Reference McKinnon and WhiteMcKinnon & White 1985).
Results
Table 3 reports overall results on mean numbers of crime incidents reported to the Charlotte Police Department for local areas (both 500- and 1,000-foot radii) surrounding both the 20 adult nightclubs and the three control sites.Footnote 12 The table includes the means for each of the three years 1998, 1999, and 2000, as well as for all three years combined. Means are given for each of the six categories of crime described earlier. For the adult nightclubs, two estimates of the means are given. This is due to the fact that one of the clubs, Baby Dolls, had no reported crimes within 1,000 feet during any of the three years. Therefore, in order to provide an estimate of the mean crimes reported that is not distorted by including a club in the denominators that did not contribute to the incidents in the numerators, two sets of mean estimates are reported—one that includes Baby Dolls and one that does not.
Table 3. Mean Number of Crimes Reported to the Police by Crime Type and Radius

a This mean excludes the club Baby Dolls, which had no reported crimes within 1,000 feet during the years 1998, 1999, and 2000.
b This mean includes the club Baby Dolls (i.e., the denominator is increased by 3).
Several results in Table 3 merit comment. First, consider the overall means for our most comprehensive measure of crime incidents—the Total Crimes rows of Table 3. For this crime category, the mean number of incidents for all three years combined in the adult nightclub locations is between 59% and 62% of those reported for the control sites for the 500-foot perimeters and between 45% and 47% of those reported for the control sites for the 1,000-foot perimeters. Roughly similar bounds characterize the means for the combined years for all of the other crime categories in the table. Thus, with respect to all six categories of crime incidents under investigation, it is evident that the overall mean numbers of crime incidents for all three years combined are somewhat less in the areas surrounding the adult nightclubs than in the areas surrounding the control sites.
Next, consider the year-specific means of crime incidents reported in Table 3. For both the 500- and 1,000-foot perimeters and four of the crime categories in the table, namely Total Crimes, Total UCR Crimes, UCR Property Crimes, and Other Crimes, there is an evident difference between the adult nightclub and control sites. That is, the trend in the means across the three years for the control sites for all of these crime categories is down, whereas there is little, if any, trend across the years for the adult nightclub sites. It is as if the levels of crime incidents in the control site areas are declining toward the already lower levels near the club sites. Even so, however, for all four categories, the mean numbers of crime incidents reported in the last year available, the year 2000, in the nightclub areas remain below those in the control areas. This is especially true when the perimeter around these locations is expanded to 1,000 feet, which, of course, permits the inclusion in the crime counts of incidents further removed from the club and control site premises. For two other crime categories in Table 3, UCR Violent Crimes and Sex Crimes, the trends across the three years are more muted for both the club and the control sites. This is due, in part, to the fact that the numbers of these crimes are lower, so that even a slight increase in incidents can be influential in the computation of the means.
For a more precise statistical analysis of the crime events data, the regression model described above in Equation 1 was estimated. Table 4 reports parameter estimates and summary statistics for the full version of this regression model wherein the dependent variable is the Total UCR Crimes reported in the 500- and 1,000-foot perimeters of the adult nightclub and control sites.Footnote 13 This model takes the number of crime events reported for 1998 as the omitted year and the number of events reported for the Fancy Cat Club as the omitted adult nightclub site.Footnote 14 The coefficients of determination (R-squared) reported in Table 4 show that the fixed-effects regression models succeed in explaining over 90% of the variance in numbers of Total UCR Crimes reported in the two perimeters.
Table 4. Parameter Estimates from Fixed-Effects Dummy Variable Regression Model of Total UCR Crimes
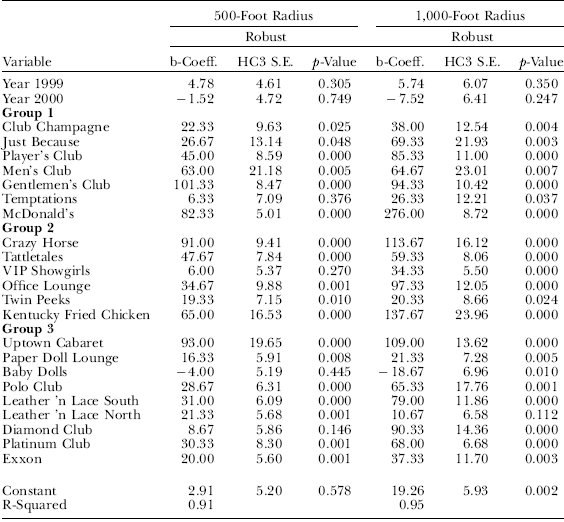
Note: The reference site is the Fancy Cat Club.
It can be seen from Table 4 that the partial regression coefficients estimated for the year 1999 are 4.78 and 5.74 for events reported within a 500-foot and 1,000-foot radius of the clubs and control sites, respectively. This means that, on average, about five more crime events were reported within 500 feet of all locations in 1999 than in 1998 and about six more within the 1,000-foot radius. By comparison, in the year 2000, the regression coefficients indicate a decrease of one to two crime events from that in 1998 within 500 feet and seven to eight within 1,000 feet of all locations. However, none of these year-specific regression coefficients has an associated p-value less than the .05 level of statistical significance, that is, statistically significant from zero. Therefore, it can be inferred that these year-to-year variations from the 1998 base year are sufficiently small that they are statistically meaningless.
Examining next the estimated partial regression coefficients for the adult nightclub and control sites in Group 1, recall that these are in relatively high-crime risk locations. A key comparison is the size of the coefficient estimated for the control site for this group, a McDonald's fast food restaurant, with the coefficients for the club sites in this group. It can be seen that the estimated coefficients for McDonald's are 82.33 and 276 for the 500- and 1,000-foot radii, respectively. These coefficients can be interpreted as indicating that, net of the overall constant and year-specific terms for the regression equations, the McDonald's site is expected to have about 82 and 276 more crime events reported on average per year than the Fancy Cat Club, respectively, for the two perimeters. For the 500-foot perimeter, the coefficient for McDonald's is substantially larger than those for all of the adult nightclubs in Group 1 except for the Gentlemen's Club. In the case of the 1,000-foot perimeter, the McDonald's coefficient is much larger than the coefficients of all of the club sites, including the Gentlemen's Club.Footnote 15
Consider next the adult nightclub and control sites in Group 2. Recall that these are medium-crime risk locations. In this group, the control site is the Kentucky Fried Chicken restaurant, which has an estimated regression coefficient of 65 for the 500-foot perimeter and 137.67 for the 1,000-foot perimeter. For the 500-foot perimeter around the sites, the KFC regression coefficient is substantially larger than those of all of the club locations in this group except those for the Crazy Horse Club. The same is true for the coefficients for the 1,000-foot perimeter model.
The adult nightclub and control sites in Group 3, the low-crime risk locations, were then examined. In this group, the Exxon service station is the control site. It has an estimated regression coefficient of 20 crime events for the 500-foot perimeter and 37.33 for the 1,000-foot perimeter. For the 500-foot perimeter around the sites, this coefficient is larger than those estimated for three adult nightclubs (Paper Doll Lounge, Baby Dolls, and Diamond Club), about the same as one club (Leather 'n Lace North), somewhat smaller than those for three club sites (Polo Club, Leather 'n Lace South, and Platinum Club), and much smaller than that for one club (Uptown Cabaret). For the 1,000-foot perimeter, the estimated regression coefficient for Exxon is larger than those for three clubs (Paper Doll Lounge, Baby Dolls, and Leather 'n Lace North) and smaller than those for five clubs (Uptown Cabaret, Polo Club, Leather 'n Lace South, Diamond Club, and Platinum Club).
We next turn to an assessment of the statistical significance of the differences between the net effects (i.e., the estimated partial regression coefficients) of the three groups of adult nightclub sites as compared to the corresponding control sites. For this, we estimated a set of constrained regression models, as reported in Tables 5A and 5B. Table 5A reports the results for the 500-foot perimeters around the sites; Table 5B reports the corresponding results for the 1,000-foot perimeters.
Table 5A. Summary Results of F-Tests Comparing the Equivalence of the Club Group Dummy Variables and the Matched Control Site: 500-Foot Radius

Note: For Group 1, the reference site is the Diamond Club. For Groups 2 and 3, the reference site is the Fancy Cat Club.
Table 5B. Summary Results of F-Tests Comparing the Equivalence of the Club Group Dummy Variables and the Matched Control Site: 500-Foot Radius

Note: For Group 1, the reference site is the Diamond Club. For Groups 2 and 3, the reference site is the Fancy Cat club.
Each of these constrained models commenced with a corresponding full model, like that displayed in Table 4 for Total UCR Crime incidents reported within the 500-foot perimeter. We then constrained all of the adult clubs in one of the groups, namely Group 1, to have a common partial regression coefficient. For Total UCR Crimes, this group coefficient, 29.14, is reported in the first column of coefficients in Table 5A. The constrained model also estimated a partial regression coefficient for the Group 1 control site, the McDonald's fast food restaurant. This coefficient, 73.14, is reported in the second column of coefficients of Table 5A. An F-ratio then was computed for the null hypothesis that the common regression coefficient for the Group 1 sites is equal to the coefficient for the corresponding control site. This statistic, 27.60, is given in the third column of coefficients of Table 5A. The fourth column of coefficients reports the statistical significance of the F-ratio. For Group 1 Total UCR Crimes, it can be seen in Table 5A that the estimated difference of the partial regression coefficients for Total UCR Crimes for the Group 1 adult clubs and the control site for this group is highly statistically significant, that is, has a p-value or estimated probability of occurrence that is equal to zero to four decimal places. In other words, the numerical difference of the estimated partial regression coefficients for the Group 1 sites and the control site for Group 1 is not likely to be due to chance variations. Furthermore, the estimated coefficients show that the adult club sites in Group 1 are highly likely to have a net number of Total UCR Crimes that is much smaller than the control site.
Examining all of the estimated coefficients, F-ratios, and p-values in Table 5A, it can be seen that a pattern is readily apparent: for four of the crime categories—Total Crimes, Total UCR Crimes, UCR Violent Crimes, and UCR Property Crimes—the numerical differences of the estimated partial regression coefficients for the Group 1 sites (the adult nightclubs located in relatively high-crime risk areas) and the coefficients for the control site (the McDonald's fast food restaurant) are highly statistically significant. That is, these numerical differences are not likely due to chance fluctuations in the data. In other words, the expected numbers of crime events for these four categories of crime reported within 500-foot perimeters of the Group 1 adult nightclub locations are much lower than those reported within this perimeter for the control site. And these differences are not likely to be due to random or chance fluctuations.
For these four categories of crime incidents, the numerical differences of the coefficients for the Group 2 (clubs located in medium-crime risk areas) and Group 3 (clubs located in low-crime risk areas) adult nightclub sites and their respective control sites are not nearly as large and tend not to reach statistical significance. An exception is the Group 2 constrained model for UCR Violent Crimes, which has an F-ratio of 6.15. This F-ratio has a p-value or probability of occurrence under the null hypothesis of no difference in the regression coefficients for the club and control sites of .0167, which is statistically significant at the .05 level. Generally, however, the main conclusion from Table 5A for these four crime categories is that, within the 500-foot perimeters, there are significantly lower numbers of crime incidents reported around the Group 1 adult nightclubs than around the corresponding control site. For the Group 2 and Group 3 club sites, the differences in the partial regression coefficients tend not to be as large and not attain statistical significance.
For the other two crime categories in Table 5A—Sex Crimes and Other Crimes—there is less of a pattern to the group differences. Recall that the number of sex crimes reported per year at any of the adult nightclub or control sites is very small. It is therefore not surprising that none of the numerical differences of regression coefficients for the groups of club sites and their corresponding control sites attain statistical significance. For the Other Crimes category, the numerical differences of the estimated regression coefficients for both the Group 1 clubs and their control site attain statistical significance. Even for these crimes, however, the numerical values of the regression coefficients for the Group 2 club locations (25.47) and their control site (41) indicate a larger expected number of crime incidents—about 16 per year—within the 500-foot perimeters around the club locations than around the control site. But the variability within the Group 2 club locations is sufficiently large that this numerical difference is not statistically significant.
What is the effect on the club group versus control site comparisons of enlarging the perimeters for crimes reported to 1,000 feet around the sites? Recall that this allows for the inclusion of more crime incidents from the neighborhoods around the club and control locations. Table 5B provides the answers. For four of the six crime categories—Total Crimes, Total UCR Crimes, UCR Violent Crimes, and Other Crimes—the estimates in Table 5B show that the adult club sites have estimated partial regression coefficients that are much smaller than those of the corresponding control sites for the Group 1 and Group 2 clubs. And these numerical differences all are statistically significant at the .05 level. Indeed, most of the F-ratios have p-values much smaller than .05. The estimated partial regression coefficients for the UCR Property Crimes category show a similar pattern of differences of club and control sites for the Group 1 clubs. However, while the coefficient difference is in a similar direction for the Group 2 clubs and control site for this crime category for the Group 2 clubs, the corresponding F-ratio has a p-value of .08, which does not exceed the .05 level of statistical significance. For the fifth crime category, Sex Crimes, the numerical differences between expected numbers of incidents reported for the club and control sites again are small and statistically insignificant. In brief, the main effect of enlarging the perimeters around the adult nightclub and control site locations from 500 to 1,000 feet for most categories of reported crime incidents is that the gaps in the expected numbers of crime incidents become very large and highly statistically significant for both the high- and the medium-crime risk locations.
Conclusion
On the basis of the findings reviewed above, it must be concluded that there is little evidence in the data to support the main hypothesis stated earlier. Recall that we asked: once variables known to be related to crime events suggested by social disorganization and routine activities theories have been taken into account, does the presence of an adult business in a localized area increase the concurrence in space and time of offenders motivated to commit crimes together with suitable targets for the crimes in the absence of guardians capable of preventing or deterring the crimes? We found that, at least in Charlotte, North Carolina, it is not the case that the presence of an adult nightclub increases the number of crime incidents reported in localized areas surrounding the club as compared to the number of crime incidents reported in comparable localized areas that do not contain an adult nightclub.
Indeed, the empirical data and analyses reported above imply the opposite, namely, that the nearby areas surrounding the adult nightclub sites have smaller numbers of reported crime incidents than do corresponding areas surrounding the three control sites studied. Furthermore, it must be emphasized again that the control sites were chosen solely by matching set demographic characteristics (which were chosen on the basis of crime opportunity/routine activities theory and research) of the census block or blocks containing the adult nightclubs and control sites. Thus, these findings could not have been biased by the choice of the control sites. Further, although not incorporated into the formal model, examination of the vehicular traffic patterns and number of commercial establishments surrounding the adult businesses yielded no consistent pattern of findings. There were not, for example, consistently more business targets for crime or greater numbers of human traffic passing through the control areas that would account for the greater numbers of crimes in these locations compared to the adult locations.
Our regression analyses help to identify more precisely exactly where the adult nightclubs with relatively low numbers of reported crime incidents are located. Specifically, for local areas around the adult nightclub and control sites defined by 500-foot radii, the regression analyses show that it is in the high-crime risk locations in which the numbers of reported crimes are significantly lower than in the corresponding control site. In the medium- and low-crime risk club and control site locations, the regression models estimate smaller effect coefficients for crime risk of the club locations than for the corresponding control sites. However, the numerical differences of the coefficients for these two more moderate-crime risk groups versus their control sites generally do not reach standard levels of statistical significance. The regression analyses for the clubs and control sites defined by the 1,000-foot radii (which allow for the inclusion of more crime incidents from the neighborhoods around the sites) show similar results for the high-crime risk locations. In addition, the 1,000-foot perimeter regression analyses similarly show that the medium-crime risk locations generally have significantly lower numbers of crime incidents that those reported for the corresponding control site.
Our analyses of the overall mean numbers of crime incidents (for the adult nightclubs compared to the control sites) for the years 1998–2000 suggest that Charlotte, like many cities across the country and the United States as a whole (U.S. Department of Justice, Federal Bureau of Investigation 2000), was experiencing declining numbers of crime incidents during this period. These analyses show that the overall lower numbers of crime incidents reported in the local areas around the adult nightclubs than around the control sites declined across the three years. That is, the differences decreased, thus indicating that, as the overall level of crime in Charlotte declined from 1998 to 2000, the numbers of crime incidents reported in local areas around the control sites declined toward the lower levels already present in the local areas surrounding the adult club sites. In other words, the areas around the adult club sites already had relatively low levels of reported crime in 1998. Then, as the overall levels of crime in Charlotte declined in 1999 and 2000, the numbers of crime incidents reported around the club sites remained at these low levels. But, during 1999 and 2000, the numbers of crime incidents reported around the control sites declined along with crime levels in the city as a whole and toward the already low levels of the locations around the club sites.
Implications for Crime Opportunity and Social Disorganization Perspectives
What accounts for these findings? In contradiction to the hypothesis stated earlier in this article, why do the local areas surrounding the adult nightclubs in Charlotte have lower numbers of reported crime incidents than corresponding areas around the control sites? Why do we not find empirical evidence of the social disorganization/crime opportunity spillover of these adult establishments of the type cited at the outset of this article?
First, the adult nightclub business in the late-1990s in many respects may be quite unlike that of the 1960s and 1970s when these establishments were relatively new forums of entertainment in American society. As noted in the introduction to this article, adult nightclubs have been subjected to over two decades of municipal zoning restrictions across the country, and they usually must comply with many other regulations as well. These clubs do not appear to be locations where potential offenders gather to prey on desirable targets in the absence of crime suppressors, such as employees whose role is to ensure the safety of customers and the maintenance of order within the clubs.
The establishments themselves have evolved more closely into legitimate businesses—establishments with management attention to profitability and continuity of existence. To meet these objectives, it is essential that the management and/or owners of the clubs provide their customers with some assurance of safety. Accordingly, adult nightclubs, including those in Charlotte, often appear to have better lighting in their parking lots and better security surveillance than is standard for non-nightclub business establishments. These may be factors producing fewer crime opportunities and lower numbers of reported crime incidents in the surrounding areas of the clubs.
The extensive management of the parking lots adjoining the exotic dance nightclubs, in many cases including guards in the parking lots, valet parking, and other control mechanisms, may be especially effective in reducing the possibility of violent disputes in the surrounding area. In addition, unlike other liquor-serving establishments (bars and taverns that do not offer adult entertainment) that may be present in the control areas, violent disputes in the areas surrounding exotic dance clubs between men over unwanted attention by other males to dates or partners are minimal due to the fact that the majority of patrons attend the clubs without female partners. Thus, the possibility of interpersonal aggression may be greatly reduced in the vicinity of adult dance clubs, compared to most other locations where adults congregate, such as bars or taverns that do not feature adult entertainment.
Findings from a qualitative, anthropological case study of several of the exotic dance clubs included in this study undertaken by Reference HannaHanna (2001) are consistent with these speculations. Three adult clubs were chosen to reflect three different kinds of economically developed neighborhoods. Neighborhood residents had few complaints about the adult businesses and most neighboring business owners were quick to note that the reason they felt the adult clubs had few negative effects was because of very efficient management of the property and facilities.
A related, but alternative, explanation might also be considered. Perhaps victims of crime in areas surrounding adult clubs are not motivated to report crime incidents to the police. If this were the case, there may not be stable crime reporting across study and control sites. It could be that, compared to the control sites, more of the crime that occurs in the adult dance club zone goes unreported. It seems plausible that many of the victims of crime in these areas might not want to draw attention to themselves. This may be a plausible alternative explanation for crimes such as personal assault and robbery; it would not be a reasonable explanation for burglary, serious property crimes in adjacent buildings, murder, or serious personal assault.
Finally, it is important to point out that imperfections in matching control and adult club areas may always be advanced to account for the findings here or for any other quasi-experimental study. While we attempted to match the sites on variables known to be related to crime as suggested by criminological theory and further examined business and traffic patterns and found no consistent pattern that could plausibly account for the results, it is never possible, logically, to rule out all alternative explanations based on some unobserved variable to match all possible variables. Indeed, we always fail to match on some unspecified variable. The challenge is to identify that variable before hand which may more reasonably account for the findings.
One specific difference between control and club sites may be worth noting, however, and could be the basis for further study. We chose specific business locations in the center of the control areas for our crime event counts, and this yielded two popular fast food restaurants and a gas station as control sites. There might be more appropriate control sites for comparison given the context of the secondary effects legal arguments.
Conceptually, it may be more appropriate to compare adult club sites with non-adult club sites so that one can determine whether the type of club activity affects the level of crime. This comparison may be implicit (if not explicit) in the minds of citizens and justices when considering whether an adult club should be allowed to locate in a particular area. Methodologically, using basic service type businesses such as fast food restaurants as control sites may confound the comparisons being made in the research, even if they are located in areas equivalent to those in which adult dance clubs are located.
There is an empirical study conducted in another locale, which may allay the concern that the control areas chosen in the present study would yield abnormally high crime rates relative to adult club locations. The Board of Commissioners of Fulton County, Georgia (Atlanta area) attempted to address the assumption that the consumption of alcoholic beverages in adult entertainment establishments may contribute to increased crime in the vicinity of such adult entertainment establishments. This study, conducted by the Fulton County Police Department, compared calls for service to the police that resulted in an arrest or a report in the vicinity of six liquor-serving establishments that featured adult entertainment and six liquor-serving establishments that did not include adult entertainment (Fulton County Police 1997). The findings indicated substantially more calls for service to the police to liquor establishments that did not provide adult entertainment compared to liquor establishments featuring adult entertainment. These findings lend credibility to the outcome of the present study and suggest that the results are not a function of improperly matched control and test sites. Unfortunately, the Fulton County study did not match test and control areas on demographic variables known to be related to crime and is therefore methodologically limited.
The most informative approach would be to examine crime incidents surrounding adult businesses while simultaneously controlling for all other known or suspected causes of crime. This would include taking into account variables such as land use, social disorganization and crime opportunity, traffic patterns, and the presence or absence of alcohol-serving establishments. Future research should be devoted to the study of secondary effects of adult businesses with these methodological refinements.
Legal and Policy Implications
It has been demonstrated through this study that there may be a sufficient basis for a serious challenge to the assumption made by municipalities and the courts that there is an empirical relationship between exotic dance businesses and at least one kind of negative secondary effect, specifically increases in crime. Further, this conclusion is based on research procedures that adhere more thoroughly to long-standing and well-accepted methodological procedures for insuring sound scientific conclusions than previous studies undertaken by municipalities across the country.
In Pap's, Justice O'Connor provides room for legal challenges, based on the collection of empirical evidence, to the assertions made by municipalities regarding a relationship between adverse secondary effects and nude dancing. In order to remain consistent with the Supreme Court's holding in Pap's, lower courts will be required to consider the methodological legitimacy of evidence of a relationship between negative secondary effects and the subject businesses collected both by governments and by those business owners who attempt to challenge government ordinances restricting their establishments.
Further, in Alameda, Justice O'Connor and others further refined her notions of how municipalities' assumptions about adult businesses and secondary effects may be challenged by admonishing cities that they cannot engage in shoddy data collection or reasoning in coming to the conclusion that adult businesses cause these effects. In evaluating the quality of the data collected and the reasoning of municipalities, a standard such as that laid out in Daubert for the admissibility of scientific evidence may best serve the interests of justice.
The study presented here, we would argue, meets such standards for admissibility. The application of such standards, bolstered by the Court's opinion in Alameda, may force courts to reject studies that have been previously relied upon as evidence of negative secondary effects, and require new, more methodologically sound studies to demonstrate the necessity for regulations directed at the exotic dance industry.
Challenging Common Sense Assumptions About Adverse Secondary Effects
This investigation suggests it may be best not to assume adverse secondary effects in the form of greater crime emanate from adult businesses in a community. Further tests of this assumption on a community-by-community basis are not tremendously difficult. Justice Souter noted in his opinion in Alameda:
…stress should be placed on the point that requiring empirical justification of claims about property value or crime is not demanding anything Herculean. Increased crime, like prostitution and muggings, and declining property values in areas surrounding adult businesses, are all readily observable, often to the untrained eye and certainly to the police officer and urban planner. These harms can be shown by police reports, crime statistics, and studies of market value…
And precisely because this sort of evidence is readily available, Justice Souter noted:
Reviewing courts need to be wary when the government appeals, not to evidence, but to uncritical common sense in an effort to justify such a zoning restriction. It is not that common sense is always illegitimate in First Amendment demonstration. The need for independent proof varies with the point that needs to be established, and zoning can be supported by common experience when there is no reason to question it. But we must be careful about substituting common assumptions for evidence, when the evidence is as readily available as public statistics and municipal property valuations, lest we find out when the evidence is gathered that assumptions are highly debatable.
In fact, in the Alameda case, Justice Souter has formulated a legal test based on empirical verification. He argues that the weaker the empirical evidence concerning secondary effects, the more likely the governmental action is not content neutral. He states:
…The lesson is that the lesser scrutiny applied to…zoning restrictions is no excuse for government failure to provide a factual demonstration for claims it makes about secondary effects; on the contrary, this is what demands the demonstration. And finally the weaker the demonstration of facts distinct from disapproval of the adult viewpoint, the greater the likelihood that nothing more than condemnation of the viewpoint drives the legislation. The danger is that without empirical verification the city has a right to experiment with a First Amendment restriction in response to a problem of increased crime that the city has never shown to be associated with adult businesses.
However welcome, this is an admittedly strong position in favor of empirical evidence to substantiate a legal assumption about human behavior. At the very least, however, a study like the one reported here could have the effect of shifting the burden of proof to municipalities to demonstrate that their theory of adverse secondary effects is correct.


