


Introduction
Fast-flowing outlet glaciers draining the Greenland Ice Sheet are dynamically coupled to changes at their terminus (Nick and others, Reference Nick, Vieli, Howat and Joughin2009). Many outlet glaciers have thinned and accelerated in response to 21st century terminus retreat from either a grounded (e.g. Howat and others, Reference Howat, Joughin and Scambos2007; Joughin and others, Reference Joughin2008; Moon and others, Reference Moon, Joughin, Smith and Howat2012) or floating terminus (Joughin and others, Reference Joughin2008; Hill and others, Reference Hill, Carr and Stokes2017). Laterally confined ice shelves at marine termini can provide strong back-stress (i.e. buttressing) on grounded ice (Schoof and others, Reference Schoof, Davis and Popa2017; Haseloff and Sergienko, Reference Haseloff and Sergienko2018). However, floating ice shelves could be destabilized under future climate-ocean warming, reducing resistive stress at the grounding line, which in turn could accelerate ice flow, increase ice discharge and ultimately raise global mean sea level. Ice shelf buttressing has been the focus of recent work on ice shelf collapse/stability in Antarctica (e.g. De Rydt and others, Reference De Rydt, Gudmundsson, Rott and Bamber2015; Paolo and others, Reference Paolo, Fricker and Padman2015; Reese and others, Reference Reese, Gudmundsson, Levermann and Winkelmann2018a), but has received limited attention in Greenland.
Petermann Glacier (PG) is a fast flowing ($\sim 1\ {\rm km\ a}^{-1}$ ) outlet glacier in northwest Greenland that drains ~ 4% of the ice sheet (Fig. 1: Münchow and others, Reference Münchow, Padman and Fricker2014). The catchment contains $1.6 \times 10^{5}\ {\rm km^{3}}$
 of ice volume above flotation (VAF), equivalent to 0.41 m of global mean sea level rise. PG terminates in one of the last remaining ice shelves in Greenland (Hill and others, Reference Hill, Carr and Stokes2017) (Petermann Glacier Ice Shelf: hereafter PGIS). In the early Holocene the grounding line retreated from the mouth of the fjord (Jakobsson and others, Reference Jakobsson2018), but the extent of the ice shelf remained largely unchanged. More recently, two large well-documented calving events in 2010 and 2012 (Nick and others, Reference Nick2012; Johannessen and others, Reference Johannessen, Babiker and Miles2013; Münchow and others, Reference Münchow, Padman and Fricker2014) shortened the ice shelf from ~70 to 46 km (Fig. 1), which caused some inland ice acceleration (~12%) after 2012 (Münchow and others, Reference Münchow, Padman, Washam and Nicholls2016; Rückamp and others, Reference Rückamp, Neckel, Berger, Humbert and Helm2019). Aside from this, PG does not appear to be undergoing significant temporal changes in geometry or speed as it has exhibited limited surface lowering (Fig. 2), no obvious grounding line retreat over a 19-year period (1992–2011: Hogg and others, Reference Hogg, Shepherd, Gourmelen and Engdahl2016), and no significant speed-up in response to recent calving (Nick and others, Reference Nick, Van Der Veen, Vieli and Benn2010; Rückamp and others, Reference Rückamp, Neckel, Berger, Humbert and Helm2019).
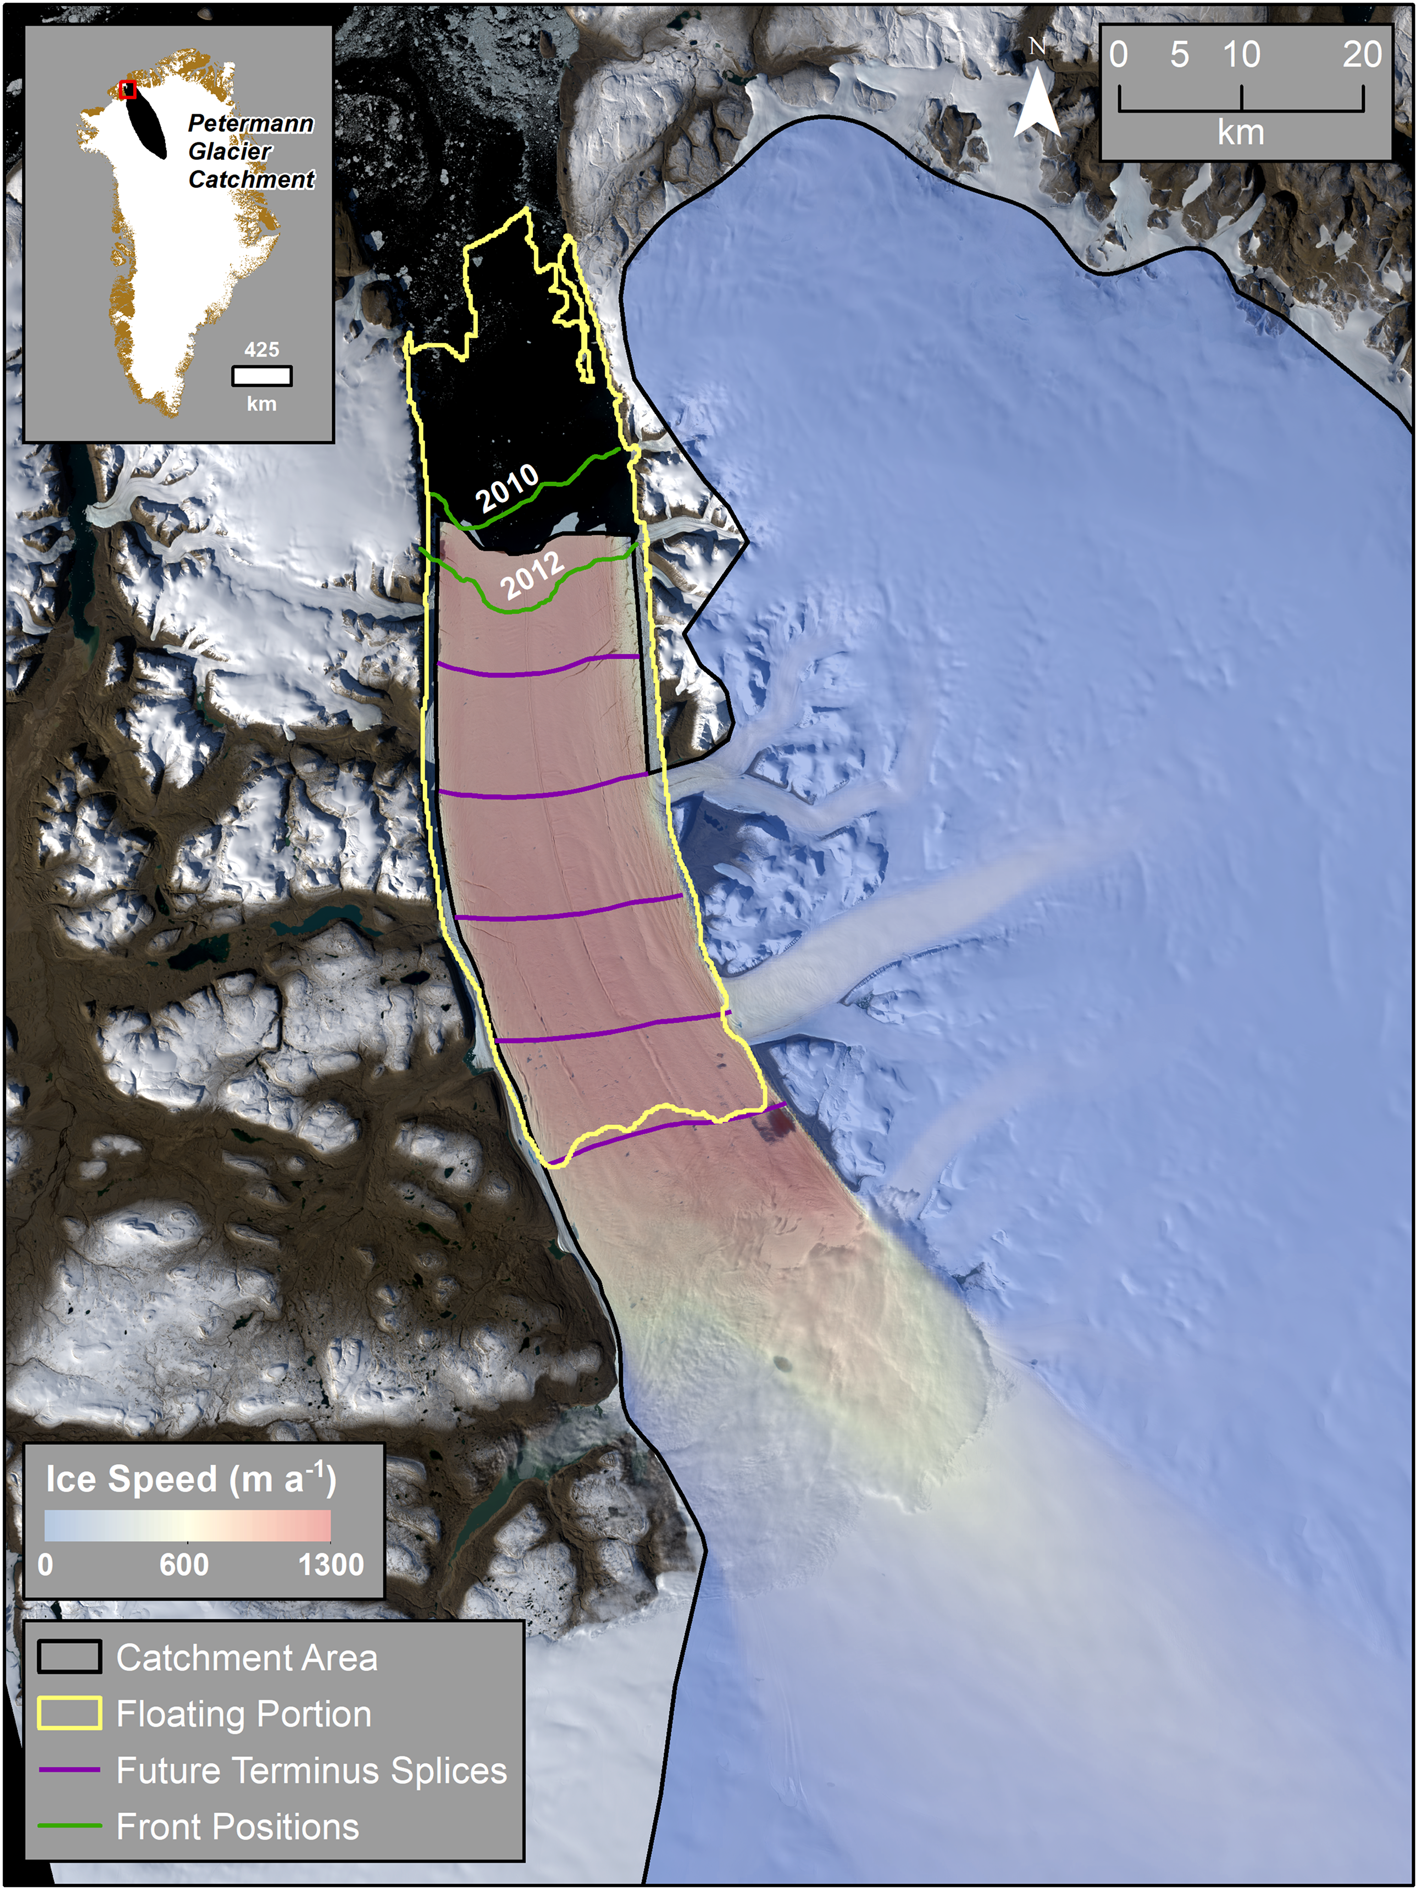
Fig. 1. Study figure of Petermann Glacier, northwest Greenland. The yellow outline shows the former extent of PGIS prior to calving events in 2010 and 2012 which are shown in green. Splices of the ice shelf removed during our model experiments are shown in red. The glacier catchment, i.e. our model domain, is outlined in black. Note that the terminus re-advanced following the 2012 calving event. Ice flow speeds are derived from the MEaSUREs Greenland annual ice-sheet velocity mosaic (Joughin and others, Reference Joughin, Smith, Howat, Scambos and Moon2010b) supplied courtesy of the NASA National Snow and Ice Data Center. Background imagery is panchromatic band 8 (15 m resolution) Landsat 8 imagery from winter 2016, acquired from the US Geological Survey Earth Explorer.
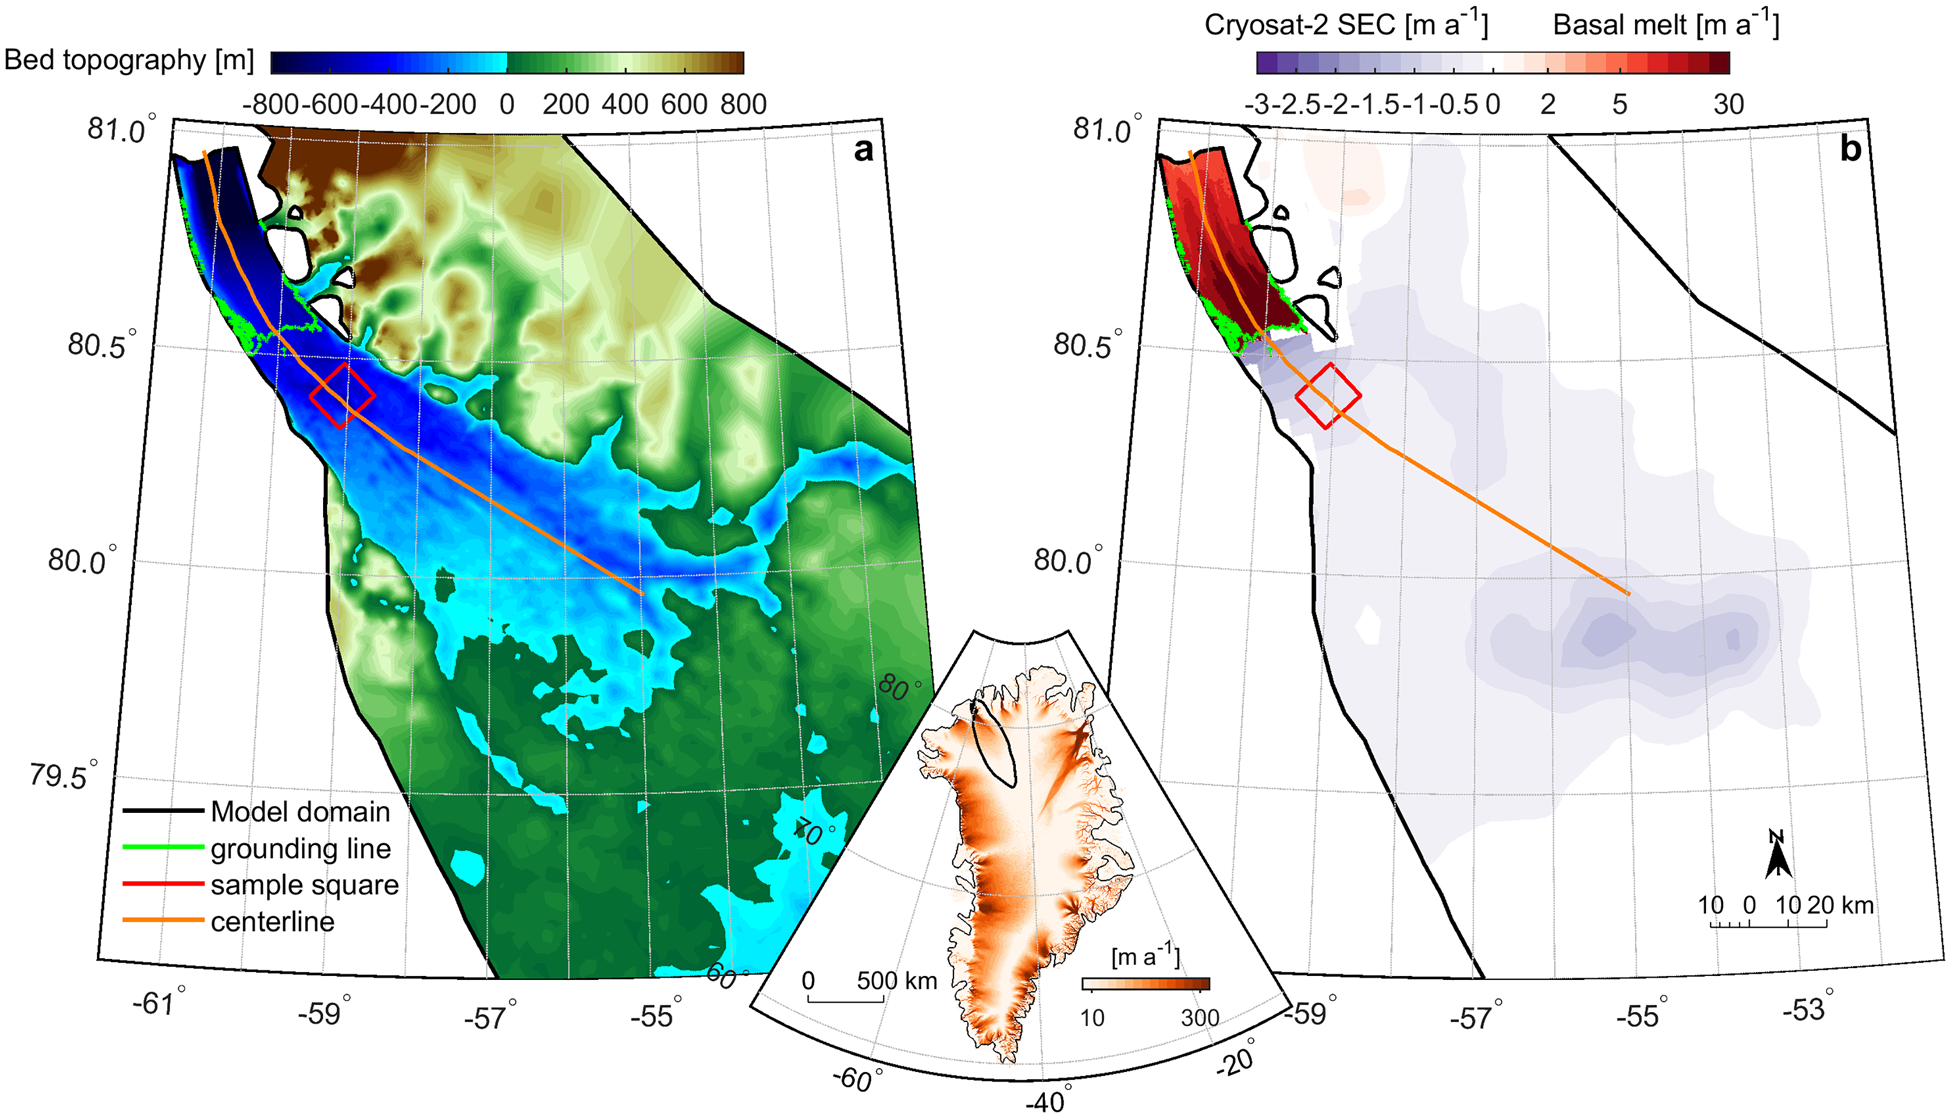
Fig. 2. (a) Bed topography [m] across the lower portion of the Petermann Glacier catchment, (b) is initially prescribed steady-state melt rates beneath the ice tongue (on a logarithmic scale in red) and green shading is observed surface elevation change (SEC) from Cryosat-2 between 2011 and 2016 (Simonsen and Sørensen, Reference Simonsen and Sørensen2017), both of which are in m a−1. Both panels show the model domain (black line), the grounding line at the beginning of our control run (green line), glacier centre profile line (orange line) and a sample area (red square) 20 km inland. This square was chosen sufficiently far inland so that it always remained grounded throughout each experiment. Inset map shows Greenland ice flow speed [m a−1] in orange and the Petermann catchment outlined in black.
Alongside episodic calving, the extent of the PGIS is controlled by ice–ocean interactions that force high basal melt rates (~35 m a−1) beneath the shelf (Rignot and Steffen, Reference Rignot and Steffen2008). Indeed melting along the base of the ice shelf is considered to account for ~80% of mass loss from the PGIS (Rignot and others, Reference Rignot, Box, Burgess and Hanna2008; Münchow and others, Reference Münchow, Padman and Fricker2014). Recent warming ($\sim 0.2{\rm ^\circ C}$ ) of Atlantic water between 2002 and 2016 (Münchow and others, Reference Münchow, Falkner, Melling, Rabe and Johnson2011; Washam and others, Reference Washam, Münchow and Nicholls2018), accompanied by stronger ocean circulation and the break up of sea ice, is likely to have promoted warm water transport into the Petermann fjord and beneath the ice shelf (Johnson and others, Reference Johnson, Münchow, Falkner and Melling2011; Shroyer and others, Reference Shroyer, Padman, Samelson, Münchow and Stearns2017; Washam and others, Reference Washam, Münchow and Nicholls2018). In response to recent ocean warming and increased subglacial discharge, basal melt rates are estimated to have increased by 8.1 m a−1 from the 1990s to early 2000s (Cai and others, Reference Cai, Rignot, Menemenlis and Nakayama2017). The most recent estimates revealed 50 m a−1 of basal melt at the grounding line between 2011 and 2015 (Wilson and others, Reference Wilson, Straneo and Heimbach2017).
Reductions in the extent and/or thickness of the PGIS in future could reduce buttressing at the grounding line and accelerate ice flow. Accelerated ice flow has been documented following ice shelf thinning or collapse both across Antarctica (Antarctic Peninsula: Scambos and others (Reference Scambos, Bohlander, Shuman and Skvarca2004); De Rydt and others (Reference De Rydt, Gudmundsson, Rott and Bamber2015), Amundsen Sea region: Rignot and others (Reference Rignot, Mouginot, Morlighem, Seroussi and Scheuchl2014); Gudmundsson and others (Reference Gudmundsson, Paolo, Adusumilli and Fricker2019) and in East Antarctica: Miles and others (Reference Miles, Stokes and Jamieson2018)) and Greenland (Jakobshavn Isbræ, now Sermeq Kujalleq: Joughin and others (Reference Joughin, Abdalati and Fahnestock2004, Reference Joughin2008) and Zachariæ Isstrøm: Mouginot and others (Reference Mouginot2015)). It is therefore important to quantify the impact of losing the PGIS on future ice discharge and sea level rise. Previous work used a flowline model at PG to examine both the short-term response to ice shelf collapse (Nick and others, Reference Nick2012), and the long-term sea level rise contribution under scenarios of future climate change (Nick and others, Reference Nick2013). However, one-horizontal dimensional (1HD) models do not account for lateral stresses and buttressing in both horizontal directions which limits the accuracy of sea level rise projections (Gudmundsson, Reference Gudmundsson2013; Bondzio and others, Reference Bondzio2017). More recently, Hill and others (Reference Hill, Gudmundsson, Carr and Stokes2018b) used a two-horizontal dimensional (2HD) ice flow model Úa (Gudmundsson and others, Reference Gudmundsson, Krug, Durand, Favier and Gagliardini2012), to examine the time-independent response of PG to large calving events. While this showed ice shelf collapse could cause a 96% instantaneous speed-up, it did not examine the transient response of PG to a loss of ice-shelf buttressing. Thus, aside from using a flowline model (Nick and others, Reference Nick2012), no modelling study has yet assessed the impact of ice shelf thinning/collapse on PG's future contribution to sea level rise.
Here, we use Úa to assess the long-term (100 years) dynamic response and sea level contribution of PG to changes downstream of the grounding line. To do this, we perform four forward-in-time sensitivity experiments to assess the future evolution of PG under different scenarios of ice shelf change. The first represents a continuation of current conditions with no further change in ice shelf extent (control run). The following experiments were then designed to encompass the main mass loss mechanisms for the PGIS. The second raised basal melt rates but left the terminus position fixed through time. The following two experiments both impose enhanced basal melting but simulate two mechanisms of ice shelf loss. The third experiment episodically removes sections of the shelf, similar in size to past observed calving events, and the final experiment imposes immediate ice shelf collapse.
Methods
Model set-up
Úa (Gudmundsson, Reference Gudmundsson2020) is a vertically integrated ice flow model that solves the ice dynamics equations using the shallow ice-stream/shelf approximation (SSA) (Morland, Reference Morland, van der Veen and Oerlemans1987; MacAyeal, Reference MacAyeal1989), a Weertman-sliding law (Weertman, Reference Weertman1957) and Glen's flow law (Glen, Reference Glen1955). The model has been used to understand grounding line dynamics (Gudmundsson and others, Reference Gudmundsson, Krug, Durand, Favier and Gagliardini2012; Pattyn and others, Reference Pattyn2012) and the impact of ice shelf buttressing and collapse on outlet glacier dynamics in both Antarctica (De Rydt and others, Reference De Rydt, Gudmundsson, Rott and Bamber2015; Reese and others, Reference Reese, Gudmundsson, Levermann and Winkelmann2018a) and Greenland (e.g. Hill and others, Reference Hill, Gudmundsson, Carr and Stokes2018b).
To set-up the model we use 150 m resolution bedrock geometry, fjord bathymetry, ice thickness and surface topography from the BedMachine v3 dataset (Morlighem and others, Reference Morlighem2017). The model domain extends from the ice shelf front in 2016 across the ice surface drainage catchment of PG (~85 000 km2: Fig. 1). Our entire computational domain can be seen in Figure 1 and in Figure S1. We used the Mesh2D Delaunay-based unstructured mesh-generator (Engwirda, Reference Engwirda2014) to create a linear triangular finite-element mesh with 111 391 elements and 56 340 nodes (Fig. S1). The mesh was refined anisotropically based on three criteria: (i) flotation mask, (ii) measured flow speeds and (iii) surface elevation. Element sizes were ~0.3 km across the ice tongue, where flow speeds are >250 m a−1, and at ice surface elevations <750 m a.s.l. Where flow speeds are <10 m a−1 and surface elevation exceeds 1200 m a.s.l., element sizes reached a maximum of 15 km. Nunataks on the eastern side of PGIS were digitized in 2016 Landsat-8 imagery and treated as holes within the mesh, along the boundary of which we fix velocity to zero in both normal and tangential directions. Topographic parameters (ice surface, thickness and bed topography) were linearly interpolated onto this mesh. The boundary condition along the floating ice shelf terminus is hydrostatic ocean pressure in the normal direction, and free-slip in the tangential. Along the inland catchment boundary we used a fixed (no-slip in normal or tangential directions) zero velocity condition to conserve mass within our model domain. Velocities were also fixed to zero along the lateral ice shelf margins (excluding along the fronts of glaciers on the eastern side of the fjord) as this optimally replicates lateral stresses and ice flow along the PGIS (see Hill and others, Reference Hill, Gudmundsson, Carr and Stokes2018b).
We used inverse methodology to initialize the model. Initial observed velocities were taken from the 2016/17 MEaSUREs Greenland annual ice-sheet velocity mosaic (Joughin and others, Reference Joughin, Smith, Howat, Scambos and Moon2010b) derived from both optical (Landsat-8) and synthetic aperture radar data (TerraSAR-X, TanDEM-X, Sentinel-1A and 1B). We optimized our model to observed velocities by simultaneously estimating the basal slipperiness parameter (C) in the Weertman sliding law and the ice rheology parameter (A) in Glen's flow law (see Fig. S2). The stress exponents in the Weertman sliding law (m) and Glen's flow law (n) were both set to 3, as commonly used in glaciological studies. This same inverse methodology and model has now been used in a number of previous studies (Hill and others, Reference Hill, Gudmundsson, Carr and Stokes2018b; Reese and others, Reference Reese, Winkelmann and Gudmundsson2018b; Gudmundsson and others, Reference Gudmundsson, Paolo, Adusumilli and Fricker2019). Inversion was done by minimizing the cost function of a misfit and regularization term. Úa uses the adjoint method to calculate the gradients of the cost function with respect to A and C in a computationally efficient way. Regularization of the A and C fields is imposed using Tikhonov regularization of both the amplitude and spatial gradients of A and C. We tested a series of regularization parameter values and selected final values based on an L-curve analysis. After a total of 900 iterations, the mean difference between modeled and observed velocities was 9.5 m a−1 (15%). This increased to 14 m a−1 where speeds are >300 and to 23 m a−1 along the PGIS.
Annual surface mass balance (SMB) for all experiments were input from RACMO2.3 (1 km resolution) (Noël and others, Reference Noël2016), averaged between 2011 and 2016, to reflect current mass-balance conditions. Basal melt rates (defined here as melting along the base of the floating shelf) at PGIS are correlated with ice thickness and are enhanced on either side of basal channels (Rignot and Steffen, Reference Rignot and Steffen2008; Wilson and others, Reference Wilson, Straneo and Heimbach2017). In line with a number of studies, we parameterize melt rates based on ice thickness (Joughin and others, Reference Joughin, Smith and Holland2010a; Favier and others, Reference Favier2014). Throughout our experiments basal melt rates mb at each timestep (t) were prescribed as a linear-function of ice thickness:

where the slope is determined using maximum floating ice thickness (h max) minus minimum floating ice thickness (h min) and the difference between minimum melt rates (m min: which we always set to 0 m a−1) and maximum (m max) melt rates for each experiment. Initially we impose a m max of 37 m a−1 to reflect near steady-state melt rates in previous studies (Rignot and Steffen, Reference Rignot and Steffen2008; Cai and others, Reference Cai, Rignot, Menemenlis and Nakayama2017). This reproduces the expected melt rate pattern beneath the shelf; highest at the grounding line (37 m a−1) and either side of basal channels, decreasing to 1 m a−1 near the terminus (Fig. 2).
Model initialization and control run
For forward transient experiments, Úa allows for a fully implicit time integration, where, at each time-step, changes in geometry, grounding line position and velocity are calculated implicitly. During each forward run, we incorporated automated adaptive time-stepping and automated time-dependent mesh refinement around the grounding line. Our adaptive time-stepping increases the timestep if the ratio between the maximum number of non-linear iterations over the previous 5 timesteps and the target number of iterations (set to 4) is less than one. We begin with a timestep of 0.01 years and set our target timestep to 1 year. Mesh refinement around the grounding line is known to improve estimates of stress distributions and migration rates of the grounding line (Durand and others, Reference Durand, Gagliardini, Zwinger, Meur and Hindmarsh2009; Goldberg and others, Reference Goldberg, Holland and Schoof2009; Pattyn and others, Reference Pattyn2012; Cornford and others, Reference Cornford2013; Schoof and others, Reference Schoof, Davis and Popa2017). Within 2 km of the grounding line, we locally refined element sizes to 100 m. We also performed mesh sensitivity experiments, and found our results were independent of the resolution of the mesh around the grounding line (see Supplementary Text S1). In a post-processing step, and for illustrative purposes, annual width-averaged grounding line retreat was then calculated using the commonly adopted box method (see Hill and others, Reference Hill, Carr, Stokes and Gudmundsson2018a).
In addition to transient mesh refinement, we calculate the basal melt rate field at each time step to account for changes in ice thickness (h) throughout our simulations. Maximum and minimum ice thickness values are updated at each time step but m max remains constant. This approach, using the difference in ice thickness at each timestep, has the effect of keeping the range of melting across the shelf constant despite reductions in ice thickness through time. In reality this reflects a warming at shallower water depths, but in the absence of additional information on how melt rates will change through time we choose to keep the range of melt rates constant in time across the shelf. Melt rates are applied to every floating and partially floating node at each time step. While applying melt rates right at the grounding line (at partially floating nodes) can overestimate mass loss (Seroussi and Morlighem, Reference Seroussi and Morlighem2018) we performed a sensitivity experiment and found that this has a very limited affect on our results (see Fig. S7).
Using the initial input SMB, basal melt rates (m max = 37 m a−1), and estimates of basal slipperiness (C) and ice rheology parameter (A), we performed a control run. This control run was designed to reflect the future evolution of PG if melt rates remain low and no large calving events occur, but with some inland thinning ($\sim 1\ {\rm m\ a^{-1}}$ ) similar to observations (Fig. 2: Simonsen and Sørensen, Reference Simonsen and Sørensen2017). It was not meant to replicate steady-state conditions, i.e. total mass balance equal to zero. First, we allowed for a short period of model relaxation, as experience has shown that transient runs tend to exhibit a short period of anonymously high rates-of-change following initialization. We calculated the approximate total mass balance (M total) at the beginning of this run, based on the total melt flux (M basal and M surface) minus the approximate calving flux (M calving). This is not calculated explicitly within our model as we do not account for calving but is instead based on fixed (width × height × velocity) at the glacier terminus:

At time 0 our estimated calving flux is 0.99 Gt a−1, total melt flux is $-3.2\ {\rm Gt\ a^{-1}}$ and total mass balance is therefore $-4.19\ {\rm Gt\ a^{-1}}$
 . Initial elevation changes were in good agreement with Cryosat 2.2 elevation changes from 2011 to 2016 (Fig. 2), albeit slightly lower due to imposing near to steady-state melt rates (see Fig. S4). Over the entire control run there was almost no change from our initial mass balance. These early changes in mass balance over the first 10 years are shown in Figure S6. However, some variability occurred within the first 10 years, so we discarded these as model drift and time=10 years was the starting point for all further experiments. We note that our final results are not sensitive to the selected duration of this initial relaxation period as our total modelling time is several times larger, and the changes within the first 10 years are small with respect to the total mass balance.
After running the model for 10 years, to account for the period of model drift, we ran our control run forward in time for 100 years, during which there was no change in melt rates or horizontal extent of the ice shelf. The terminus position is fixed through time and is not allowed to advance or retreat freely. Throughout this, the grounding line position was stable, and the flux across the grounding line (9.85 Gt a−1) remained similar to observations (Wilson and others, Reference Wilson, Straneo and Heimbach2017). As no perturbation in ice shelf extent was imposed, thinning rates remained small ($-0.17\ {\rm m\ a^{-1}}$ ), acceleration was limited (0.26 m a−2: Figs 3, 4), and the total contribution to sea level rise over 100 years was only 0.43 mm (Fig. 5, Table 1).
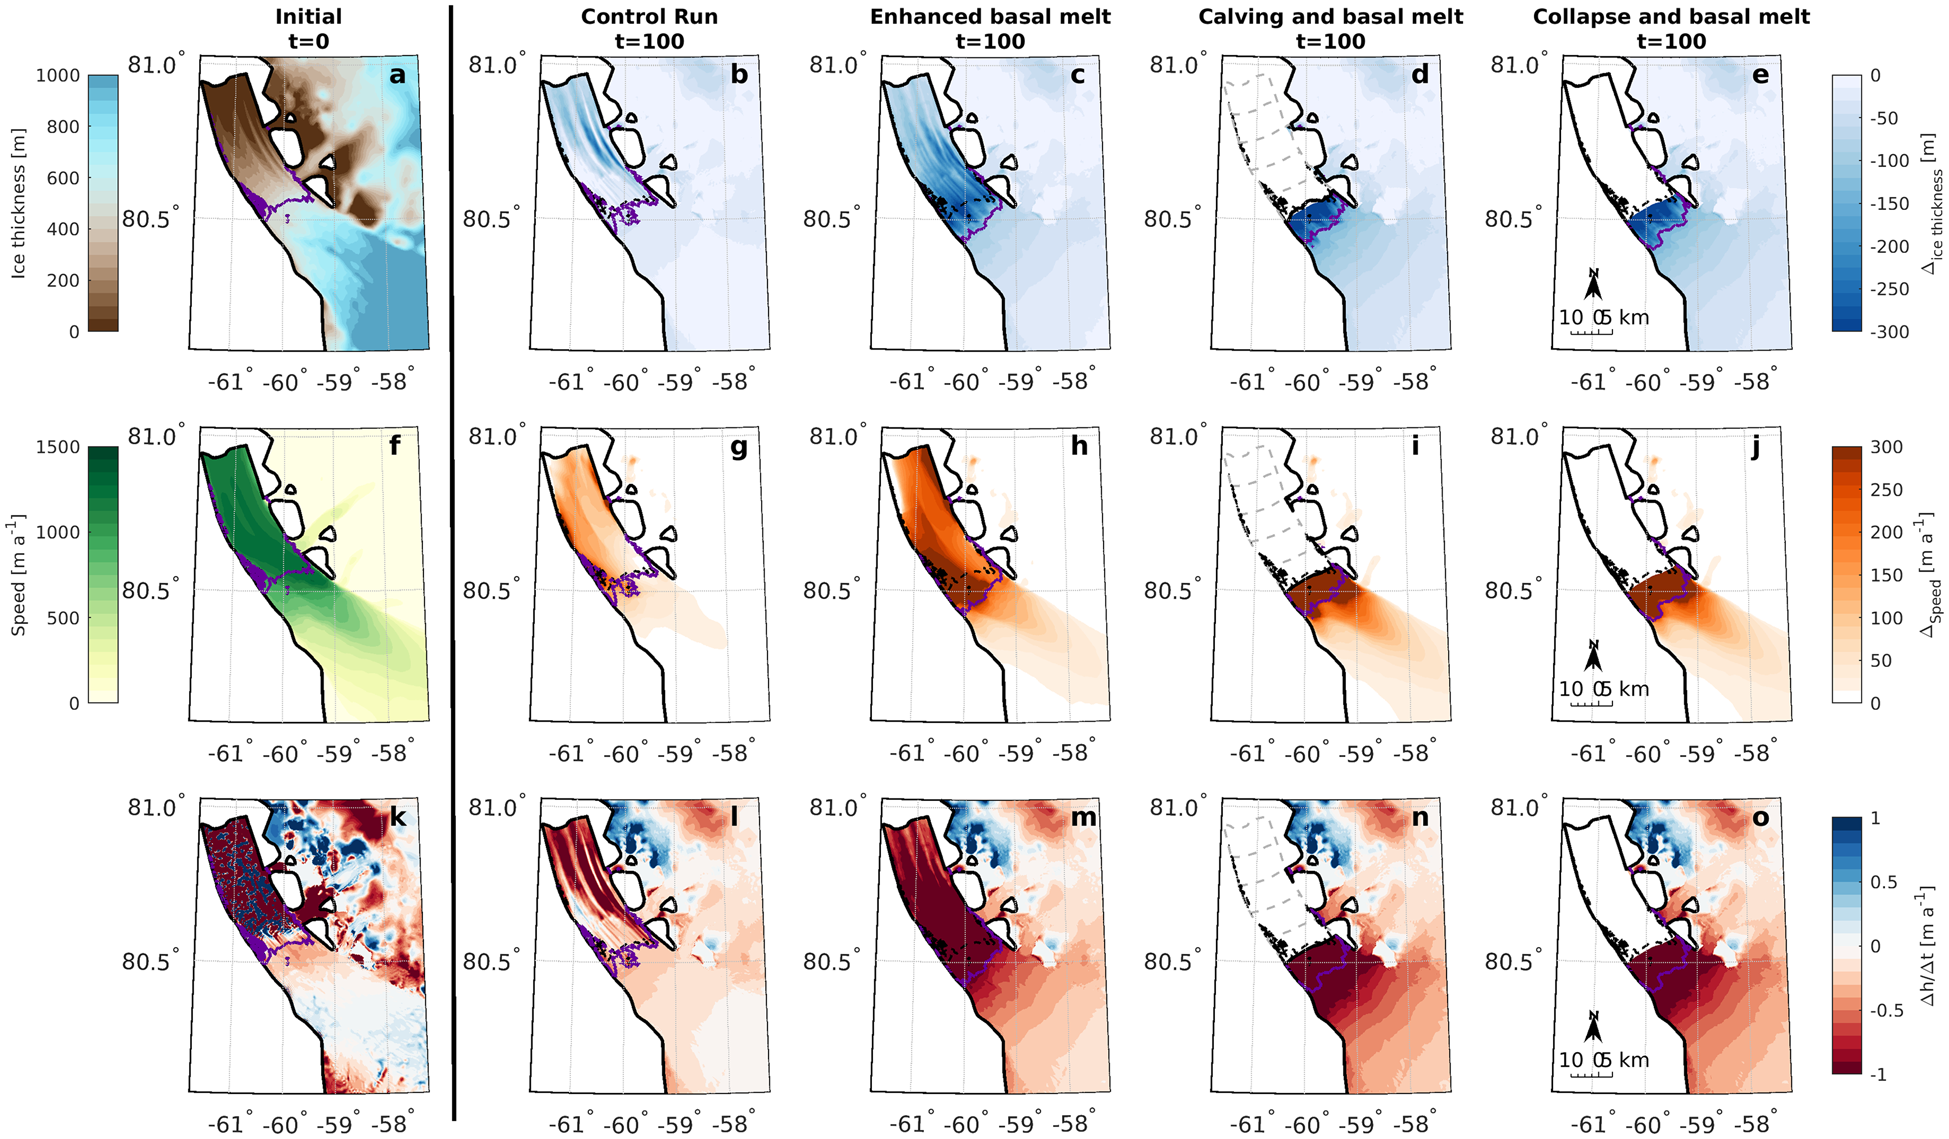
Fig. 3. Top row shows initial ice thickness [m] at time = 0 (a) and plots b–e show the change in ice thickness [m] after 100 years for each of our experiments. The middle row of plots shows initial ice speed (f) in m a−1 and plots g–j show change in speed [m a−1] after 100 years. The bottom row shows initial thinning rates after the initialization period (k) in m a−1 where red is thinning and blue is thickening, and plots l–o show thinning rates at the last simulation year (100 years) [m a−1]. In plots a, f and k, the green line represents the initial grounding line position. In all other plots the green line is the position of the grounding line after 100 years for each experiment. In d, i and n, the dotted lines represent calved icebergs at 5-year intervals between 5 and 25 years.
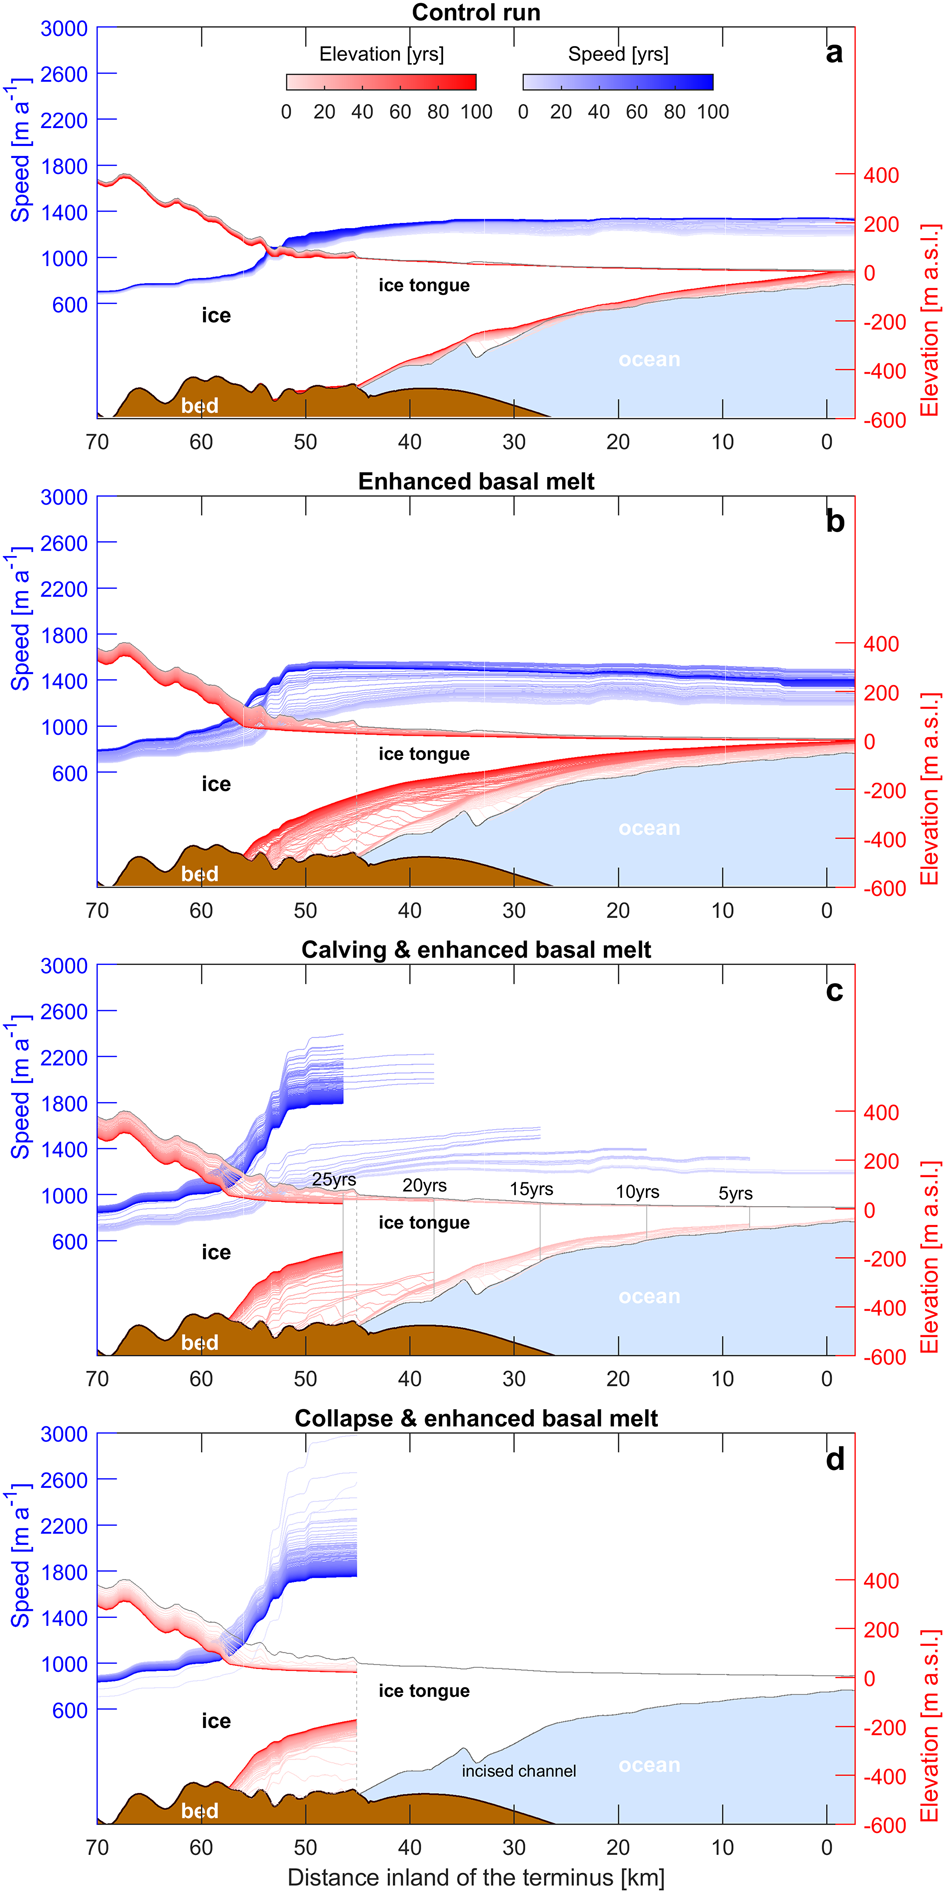
Fig. 4. Annual speed (blue) and elevation (red) along the Petermann Glacier centreline (sampled at 100 m intervals) for each of our model experiments (a–d). Pale to dark blue and pale to dark red represent each year between 0 and 100 for speed and elevation, respectively. The dotted grey line represents the initial grounding line position and the ice ocean and bed extents are from the BedMachine v3 dataset (Morlighem and others, Reference Morlighem2017). In plot c, the grey lines are sections of the PGIS removed at 5-year intervals between 5 and 25 years.
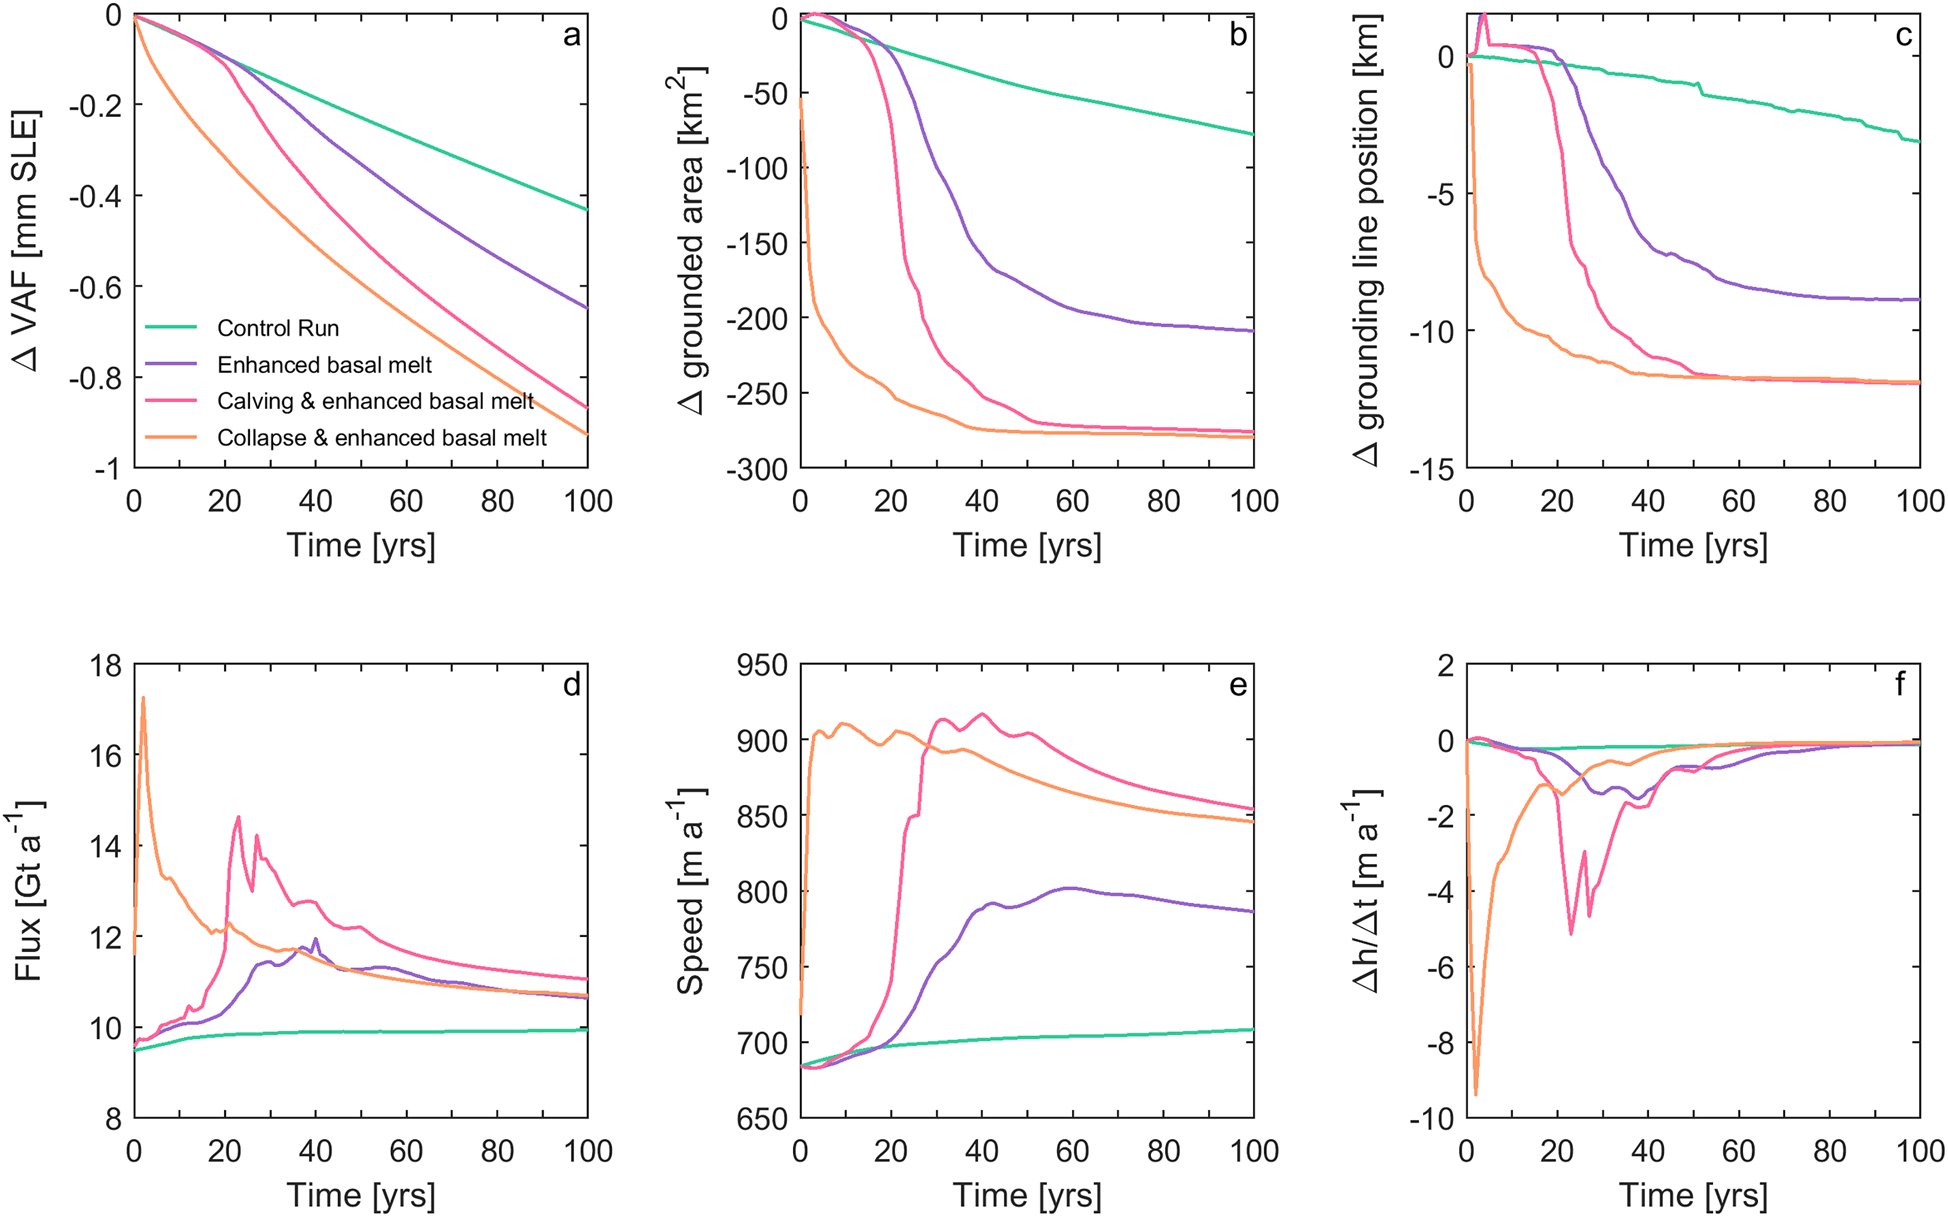
Fig. 5. Model results for each of our experiments; control run (green), enhanced basal melt (purple), prescribed calving and enhanced basal melt (pink), and ice tongue collapse and enhanced basal melt (orange). (a) Change in volume above flotation (VAF) in mm of global mean sea level equivalent. (b) Change in grounded area [km2]. (c) Width-averaged grounding line retreat [km], note some advance associated with re-grounding downstream of the main grounding line position. (d) Annual ice flux [Gt a−1] across the grounding line. (e) Average annual ice flow speeds [m a−1] within a 134 km2 square ~ 17 km inland of the grounding line (Fig. 2). (f) Average annual thinning rates (change in thickness (h) over time (t)) in m a−1 within our sample square.
Table 1. Thickness change (dh/dt), change in speed between 0 and 100 years and annual acceleration calculated within a square upstream of the grounding line
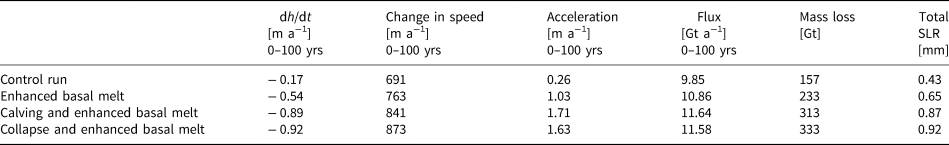
Acceleration is relative to initial velocities after 10-year relaxation period (after 0–10 control run). Flux is average grounding line flux for 0–100 years. Mass loss is the ice volume above flotation lost by the end of the 100-year period.
Experiments
Following our model initialization and control run, we performed three additional perturbation experiments. These experiments should not necessarily be viewed as projections but were designed to assess the sensitivity of PG to three distinct scenarios of ice shelf evolution over the next 100 years. We note that these experiments only assess the sea level rise contribution associated with ice shelf loss, as in all cases our SMB remains fixed in time. Our three experiments are:
(1) Enhanced basal melt rates and no change in ice tongue extent
(2) Enhanced basal melt rates together with prescribed episodic calving
(3) Immediate ice shelf collapse and enhanced melt in newly floating cells
Each of these experiments began after the 10-year initialization period, and we ran the model forward in time for 100 years. Our first experiment aims to assess the role of enhanced basal melt rates, and associated thinning of the shelf but with no perturbation in horizontal ice shelf extent. At the beginning of the simulation, we increased the maximum basal melt rate beneath the PGIS to m max = 50 m a−1, in line with the high-end of recent observational estimates (Wilson and others, Reference Wilson, Straneo and Heimbach2017). This maximum melt rate was then kept fixed throughout the experiment, despite changes in ice shelf thickness. It is possible that ocean warming in the future may enhance melt rates further at PG, but given the uncertainties associated with projecting future basal melt rates, we merely assess the impact of current melt conditions over the next 100 years. As a result, these estimates likely represent the low-end member response of PG to future ice tongue melt.
Our second experiment takes the enhanced basal melting from experiment one and additionally removed five large sections of the ice tongue (~180 km2) at 5-year intervals from 5 to 25 years (Fig. 1). This assumes that PG will continue to lose its ice tongue via episodic calving, similar in size to large calving events in 2010 and 2012 (Münchow and others, Reference Münchow, Padman and Fricker2014). Indeed, a large rift formed in 2016 suggesting calving is imminent (Münchow and others, Reference Münchow, Padman, Washam and Nicholls2016). As in experiment one, we updated the maximum melt rate to 50 m a−1 at the beginning of the simulation, and then at 5-year intervals we deactivated elements from our existing mesh, downstream of the new prescribed calving front position. In between, and after these calving front perturbations, we did not impose an additional calving law. Here, we aim to assess the response to current ice shelf retreat and eventual collapse, and not the future evolution once the glacier calves from a grounded terminus.
Our final experiment simulates another scenario of ice shelf loss, by removing it entirely at the beginning of the simulation. Since the early 2000s, several floating ice shelves have collapsed, across both Antarctica (e.g. Scambos and others, Reference Scambos, Bohlander, Shuman and Skvarca2004) and Greenland (Hill and others, Reference Hill, Carr, Stokes and Gudmundsson2018a). Washam and others (Reference Washam, Münchow and Nicholls2018) highlighted an incised channel close to the grounding line of PG (Fig. 4c). Enhanced melting within this basal channel could weaken the PGIS causing it to calve in its entirety. This experiment immediately removed the entire $\sim 885\ {\rm km}^{2}$ ice shelf at the start of the experiment. After this, we did not prescribe any further changes in ice front position, i.e. no calving law, in order to assess the longevity of the glacier response to initial ice shelf collapse. As the grounding line retreats we apply enhanced basal melt m max = 50 m a−1 to newly floating nodes in the domain, in the same way as in previous experiments.
Results
Role of enhanced basal melt
Our first experiment raised basal melt rates beneath the PGIS to range from 50 m a−1 at the grounding line to ~5 m a−1 near the terminus (Wilson and others, Reference Wilson, Straneo and Heimbach2017). Under these high melt conditions, the ice shelf thinned by ~100–300 m (Fig. 3c), accelerated by 300 m a−1 (Fig. 3h), and thinned by 2 m a−1 close to the grounding line and either side of streamlined basal channels (Fig. 3m). Greater basal melt-induced thinning of the shelf resulted in 48% more ice loss after 100 years (−233 Gt) than our control run. This is equivalent to 0.65 mm of global mean sea level rise (Table I).
During the first 20 years of the enhanced melt run, there was limited inland surface lowering or acceleration. However, 0.2 km of grounding line retreat led to a 24 km2 loss of grounded area (Fig. 5) and initiated positive feedbacks (e.g. acceleration, thinning and retreat) over the following 20 years. Greater thinning took place between 20 and 40 years close to the grounding line (188 m) compared to our control run (Fig. 4b). Crucially, this thinning likely decreased back-stress at the grounding line, causing it to retreat rapidly (6.8 km from 20 to 40 years) and un-ground 134 km2 of ice. Subsequently further inland ice flow speeds increased by 13%, thinning rates rose to 1 m a−1, and there was a 16% increase in ice flux across the grounding line (Fig. 6). However, acceleration and thinning were confined to ~10 km inland of the initial grounding line (Figs 3, 4). Between 60 and 100 years, acceleration and thinning rates decreased, and the grounding line appeared to stabilize ~9 km inland (Fig. 5). Thus, with no further perturbation of the ice shelf (i.e. no further increase in basal melt rates or fracture driven calving), PG approached stable conditions (e.g. constant flow speeds and no further grounding line retreat: Fig. 5) after 60 years.

Fig. 6. (a) Centreline profile (shown in grey on b) of ice surface and bed topography of Petermann Glacier. Dashed brown lines show the errors in bed topography extracted along the profile from the BedMachine v3 dataset (Morlighem and others, Reference Morlighem2017). Annotated numbers along this profile are the degree of the bed slope between the arrows. We note that the errors in bed topography are small, and do not effect the direction and steepness of the slope along the profile. (b) Plan view of the grounding line region of Petermann Glacier, displaying fjord widths at several locations: at the initial grounding line position, at the final grounding line position after 100 years in our third perturbation experiment, and further inland. We note that there is little change in fjord width between these locations.
Episodic calving and enhanced basal melt
Our second experiment shows that the gradual loss of buttressing associated with gradual ice tongue collapse and enhanced ice shelf thinning caused a larger stress perturbation at the grounding line than enhanced basal melting alone. This led to greater inland thinning and acceleration (Figs 3j, o) and a total ice volume loss of 313 Gt (Table I). Despite greater ice loss, the contribution to global mean sea level rise was still limited to 0.89 mm after 100 years (Fig. 5a).
Consistent with earlier work (Nick and others, Reference Nick2012; Hill and others, Reference Hill, Gudmundsson, Carr and Stokes2018b), our results show that the glacier response to calving differs between removing the lower or upper portions of the PGIS. After removing the first three sections of the ice shelf (at 5, 10 and 15 years), ice flow at the terminus accelerated by only 5–10% in the 5 years between each calving event (Fig. 4d). The grounding line simultaneously retreated at 60 m a−1 (total of 1.2 km), which is similar to retreat in the early stages of our basal melt experiment (Fig. 5c). This resulted in 46 km2 loss of grounded area, equivalent to 0.1 mm of sea level rise. However, further inland limited change took place, with only 6% flow acceleration and 0.05 m a−2 increase in thinning rates (Fig. 5). This indicates that the glacier force balance was not significantly altered by removing these sections of the shelf. In addition, the lower ice shelf includes the large fracture that formed in 2016 (Münchow and others, Reference Münchow, Padman, Washam and Nicholls2016), which Rückamp and others (Reference Rückamp, Neckel, Berger, Humbert and Helm2019) showed is likely to have already de-coupled the lower part of the shelf, causing a reduction in buttressing and some speed-up after its formation.
Removing thicker (Fig. 4) and stiffer (Fig. S2) sections of the PGIS closer to the grounding line caused greater loss of contact with the side-walls, and thus a larger reduction in lateral resistive stress acting on grounded ice. Removing the fourth section of the shelf led to terminus acceleration of 41%, which was four times the acceleration after previous calving events. Some terminus deceleration occurred from 23 to 25 years, but speeds remained high further inland (Fig. 5e), and increased by a further 330 m a−1 at the terminus after the final calving event. Crucially, losing these upper sections of the shelf caused the grounding line to retreat a further ~8 km by 30 years (Fig. 5c). Retreat of the grounding line into a region of thicker ice inland led to a 240% increase in thinning rate, 25% flow acceleration and 31% increase in ice flux during 19–30 years (Figs 3, 5). Importantly, this period of dynamic readjustment (inland acceleration thinning and grounding line retreat) lasted ~10 years longer than under basal melting alone (Fig. 5). However, after 70 years, PG appeared to have returned to conditions prior to the perturbation, indicated by slow deceleration (−0.67 m a−1), thinning rates returning to initial levels (−0.12 m a−1), and the grounding line stabilizing at 3 km further inland of our previous experiments (Fig. 5c).
Impact of immediate ice tongue collapse
Our final experiment showed that if the PGIS were to instantly collapse from its current state in 2016, PG would experience increased thinning and acceleration (Figs 3d, i and n) relative to any of our previous experiments but the impact of ice shelf collapse and subsequent enhanced melt would still be limited: the glacier would lose about 333 Gt of ice after 100 years (Table I). While this is more than double the ice loss from our control run, and greater than removing the ice tongue episodically, it is equivalent to a global mean sea level rise of only 0.92 mm (Fig. 5a).
Our results indicate that an instant removal of the entire ice shelf in contact with the grounding line appeared to cause a greater loss of buttressing than gradual sub-shelf thinning and episodic calving (Experiment 2). This was evident in the first 5 years where the grounding line retreated 8.2 km (Fig. 5c), and there was a near instantaneous increase in ice flux across the grounding line reaching a maximum of 17 Gt a−1 at year three (Fig. 5d). Substantial surface lowering (31 m) and a 116% ($+ 1380\ {\rm m\ a^{-1}}$ ) increase in flow speed at the terminus indicates a loss of back-stress (Fig. 4d). Changes at the terminus propagated inland, where thinning rates increased fivefold (averaging 5.8 m a−1) and speeds increased to ~900 m a−1 ($+ 33\percnt$
 ) over the first 5 years (from our upstream sample square: Fig. 5). After the initial period of acceleration, increased ice flux, and rapid retreat of the grounding line (0–10 years), PG appeared to dynamically adjust to the loss of buttressing. Between 10 and 35 years, grounding line retreat slowed to 0.08 km a−1 and ice flux decreased to 11.7 Gt a−1. During this period ice flow speeds and thinning rates further inland subsided, indicating a reduction in glacier driving stress (Fig. 5d). After 35 years the grounding line occupied a similar position as it did after 50 years in our episodic calving experiment, and remained stable for the remaining 65 years.
Discussion
Our modelling experiments show that future changes in the extent of the PGIS (via melt only, calving or entire collapse) can cause thinning, acceleration and grounding line retreat. Of our three scenarios of ice shelf loss, immediate collapse and enhanced basal melting (up to 50 m a−1) as the grounding line retreats, appeared to cause the greatest loss of buttressing and led to a doubling of the sea level rise contribution from 0.43 mm (if current conditions are maintained) to 0.92 mm after 100 years (Table I). Immediate thinning and acceleration after shelf collapse is consistent with the observed behaviour of Jakobshavn Isbræ (Joughin and others, Reference Joughin, Abdalati and Fahnestock2004; Thomas, Reference Thomas2004) and Zachariæ Isstrøm (Mouginot and others, Reference Mouginot2015; Hill and others, Reference Hill, Carr, Stokes and Gudmundsson2018a) in Greenland, and glacier acceleration following the Larsen B ice shelf collapse in Antarctica (Scambos and others, Reference Scambos, Bohlander, Shuman and Skvarca2004; De Rydt and others, Reference De Rydt, Gudmundsson, Rott and Bamber2015). However, despite this, PG appeared to adjust to the loss of buttressing after ~ 40 years, after which there was limited grounding line retreat, and without an increase in calving after future collapse the shelf may regrow (Nick and others, Reference Nick2012). We do not assess that here, but suggest it warrants further investigation. Our other experiments (melt only, and prescribed calving) were able to prolong the dynamic glacier response up to ~ 60 years. However, the response to basal melt alone was relatively muted (0.65 mm of sea level rise), primarily due to leaving the calving front position fixed, whereas in reality sub-shelf thinning is likely to act as a precursor to calving (Münchow and others, Reference Münchow, Padman and Fricker2014). While episodic calving of the PGIS (particularly closer to the grounding line) in combination with sub-shelf thinning, caused 0.87 mm of sea level rise, this remains less than immediate collapse, as PG likely had time between calving events to readjust to stress imbalances.
Despite some dynamic change at PG, the global impact on sea level rise remains limited. Hence, the key conclusion from these experiments is that, in all cases, ice tongue perturbations were unable to force long-term instability of PG, i.e. irreversible thinning, acceleration and grounding line retreat. We attribute this insensitivity primarily to a stabilization of the grounding line. In all experiments the grounding line positions retreated to within 3 km of each other (Figs 5c, S3). Crucially, this stabilization limits the sea level rise contribution of PG to <1 mm over the next 100 years. This is much smaller than projections from Jakobshavn Isbræ (2.77–5.7 mm) by 2100 (Bondzio and others, Reference Bondzio2017; Guo and others, Reference Guo, Zhao, Gladstone, Sun and Moore2019) and Zachariæ Isstrøm (up to 16 mm in an extreme case: Choi and others, Reference Choi, Morlighem, Rignot, Mouginot and Wood2017) but is similar to the lowest emissions scenario (A1B) projections at Petermann and Kangerdlugssuaq (~ 1 mm: Nick and others, Reference Nick2013). We now discuss several factors limiting grounding-line migration and ice loss. These are: (i) bed topography, (ii) lateral confinement/ fjord width, (iii) fixed terminus position and (iv) basal slipperiness.
Bed slope is known to impact stability of glacier grounding lines (Schoof, Reference Schoof2007; Choi and others, Reference Choi, Morlighem, Rignot, Mouginot and Wood2017) in the absence of additional buttressing from the lateral margins (Gudmundsson and others, Reference Gudmundsson, Krug, Durand, Favier and Gagliardini2012; Haseloff and Sergienko, Reference Haseloff and Sergienko2018). Initial retreat of PG's grounding line was over a shallow retrograde slope 8 km inland (− 0.39°: Fig. 6a). In all of our experiments we observed a slowdown in grounding line retreat after 50 years (Fig. 5c). This is partly due to the absence of additional forcing, but also due to the transition to a steeper seaward sloping (+ 0.7°) portion of the bed inland (~ 42 − 50 km inland on Fig. 6a). It is likely that this prograde slope forced the grounding line to stabilize at this position. This is consistent with the observed stability of grounding lines on prograde bed slopes in west Greenland (Catania and others, Reference Catania2018), and the role of bed topography on the retreat of glacier termini elsewhere in Greenland (Bunce and others, Reference Bunce, Carr, Nienow, Ross and Killick2018; Brough and others, Reference Brough, Carr, Ross and Lea2019). At PG, a seaward sloping bed topography is likely to have been a key control that limited past grounding line retreat (Hogg and others, Reference Hogg, Shepherd, Gourmelen and Engdahl2016). In addition, previous modelling experiments have also shown that basal topography may limit 21st century grounding line retreat (Nick and others, Reference Nick2013). Elsewhere in Greenland, deep bed topography has allowed runaway grounding line retreat after ice shelf collapse. For example, the collapse of Jakobshavn Isbræ's ice shelf was followed by grounding line retreat and acceleration (Joughin and others, Reference Joughin2008, Reference Joughin, Smith, Shean and Floricioiu2014), which is projected to continue throughout the 21st century due to deep bed topography further inland (Bondzio and others, Reference Bondzio2017; Guo and others, Reference Guo, Zhao, Gladstone, Sun and Moore2019). Similarly, at Zachariæ Isstrøm, collapse of the ice shelf by 2012 was followed by acceleration, thinning and grounding line retreat down a retrograde bedslope (Mouginot and others, Reference Mouginot2015; Hill and others, Reference Hill, Carr, Stokes and Gudmundsson2018a). It is also projected to undergo unstable retreat of the grounding line ~30 km inland by 2100 and contribute at least 1.7 mm to sea level rise (Choi and others, Reference Choi, Morlighem, Rignot, Mouginot and Wood2017). However, PG appears unlikely to undergo rapid unstable retreat associated with marine ice-sheet instability as suggested for regions of West Antarctica (e.g. Favier and others, Reference Favier2014). Instead, PG is likely to behave more similarly to the projected response of 79 North Glacier. Here, Choi and others (Reference Choi, Morlighem, Rignot, Mouginot and Wood2017) showed that substantial grounding line retreat, and thus sea level rise contribution (1.12 mm by 2100) will be prevented by a stabilization of the grounding line at a step in bed topography. Thus, the absence of retrograde bed topography at PG suggests that it is also unlikely to undergo unstable retreat over the next 100 years.
In addition to the role of bed topography, channel width can also modulate grounding line retreat (Jamieson and others, Reference Jamieson2012; Åkesson and others, Reference Åkesson, Nisancioglu and Nick2018), and has been identified as a key control on the retreat of numerous glaciers using both modern (e.g. Carr and others, Reference Carr, Stokes and Vieli2014; Steiger and others, Reference Steiger, Nisancioglu, Åkesson, De Fleurian and Nick2018; Catania and others, Reference Catania2018) and palaeo records (Jamieson and others, Reference Jamieson2014; Stokes and others, Reference Stokes, Corner, Winsborrow, Husum and Andreassen2014). PGIS is well-confined within its narrow fjord, and hence, its collapse leads to a loss of lateral resistive forces and buttressing. Indeed, our results showed inland acceleration and thinning (Figs 4, 5) following ice shelf collapse, which is indicative of a loss of resistive stress at the grounding line. This behaviour contrasts with observations elsewhere in northern Greenland, e.g. C H. Ostenfeld Glacier. Here, collapse of a laterally unconfined ice shelf did not lead to inland acceleration, which indicates that the ice shelf provided limited buttressing at the grounding line (Hill and others, Reference Hill, Carr, Stokes and Gudmundsson2018a). Importantly, once PG's grounding line has initially retreated in response to an ice tongue perturbation, the fjord width further inland does not vary substantially (< 1 km: Fig. 6b). Hence, it is likely that while the grounding line retreated, there was no significant reduction in lateral drag, which in turn prevented a positive feedback of continued grounding line retreat.
Alongside glacier geometry (bed topography and fjord width) we acknowledge that there are additional factors that may have controlled the final grounding line position. First, in all of our simulations and aside from our prescribed calving front position in experiment three, the terminus position is fixed. It is therefore possible that in the absence of additional forcing (e.g. continuous calving at the grounding line after ice shelf collapse), the glacier readjusted and became stable at the new grounding line position. Secondly, the slipperiness of the bed can also be sensitive to ice shelf buttressing (Gudmundsson, Reference Gudmundsson2003; Schoof, Reference Schoof2007). We acknowledge that our inversion method means our slipperiness estimate is fixed in time and consequently does not allow for regions of low basal drag to migrate inland. Immediately inland of the final grounding line position lies a section of reverse bed slope that may allow for some accelerated retreat as the grounding line moves through this region in the future. Errors in bed topography are small (16 m) compared to ice thickness (~ 700 m: Fig. 6) along the region of grounding line retreat in our experiments. However, between 50 and 60 km along the glacier centreline, errors in bed elevation increase to 50 m. Given these uncertainties in bed topography, and the limitations outlined above (i.e. fixed terminus and basal slipperiness) we cannot rule out that the grounding line will retreat further over the next 100 years. Crucially, after ~60 km (Fig. 6a), the bed topography becomes steep (+1.56°) and seaward sloping, before flattening out. Thus, if additional forcing in our experiments had forced the grounding line further inland, we do not anticipate a dramatic increase in PG's contribution to sea level rise, as this steep topography would likely prevent runaway retreat of the grounding line. Further work that directly assesses the sensitivity of PG to bed topography and basal sliding is needed.
Conclusions
Here, we present the results of three modelling experiments that perturb the extent of the PG ice shelf to explore its sensitivity to various forcings and its dynamic response and potential sea level rise contribution over the next 100 years. Our results have shown that under several scenarios of ice shelf thinning and retreat, unstable rapid retreat of PG's grounding line is unlikely over the next 100 years. Under enhanced basal melt alone, PG will lose 233 Gt of ice, almost 100 Gt more than if current conditions are maintained. Ice loss is greater (313 Gt) if the ice shelf calves away episodically alongside enhanced melt rates, due to a loss of buttressing from the laterally confined portions of the shelf near the grounding line. Immediate collapse of the shelf further increases ice loss to 333 Gt of volume above flotation by 2100, equivalent to 0.92 mm of global mean sea level rise. It appears that glacier geometry is the dominant control on grounding line retreat and the grounding line could stabilize at a rise in bed topography ~12 km inland of its current position. This stabilization could prevent a substantial contribution to global mean sea level rise in response to the loss of the ice shelf. The question still remains as to the future stability of PG if the entire ice shelf collapses, and calving then occurs from a grounded terminus. However, unlike glaciers with former ice shelves elsewhere in Greenland (Zachariæ Isstrøm and Jakobshavn Isbræ/Sermeq Kujalleq), where deep retrograde beds and widening fjords allowed for sustained retreat after ice shelf collapse (Mouginot and others, Reference Mouginot2015; Choi and others, Reference Choi, Morlighem, Rignot, Mouginot and Wood2017; Guo and others, Reference Guo, Zhao, Gladstone, Sun and Moore2019), PG's inland geometry (steep prograde bed and narrow fjord: Fig. 6) does not suggest that grounded ice calving will force rapid unstable retreat in the future. Hence, PG may be geometrically constrained from becoming sensitive to calving in the future.
Acknowledgments
This research was funded by a Natural Environment Research Council Doctoral Scholarship (grant number: NE/L002590/1) awarded to E. A. Hill through the IAPETUS Doctoral Training Partnership and Newcastle University, UK. The ice flow model (Úa) used to conduct this study can be acquired from http://doi.org/10.5281/zenodo.3706624 (Gudmundsson, Reference Gudmundsson2020). All datasets used to produce the results of this paper are available as follows. The RACMO2.3 Greenland surface mass-balance dataset was provided on request by Brice Noël and Michiel van den Broeke, to whom we are grateful. Additional datasets are freely available via the following sources: the Operation IceBridge BedMachine version 3 dataset (Morlighem and others, Reference Morlighem2017) available at doi.org/10.5067/2CIX82HUV88Y, and Greenland annual ice-sheet velocities (Joughin and others, Reference Joughin, Smith, Howat, Scambos and Moon2010b) from the MEaSUREs program available at doi.org/10.5067/OC7B04ZM9G6Q. We are grateful to the Editor and two anonymous reviewers for their comments on the manuscript.
Supplementary material
The supplementary material for this article can be found at https://doi.org/10.1017/jog.2020.97.


 Open access