


1. Introduction
Several areas of investigation in Antarctica benefit from knowledge of the attenuation length of radio-frequency transmissions in glacial ice. These research areas include radar mapping of subglacial terrain and lakes, location and characterization of subglacial streams, look-ahead radar for over-ice traverses, and detection of particle interactions in the ice.
We belong to a community of particle astrophysicists aiming to identify high-energy neutrinos (produced in astrophysical sources) via the radio emission accompanying their interaction in Antarctic ice shelves and sheets (RICE Collaboration, 2003; Reference BarwickBarwick, 2007; Reference HoffmanHoffman and AURA Collaboration, 2007; Reference AllisonAllison and others, 2010; ANITA Collaboration, 2010). Neutrino interactions initiate a cascade of charged particles moving in a thin pancake ∼0.1 m in extent that traverses tens of meters of ice before extinction. The charged particles move near the speed of light, c, faster than the velocity of light in ice, which is reduced by an index of refraction, n, of ∼1.78. The electric field thus forms an electromagnetic shock wave analogous to a sonic boom, known as Cherenkov radiation. Given the size of the charged particle pancake, the emission among all charges sums coherently for frequencies up to several GHz. This coherence, and the possibility of finding high-energy neutrino-induced cascades in large natural media such as ice, was first identified by Reference AskaryanAskaryan (1962).
More recent numerical simulations confirmed and expanded the modeling of this emission (Reference Halzen, Zas and StanevHalzen and others, 1991; Reference Alvarez-Muñiz, Marqués, Vázquez and ZasAlvarez-Muñiz and others, 2003; Reference RazzaqueRazzaque and others, 2004). The process was subsequently confirmed experimentally in a variety of dielectric media, including ice, using showers initiated by high-energy electron and photon beams (ANITA Collaboration, 2007).
Because the neutrino detection rate is a strong function of the radio-transparency of glacial ice, knowing the attenuation length to a reliable precision at several locales in Antarctica is of key importance. Extractions of attenuation length for a variety of Antarctic locations have been ongoing for several decades. For a recent compilation, see Reference Barwick, Besson, Gorham and SaltzbergBarwick and others (2005, fig. 1). Most of these values are based on the a.c. conductivity of ice (either directly measured or estimated from impurity measurements), from which the loss tangent,
and attenuation length are extracted using temperature profiles (Reference Fujita, Matsuoka, Ishida, Matsuoka, Mae and HondohFujita and others, 2000; Reference MatsuokaMatsuoka and others, 2003; Reference MacGregor, Winebrenner, Conway, Matsuoka, Mayewski and ClowMacGregor and others, 2007). In Equation (1), ε′ and ε″ are the real and imaginary parts of the complex dielectric constant of the material, ε = ε′ − iε″. From the loss tangent, and its expected variation with temperature, the intensity loss in dB m−1, at a frequency v, is ![]() . This loss, known as the attenuation coefficient, α, is related to the electric field attenuation length (m) by
. This loss, known as the attenuation coefficient, α, is related to the electric field attenuation length (m) by
For a full description of the electromagnetic phenomena of radio-frequency attenuation in glacial ice see Reference Bogorodsky, Bentley and GudmandsenBogorodsky and others (1985) and Reference Dowdeswell and EvansDowdeswell and Evans (2004).
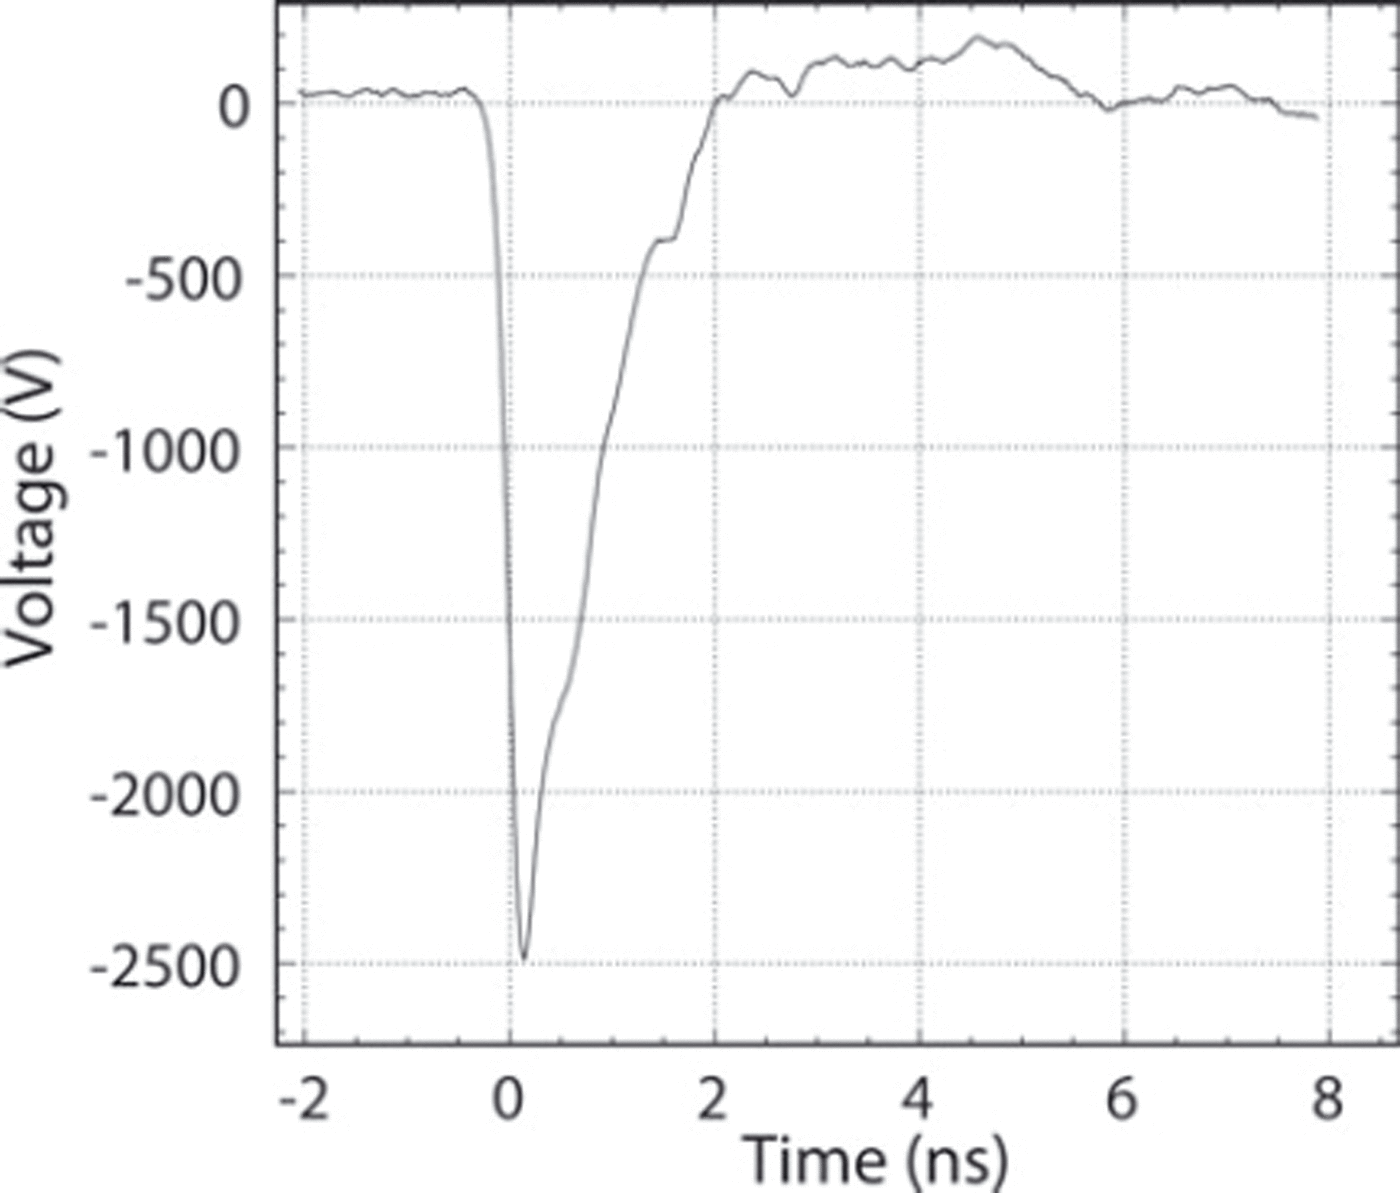
Fig. 1. Unfiltered output of the high-voltage pulser (HYPS) into 50Ω.
Neutrino searches and the other fields discussed should benefit from in situ measurements of the total attenuation length, to complement those of the a.c. conductivity. Several such recent measurements have been performed on the ice sheet of the Antarctic plateau: one (250–1000 MHz) at Taylor Dome, near the Transantarctic Mountains, East Antarctica (ANITA Collaboration, 2008), one (220–700 MHz) near the South Pole (Reference Barwick, Besson, Gorham and SaltzbergBarwick and others, 2005), one (140–160 MHz) at the West Antarctic Ice Sheet (WAIS) Divide (Reference LairdLaird and others, 2010) and one using much lower frequencies (∼5 MHz) at Siple Dome, West Antarctica (Reference Winebrenner, Smith, Catania, Conway and RaymondWinebrenner and others, 2003).
In this paper, we report the measurement of the attenuation length in a floating ice sheet over the range 75–1250 MHz. Specifically, we performed a radar bounce through the Ross Ice Shelf at a location in Moore Embayment just south of Minna Bluff (78°45.022′ S, 164°59.291′ E). This region was chosen because in previous work on basal ice-shelf reflectivity it was found to be highly reflective to radar (Reference NealNeal, 1979), consistent with a smooth mirror-like surface below. Having a low-loss reflective surface at the bottom allows us to take a measurement of the returned power and directly extract an attenuation length. The smoothness of the lower surface of an ice shelf (Fimbul Ice Shelf) is confirmed by recent sonar measurements from the sea below (Reference NichollsNicholls and others, 2006) to be mirror-like down to wavelengths of 0.0075 m. The wavelengths considered here, within the n = 1.78 bulk ice, range from 0.13 to 2.25 m, so we expect a high reflectivity. For this measurement we assume a nominal reflection coefficient of R = 1.0. A true lower value would only lead to longer attenuation lengths from our data, and for our purpose, R = 1.0 is conservative for neutrino detector design. We show later the effect of reasonable variations on R and we find that the effect is small due to the presence of the square root and logarithm in Equation (2).
Balloon-borne neutrino observations can include downward-pointing neutrino events whose radio emission is reflected back upward. It should be noted that for a balloon observation of the entire ice shelf, not all locations will have excellent reflectivity (Reference NealNeal, 1979). However, a fixed detector may be placed on the surface above the smoothest ice–sea interface. The thickness of Moore Embayment and its proximity to McMurdo station hold promise for this location as a site for a future neutrino detector deployed on its surface. Although this ice is warmer and expected to have a shorter attenuation length than measured on the plateau, our simulations show that it will be sufficient to work as a neutrino detector, with an added boost from reflected events (Reference BarwickBarwick, 2007). The purpose of this work is to confirm that the attenuation length is at least as long as the value used in that study. Our results indicate attenuation lengths 1.5–2.5 times longer (better) than used in that estimate.
2. Experimental Approach
Our basic approach is similar to that of previous work (Reference Barwick, Besson, Gorham and SaltzbergBarwick and others, 2005; ANITA Collaboration, 2008). We transmit a high-voltage impulse, with broadband frequency content, into the ice and measure the return power versus frequency in another antenna. We compare this to the transmission of the same pulse through a short distance, r, in air. After accounting for the 1/r 2 geometrical factor, the remaining loss is ascribed to attenuation, in which we include scattering. We assume 100% reflection at the interface of ice and sea water, which yields a conservative value for the attenuation length. Systematic uncertainties in the transmission and reception are reduced by using only voltage ratios. Moreover, because we are measuring over a long distance, i.e. several times the attenuation length, the remaining systematic uncertainties in the ratio enter only through a logarithm, as shown below.
The transmitted power per unit area is reduced by two effects: a 1/r
2 factor due to the spreading of the wave, and an exponential factor exp(−2r/〈Lα
〉) due to losses, where 〈Lα
〉 is averaged over depth. The factor of two accounts for power being the square of the electric field. We define Pv
to be the power spectral density at frequency v of the pulse as received by a 50Ω receiver, and Vν
to be ![]() . We further define V
v
, ice to be Vv
measured after being transmitted through the ice and back to our receiver, and Vv
, air to be Vν
after being transmitted horizontally through the air between the two antennas separated by d
air, typically 9 m. (For the in-air calibration, the antenna centers were 2 m above the top of the firn. Given the directivity of the antennas, the effect of multipath on the calibration is small.) We show later that d
ice (twice the ice depth) is 1155 m. Hence, before considering different transmission efficiency into air versus ice,
. We further define V
v
, ice to be Vv
measured after being transmitted through the ice and back to our receiver, and Vv
, air to be Vν
after being transmitted horizontally through the air between the two antennas separated by d
air, typically 9 m. (For the in-air calibration, the antenna centers were 2 m above the top of the firn. Given the directivity of the antennas, the effect of multipath on the calibration is small.) We show later that d
ice (twice the ice depth) is 1155 m. Hence, before considering different transmission efficiency into air versus ice,
As described below, we measured T
ratio, the ratio of power the antenna transmitted into ice over that transmitted into air, accounting for an expected small difference due to impedance matching. For electric field measurements, we use ![]() . Applying this correction twice, once for transmission and once for reception, Equation (3) becomes
. Applying this correction twice, once for transmission and once for reception, Equation (3) becomes
where T ratio has a value between 0.8 and 1.2.
Solving for 〈Lα 〉 gives the equation we use to extract the attenuation length:
Note that changes in the transmission into ice versus air, as well as any difference in beam pattern, enter only through a logarithm.
Care should be taken not to confuse average attenuation length, 〈Lα 〉, which is averaged over depth, with Lα . Some authors report Lα for a particular temperature and depth.
For our impulse we used a high-voltage pulser (HYPS, Grant Applied Physics) designed to drive a 50Ω load. The output of the pulser is shown in Figure 1 as measured with a 3 GHz bandwidth oscilloscope. It outputs a −2.5 kV peak with a 0.15 ns fall time. We sent and received the impulses to the antennas via 23 m Heliax LDF4 50Ω cables. On the receiving end an additional 4 m of LMR240UF cable was added. For most data, the signal was amplified by a Miteq low-noise amplifier model AFS3-00200120-10-1P-4-L with a gain of 49–54 dB from the highest to lowest frequencies. The filters discussed below were added after the amplifier and the signals were recorded by a Tektronix TDS684 oscilloscope.
Our main data were taken with quad-ridged horns built and designed by Seavey Engineering Associates with a bandpass of 200–1280 MHz, specifically designed for the Antarctic Impulsive Transient Antenna (ANITA) experiment (ANITA Collaboration, 2010). Full details of the antenna are given by ANITA Collaboration (2009). Typical waveforms transmitted and received through these antennas are shown in Figure 2. The preferential loss at high frequencies in ice is already apparent.
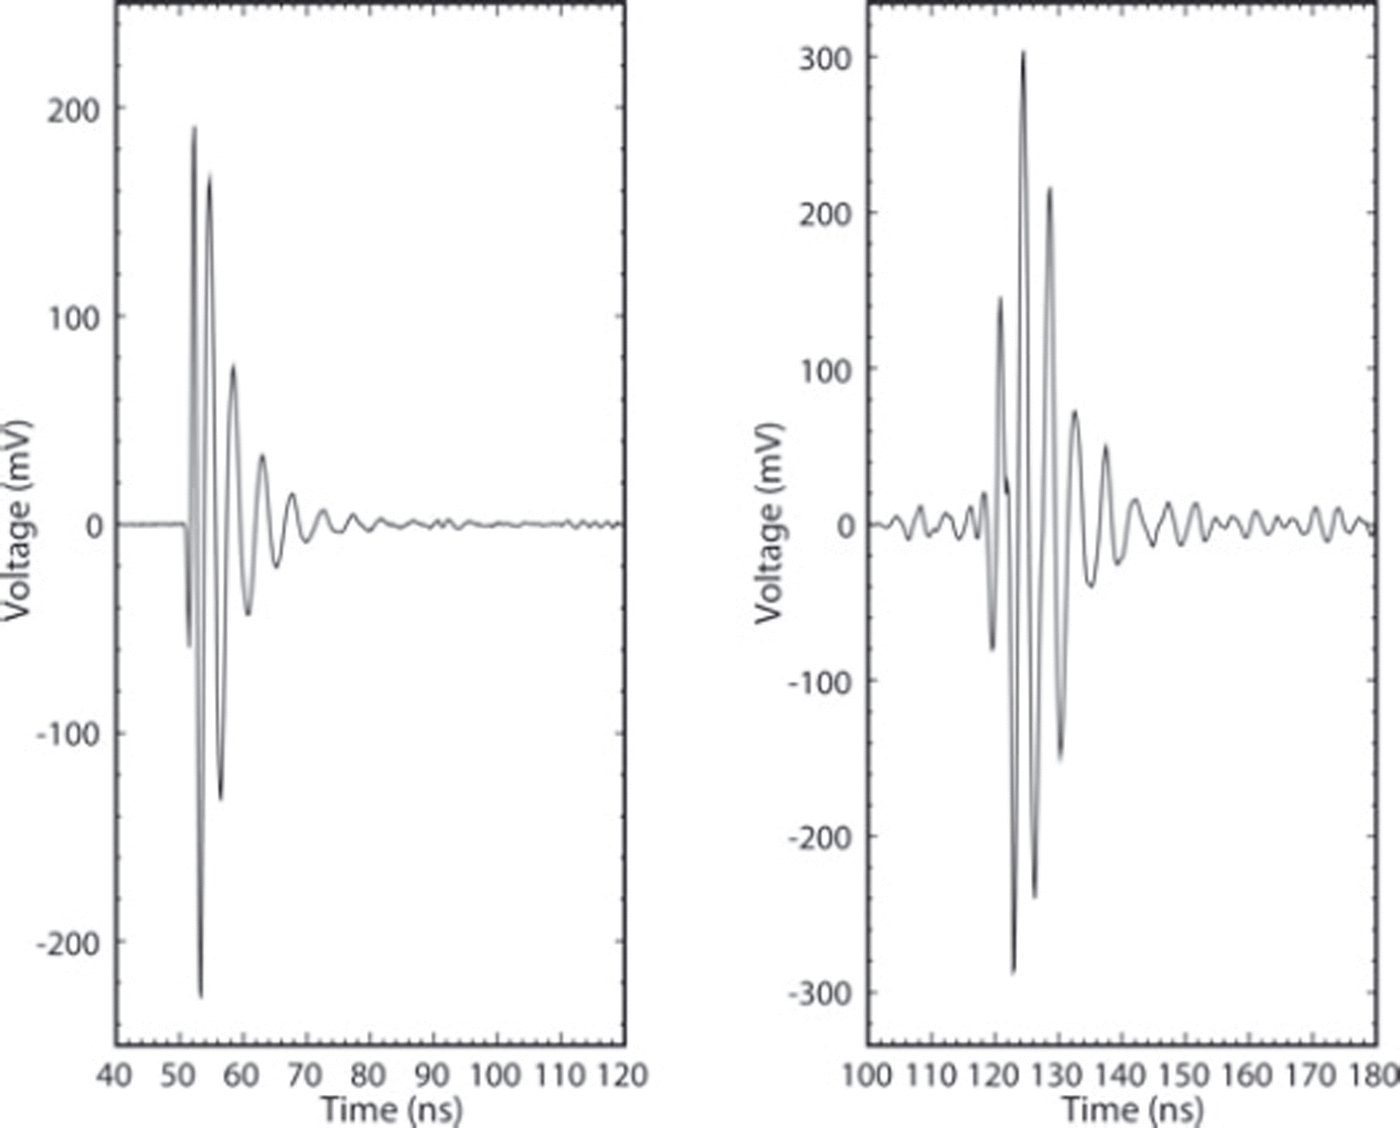
Fig. 2. Typical waveforms as transmitted and recorded by the quad-ridged horns through 9 m of air (left) and 1155 m of ice (right). Both waveforms were recorded without the 900 MHz low-pass filter. Each waveform was attenuated or amplified to be approximately the same scale on the oscilloscope.
The transmission band of the antenna can be determined from the fraction of power sent to the antenna that is reflected back to the pulser, S 11. The S 11 for the antenna pointing into air (as designed) is shown in Figure 3. Since the antenna was not designed for transmission directly into ice, we made S 11 measurements in various configurations facing down: directly on the snow surface, 1 m above the snow surface, and buried 0.5 m below the snow surface. We also compared these with having the antenna face up to the sky. Little difference was found among these, and we show S 11 in Figure 3 for the nominal transmission into ice. For lower frequencies we used Yagi antennas whose S 11 are shown in Figure 4. The critical parameter, however, is the ratio of transmitted power:
where S 11 is measured in dB. The values of T ratio versus frequency are shown for the quad-ridged horn and Yagi antennas in Figure 5. Transmission inefficiencies such as ohmic losses in the antenna cancel in the ratios used.
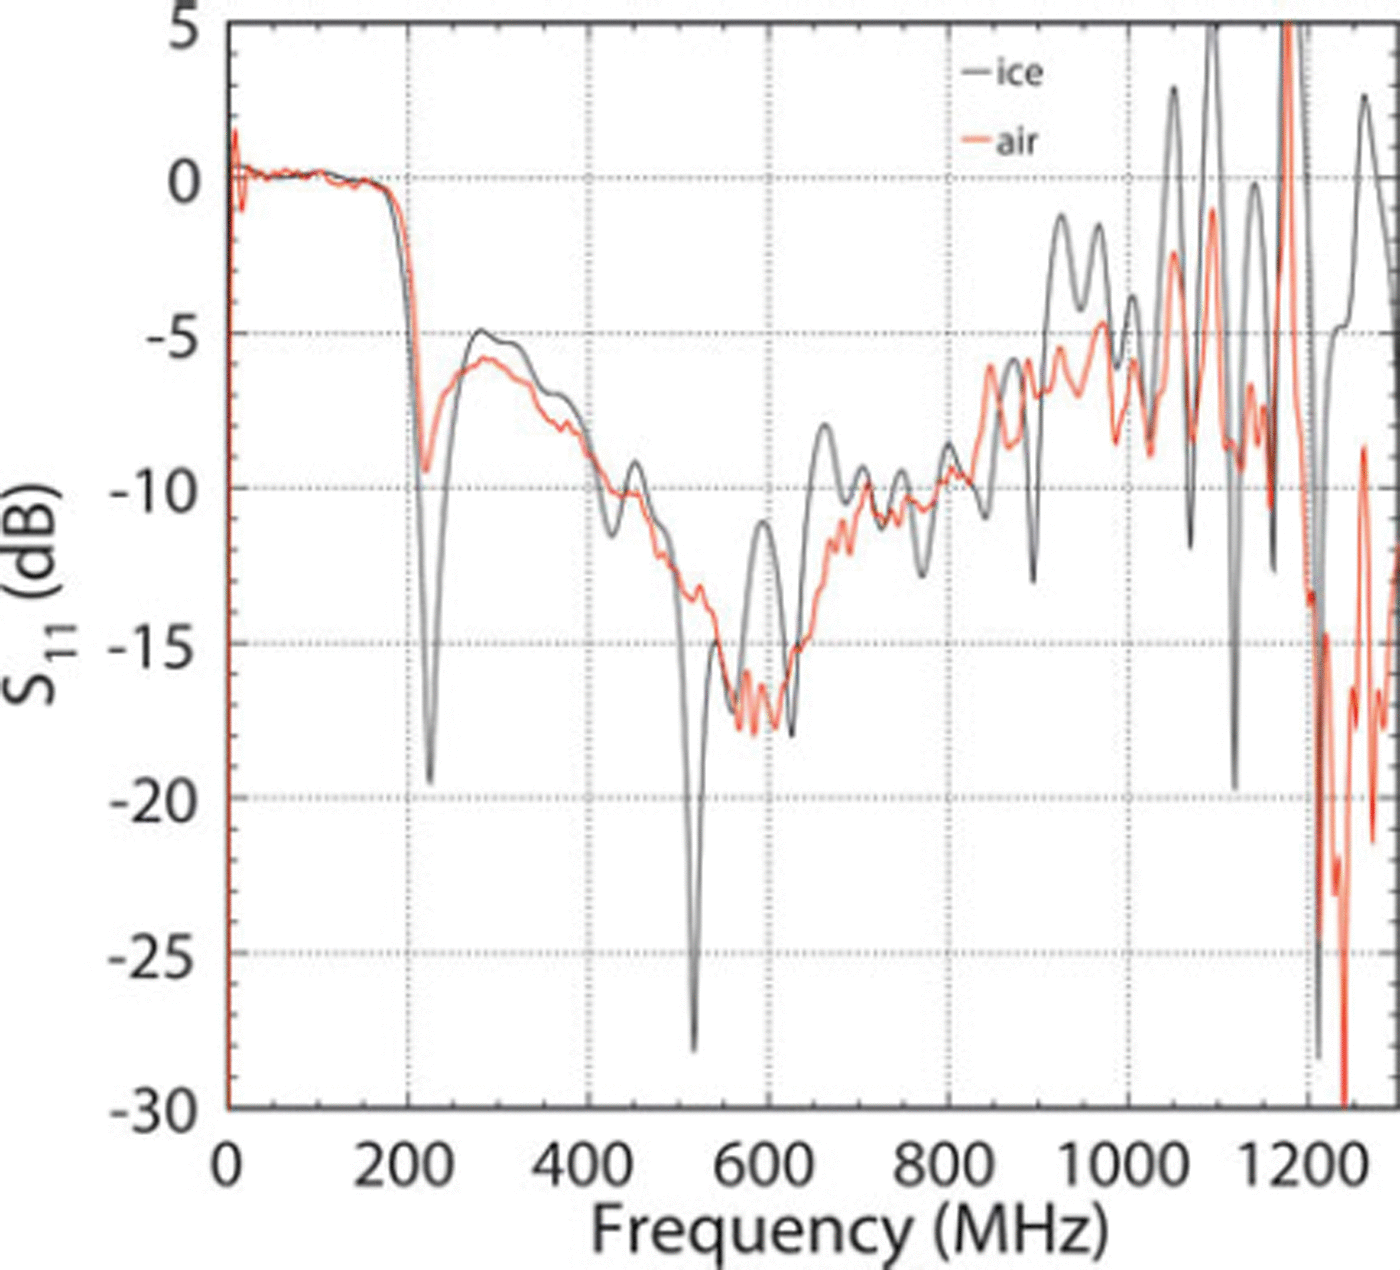
Fig. 3. Fraction of incident power reflected back from the quad-ridged horn (relative to an open termination). The low-pass filter began to cut off signal past 900 MHz.
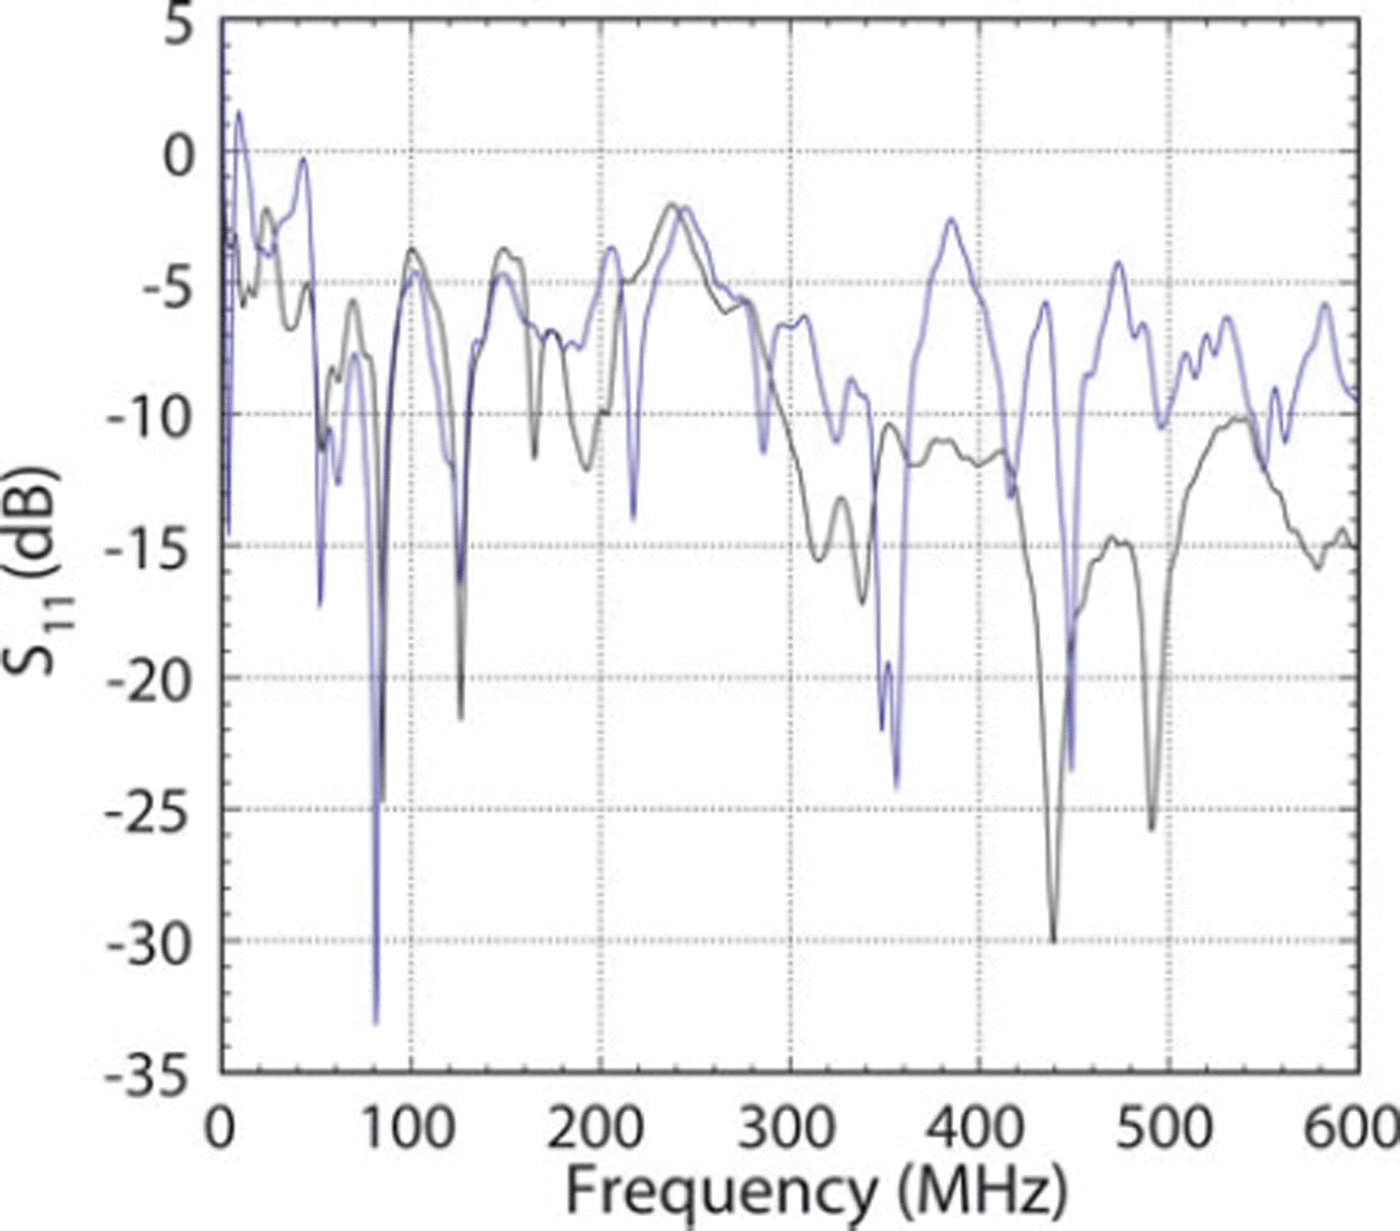
Fig. 4. Fraction of incident power reflected back from the Yagi antennas (relative to an open termination) while in the snow. The two curves are for the two different antennas.
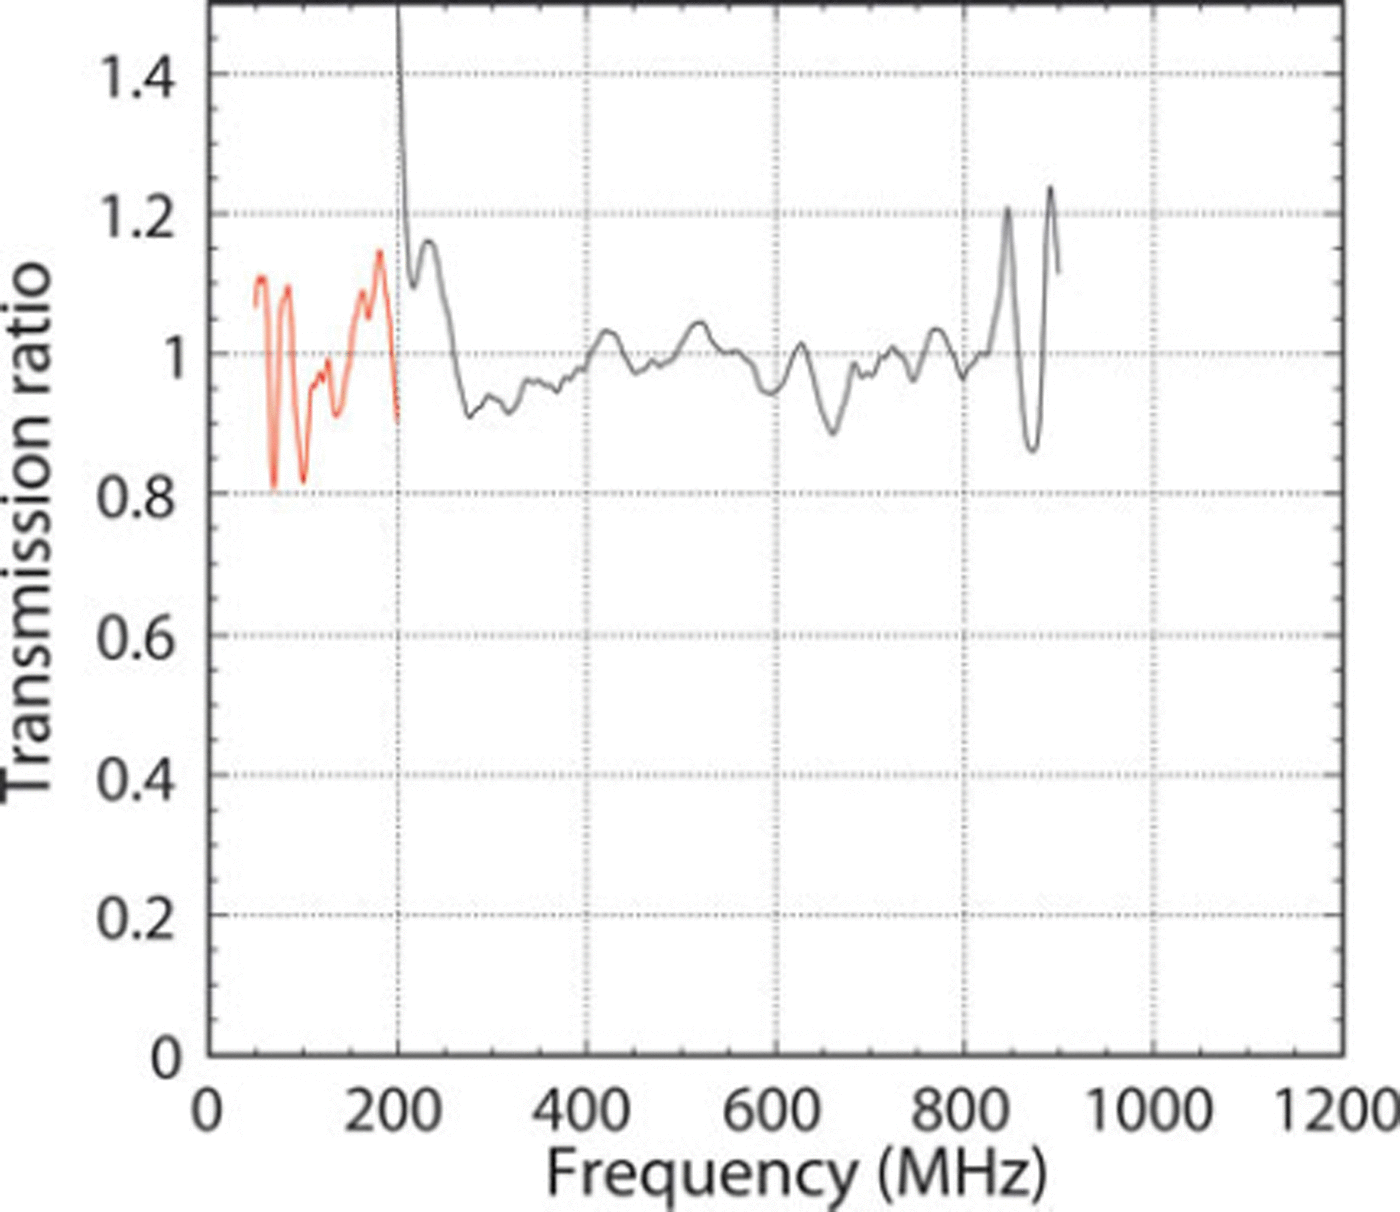
Fig. 5. T ratio for the quad-ridged horns (black) and Yagi antennas (red), with a 900 MHz low-pass filter. Beyond 900 MHz, we use 1.0 ± 0.1.
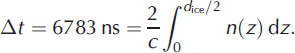
To calculate the distance the radio emissions travel through ice, d ice, we measure the two-way transit time between the transmitted and received pulse and use a model for index of refraction, n, versus depth, z. We measured the total propagation time, Δt = 6783 ns, to a precision of 10 ns. We follow Reference Dowdeswell and EvansDowdeswell and Evans (2004) in modeling the ice as two regions: a slab of bulk ice with constant n, surmounted by a firn layer with varying n(z). For consistency with our previous work we take the bulk as n = 1.78 ± 0.03, where the uncertainty comes from the range of values summarized by Reference Bogorodsky, Bentley and GudmandsenBogorodsky and others (1985).
We use the Schytt model (Reference SchyttSchytt, 1958) of the firn layer’s index of refraction, n, versus density, ρ:
where ρ(z) is the specific gravity we measured using core samples on the Ross Ice Shelf (Williams Field):
In the model, the index of refraction of the firn matches the deep ice at z = 67 m, consistent with the results of Reference Dowdeswell and EvansDowdeswell and Evans (2004, fig. 2), beyond which we take n(z) = 1.78. The value of d ice can then be found by integrating over the depth:
Even extreme variations in the firn layer model (e.g. linear versus depth) are negligible (<5 m). The dominant uncertainty comes from the choice of n for the bulk ice (±0.03), based on the distribution of values from Reference Bogorodsky, Bentley and GudmandsenBogorodsky and others (1985). For our site we measure d ice = 1155 ± 20 m. This corresponds to an ice depth of 577.5 ± 10 m, agreeing with a measurement of 572 ± 6 m made by another team with a different method ∼1 km away (Reference GerhardtGerhardt and others, 2010). Their smaller uncertainty corresponds to a smaller uncertainty used on the index of refraction.
We derive 〈Lα 〉 from the data using Equation (5). The value of Vν includes the power received in the co- and cross-polarizations relative to the transmitted signal. When plotting the data, we binned the data points with intervals of 25 MHz, averaging Pv , ice and Pv , air over the width of the bin. The variation within 25 MHz was small, but the standard deviation divided by the square root of the number of bin elements is included in the error bars. To calculate 〈Lα 〉, we averaged T ratio over the width of the bin, although its variation across the bin is negligible.
The final results are shown in Figure 6. The red data are from the Yagi over its frequency band, which was indicated by a repeatable and small S 11. The blue data are from the quad-ridged horns with a low-pass filter at 900 MHz (Minicircuits NLP-1000). The black curve shows a continuation of data taken to higher frequencies without the filter up to 1250 MHz. We discuss systematic uncertainties and several issues with the data below.
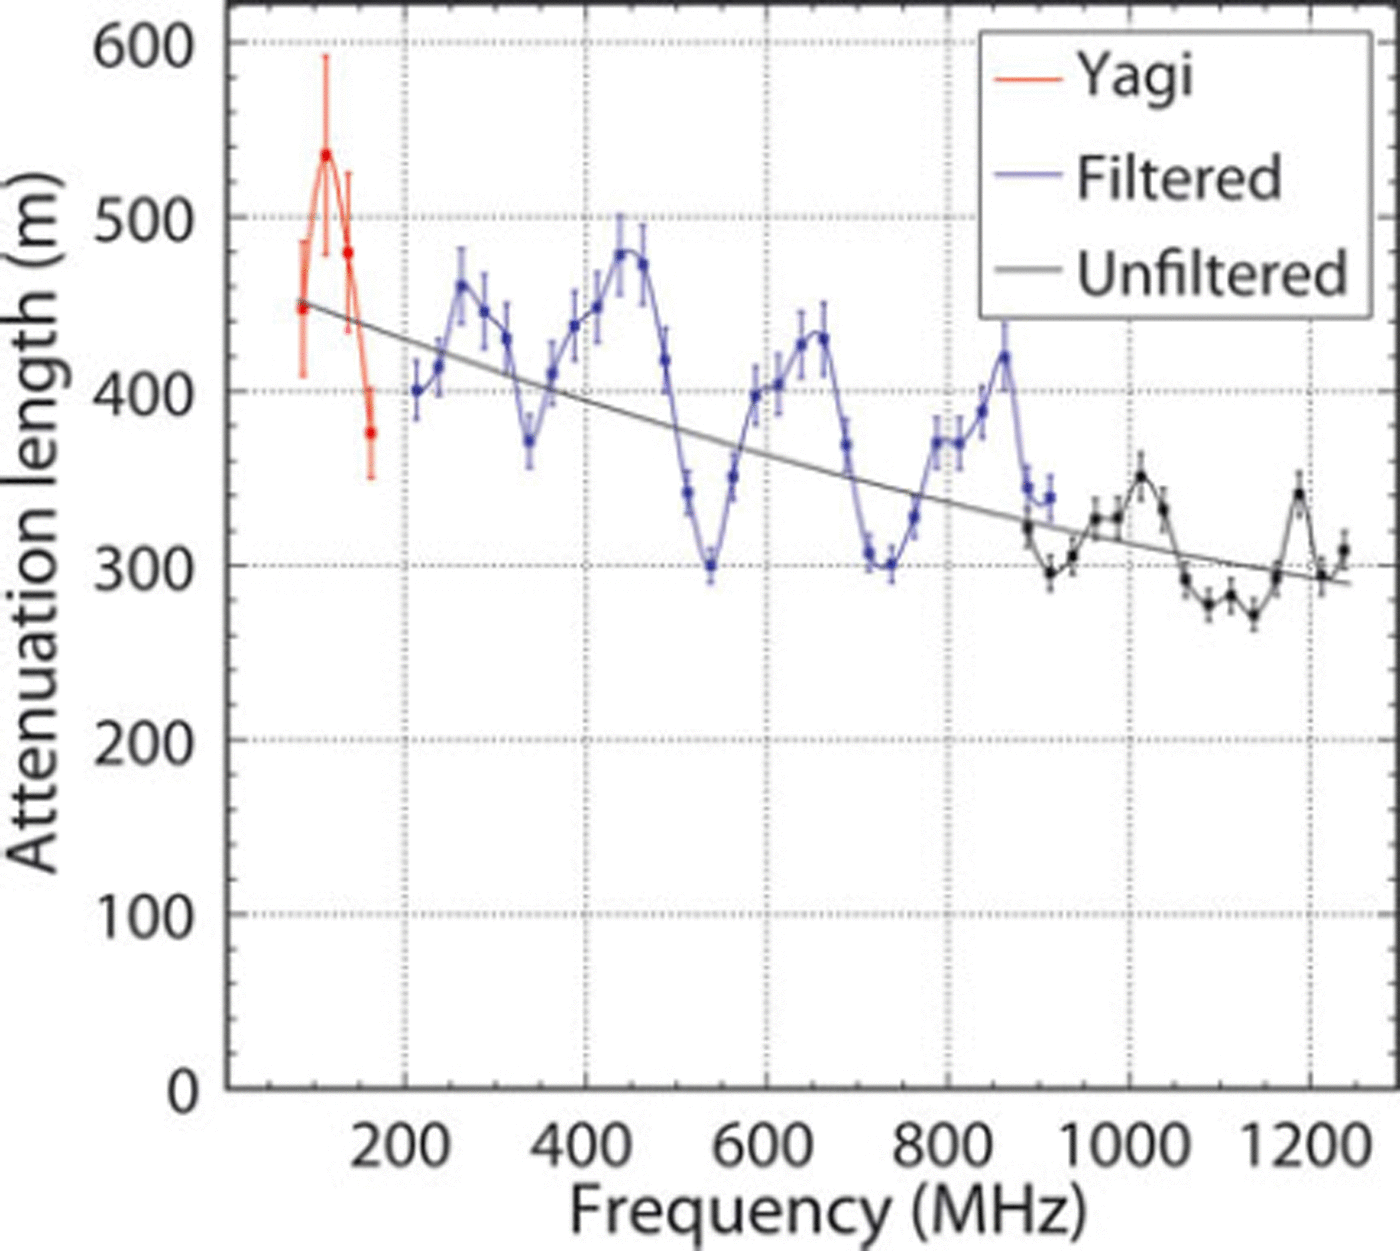
Fig. 6. Calculated average attenuation length, 〈Lα 〉, as a function of frequency. The red line corresponds to data taken with the Yagi antennas, and the blue and black lines correspond to quad-ridged horn data taken with and without a low-pass 900 MHz filter. The modulation versus frequency is probably an artifact.
In principle the Yagi data should have also given results up to 600 MHz, where we still saw returned power. The T ratio value looked stable to within 20% for these data. However, the S 11 in ice indicated that up to half the power could be reflected and we determined the Yagi data to be unreliable above 200 MHz. Analyzing these data yielded attenuation lengths between 200 and 600 MHz ∼75 m shorter than the nominal quad-ridged horn data.
At some frequencies we measured a significant amount of power arriving in the cross-polarization relative to the transmitted signal. As shown in Figure 7, this fraction had a peak at ∼45% at 450 MHz, which was only seen in ice data, not air. This effect could be due either to a rotation of polarization in transit through the ice or due to local resonant interaction of the antenna with the ice. In either case, keeping the received power in the calculation is correct, given the definition of 〈Lα 〉. We are sure the signal traveled through the full depth of ice because of its arrival time. No significant delay between the two polarizations was apparent. The position and magnitude of the peak in Figure 7 did not depend on the orientation of the antennas relative to the ice.
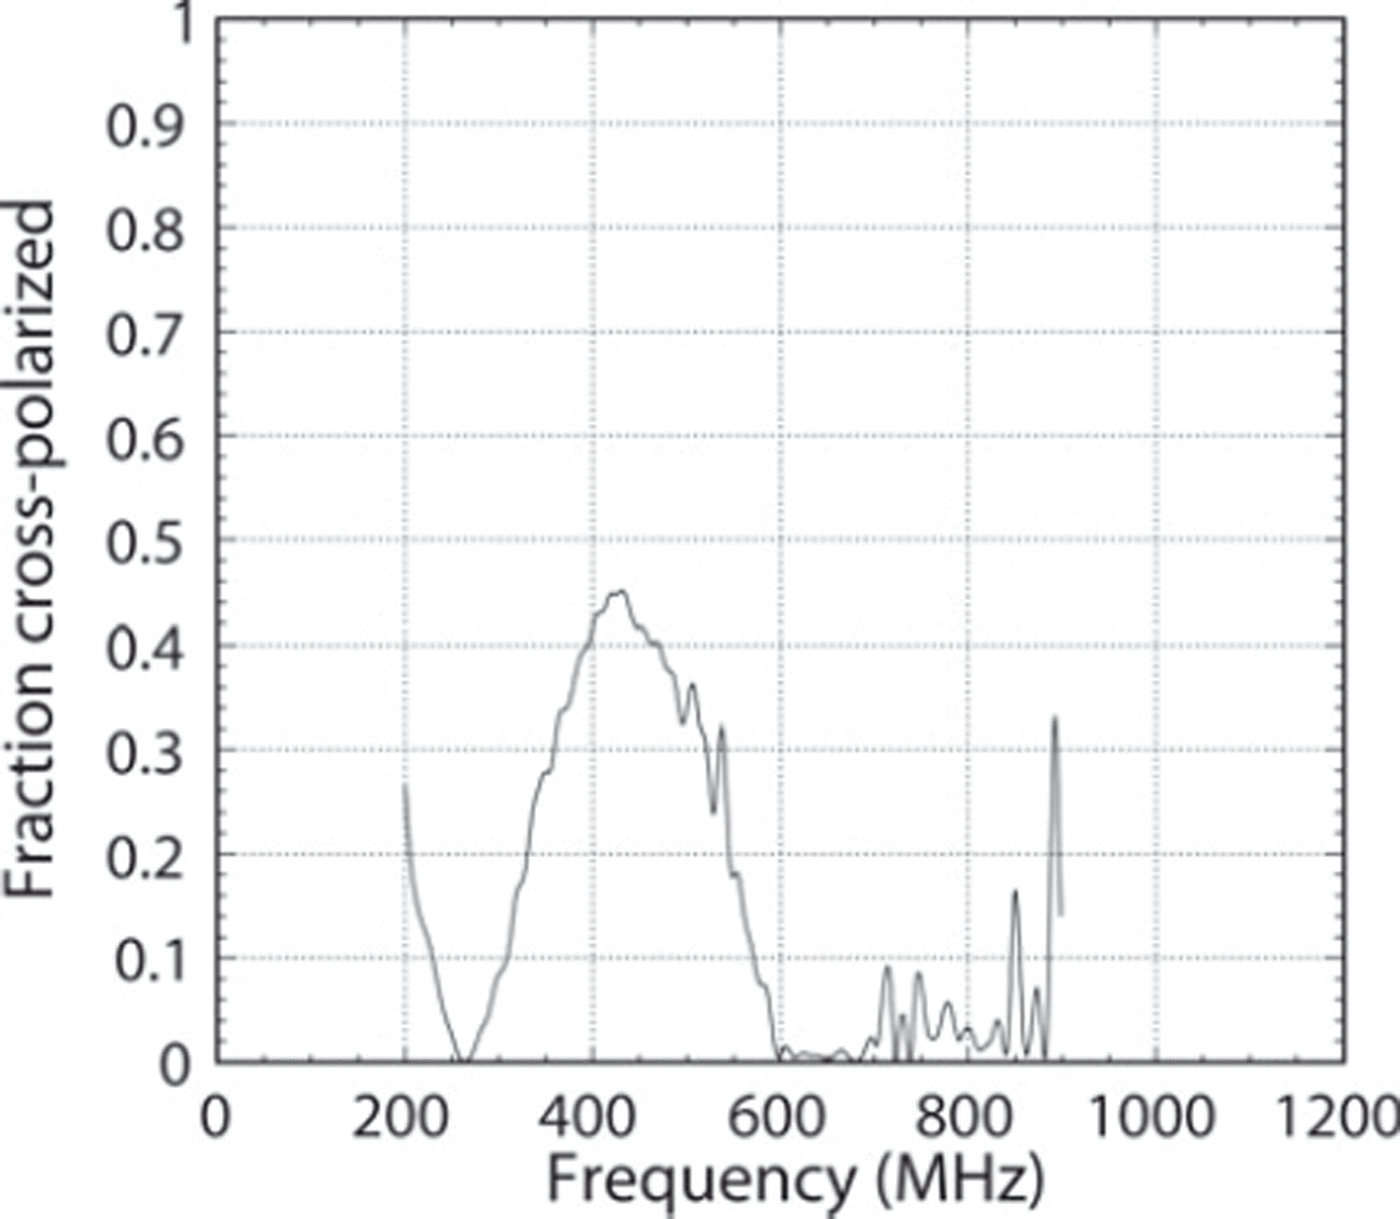
Fig. 7. Fraction of the received signal power that was cross-polarized. These data were taken by rotating the receiver by 90° after taking the unfiltered, co-polarized quad-ridged horn data.
Because of the functional form of Equation (5), the main known source of systematic error comes from uncertainty in d ice, 20 m out of 1155 m, arising mostly from the uncertainty of n in the ice. Other sources of error include a 10% uncertainty in T ratio and the variation of power within each 25 MHz bin.
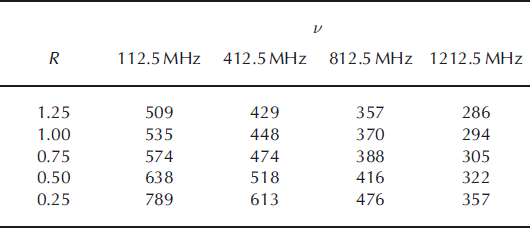
Our assumption of perfect reflectivity, i.e. reflection coefficient R = 1.0, is conservative in that any lower value would yield longer attenuation lengths in the analysis. That is, we would detect more neutrino events. At our site, the reflectivity is high (Reference NealNeal, 1979), no worse than R = 0.25 and likely much higher. For completeness we show the effect of different assumed values for R in Table 1. Because of the square root and logarithm in Equation (2), the variation is modest. Reference NealNeal (1979) calculates a theoretical reflection loss at the sea-water/glacial-ice boundary of −0.77 dB (−0.8 dB if frozen sea ice is present), which corresponds to R = 0.83. Had we used that value, the effect on our answers would have been longer by typically a few percent and never more than 10%.
Table 1. Variation of the average extracted attenuation length (m), 〈Lα 〉, as the assumed power reflection coefficient, R, is varied from its nominal value of 1.0. Note that 〈Lα 〉 only increases for R smaller than the nominal value.
An additional uncertainty, probably dominant, is apparent in Figure 6 as a modulation versus frequency of about 183 MHz. Tests in the field showed that this modulation depended on the local interaction of the antenna with the surrounding dielectric snow. The modulation frequency depended on the depth at which the antenna was buried or how far above the ice it was tested. It also depended on whether the horn was filled with snow or just air. However, the modulation could not be reduced. Another possibility is that the modulation was due to birefringence, by superposing two signals arriving at slightly different times due to different propagation speeds along the crystal axes. A modulation as observed is consistent with a 0.1% difference in wave speeds due to birefringence, as has been observed at South Pole (Reference Matsuoka, Wilen, Raymond and HurleyMatsuoka and others, 2009; D. Besson and others, http://arxiv.org/abs/1005.4589). Such an effect could also be mimicked by partial reflection at or within intermediate layers or near the bottom. If due to a single layer in the bulk ice, the 183 MHz would correspond to a thickness of 0.46 m. Unfortunately, we did not take enough data at different angles to confirm or rule out these effects. Rather than smoothing out the data, we present the results at each frequency bin and assign an uncertainty of ∼55 m at low frequencies and ∼15 m at high frequencies. A three-parameter fit is given below that effectively averages out these variations.
3. Summary
We have transmitted and received high-voltage impulses from directional horn antennas through the Ross Ice Shelf to the sea water below and back. We have demonstrated that the reflection at the ice–sea interface is consistent with an excellent mirror at these frequencies. In addition, we have extracted the average attenuation length over a range of VHF and UHF frequencies (75–1250 MHz) and found it to range from 500 to 300 m, with an uncertainty of order the root mean square of the variation, or 55–15 m over this range. Since the variations are small, if we assume they are an artifact, our electric-field attenuation length (m) can be summarized with a parameterization over the range 75–1250 MHz as
where v is in MHz. The use of a quadratic fit is for convenience and not motivated by a particular physical model. The fit values, with uncertainties, on the terms in Equation (10) are 469 ± 13, −0.205 ± 0.036 and (4.87 ± 2.34) × 10−5. Although the data are not expected to be described by a constant loss tangent, tan δ, the attenuation length is nearly linear with frequency. Naively, the data in this range can be summarized by tan δ ∼ 0.0003, corresponding to a Q-factor, Q ≡ 1/tan δ ∼ 3300. Few direct measurements of the attenuation length have been made over these frequencies, and our results can be used to constrain modeling based on impurities and temperature.
Our measurements were systematically limited by our understanding of birefringence and interaction of the antennas with the ice. Based on our experience, we recommend future measurements should take data at numerous angles with respect to the ice fabric. For example, see data taken at Upstream B camp, Antarctica (Reference Liu, Bentley and LordLiu and others, 1994), results which warn that the crystal fabric can change orientation on scales of 100 m. Care should also be taken in antenna design or simulation to understand the interaction with the dielectric medium. The impulses were strong enough that reflected signals from intermediate layers were visible, so a mapping of birefringence versus depth should be possible if many angles are taken.
These attenuation lengths are long enough, comparable to the depth, that neutrino detectors proposed for this region of the Ross Ice Shelf appear viable. In addition, balloon flights that have observed this region are also sensitive to neutrino interactions. The coherence of the pulse is well maintained, with no distortion beyond that due to the attenuation. The lengths are conservative in that if the mirror at the ice–sea interface is not perfect, the actual attenuation lengths will be longer.
Acknowledgements
We are indebted for the logistical support provided by Raytheon Polar Services and the US National Science Foundation (NSF), and particularly to K. Emery for field support. This material is based upon work supported by the NSF’s Office of Polar Programs and the US Department of Energy’s Office of Science.


