


1. Introduction
The Roer Valley Rift System (RVRS) is part of the Lower Rhine Embayment and is located in the Netherlands, Belgium and Germany. The RVRS consists of a primarily northwest–southeast (NW–SE) oriented series of active fault zones such as the Peel Boundary, Tegelen, Venlo, Feldbiss, Gilze-Rijen, Rurrand and Erft Fault zones (Fig. 1A). As a result of vertical displacement, stratigraphic units with contrasting permeabilities have become juxtaposed. The juxtaposition, combined with tectonic mixing of sediments with contrasting grain-size, smearing of low-permeability clay, rotation of platy sediment grains perpendicular to the predominant groundwater flow direction (Bense et al., Reference Bense, Gleeson, Loveless, Bour and Scibek2013) and precipitation of iron (hydr)oxides (Bense et al., Reference Bense, Van den Berg and Van Balen2003), causes the fault zones in the RVRS in general to act as barriers to horizontal groundwater flow, forcing groundwater to flow in a vertical direction parallel to the fault zones (Visser, Reference Visser1948; Bense et al., Reference Bense, Van den Berg and Van Balen2003; Bense & Van Balen, Reference Bense and Van Balen2004; Bense & Person, Reference Bense and Person2006; Bonte et al., Reference Bonte, Geris, Post, Bense, Van Dijk, Kooi, Ribeiro, Stigter, Chambel, Condesso de Melo, Monteiro and Medeiros2013; Gumm et al., Reference Gumm, Bense, Dennis, Hiscock, Cremer and Simon2016).
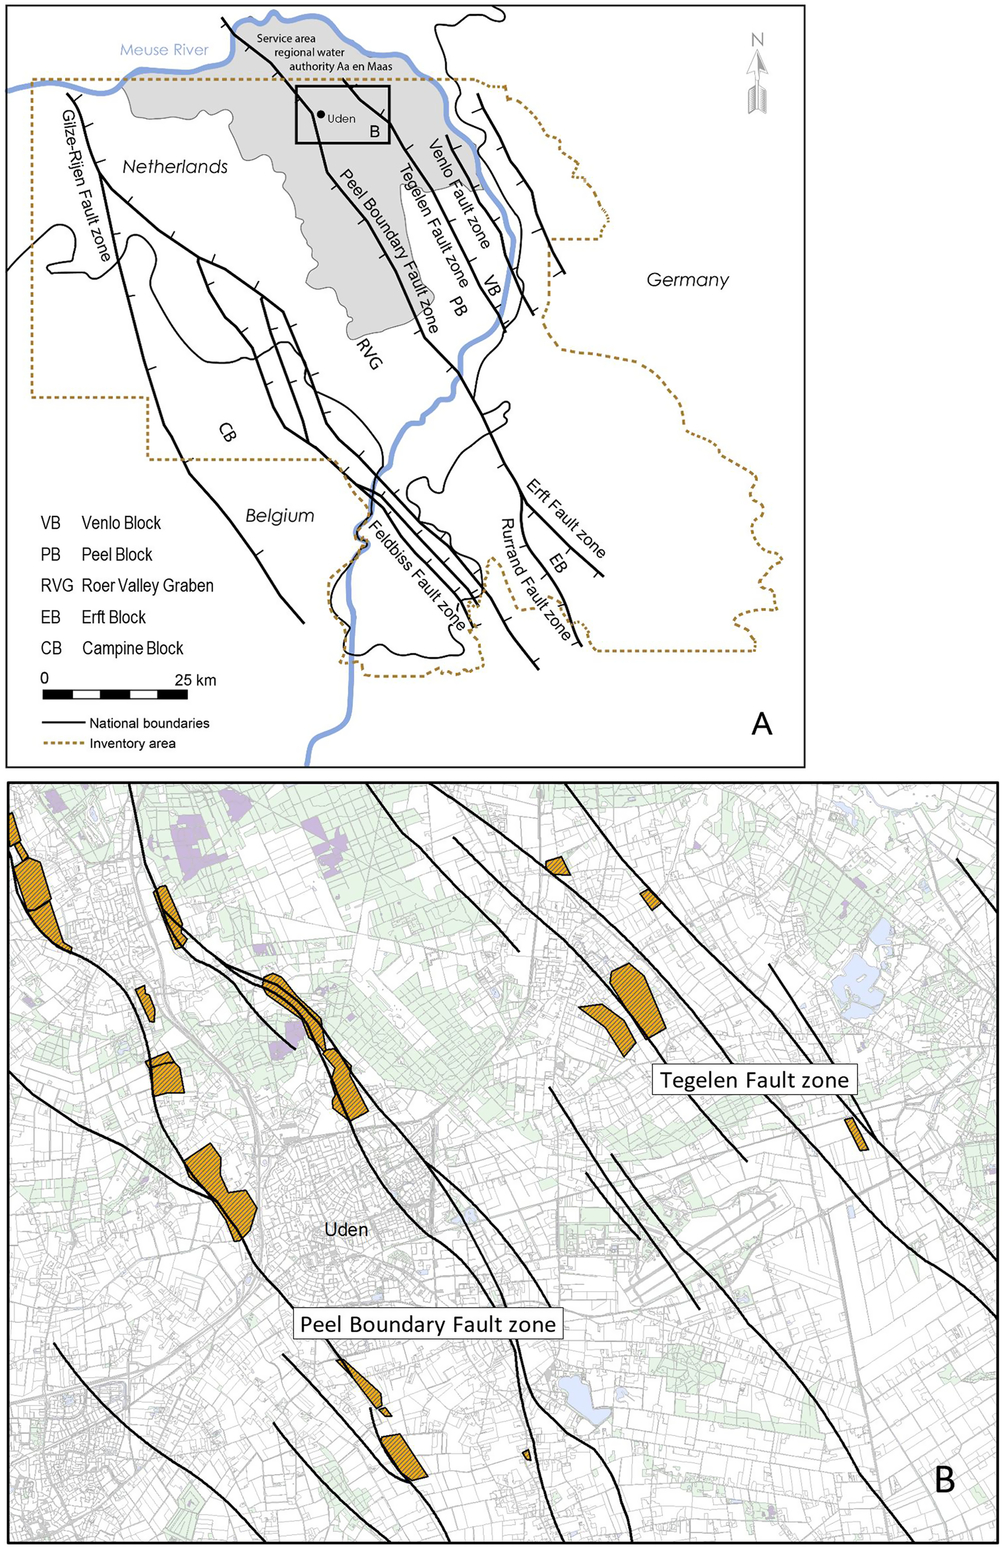
Fig. 1. (A) Schematic representation of the Roer Valley Rift System modified after Houtgast (Reference Houtgast2003), service area of regional water authority Aa en Maas and (B) fault-related and orange-coloured wet areas with iron-rich seepage (locally called wijstgronden) predominantly situated on the foot wall of the different faults of the Peel Boundary and Tegelen Fault zones near the village of Uden (Bonte & Witjes, Reference Bonte and Witjes Th.2007).
The gradient in hydraulic head across a fault in the shallow groundwater system (Fig. 2B) can be steep (Ernst & De Ridder, Reference Ernst and De Ridder1960). On the hanging walls (subsiding block) of the fault zones, relatively deep groundwater levels prevail. On the foot walls (uplifting block), groundwater is forced to seep out, causing permanent wet areas (Fig. 1B) with (very) shallow water levels or levels that even reach the surface. The resulting fault-related wet areas (Fig. 2A) with iron-rich groundwater seepage (locally called wijstgronden) have a specific flora and fauna (Ettema, Reference Ettema2010). The wet areas result in cropmarks on aerial photographs, which can be combined with elevation information to map the faults. A field reconnaissance study by regional water authority Aa en Maas (Bonte & Witjes, Reference Bonte and Witjes Th.2007) also used iron oxidation (Fig. 3) as an important indicator for the potential presence of wet areas situated on the foot walls of fault zones. Within the service area of this water authority, a total of 40 fault-related wet areas were identified, with a cluster around the village of Uden (Fig. 1B). Near this village, both surface water and groundwater contain concentrations of dissolved total iron up to 380 mg L−1 (AGROLAB Group, 2017). Locally this has caused the formation of iron-cemented sand layers. The extent of the wet areas used to be larger in the past. In fact, most of the wet areas have been made suitable for agriculture by deep ploughing and drainage. Nowadays, restoration of some of these wijstgronden has become an important goal for the local authorities, which possibly requires bringing back the fault’s sealing capacity.
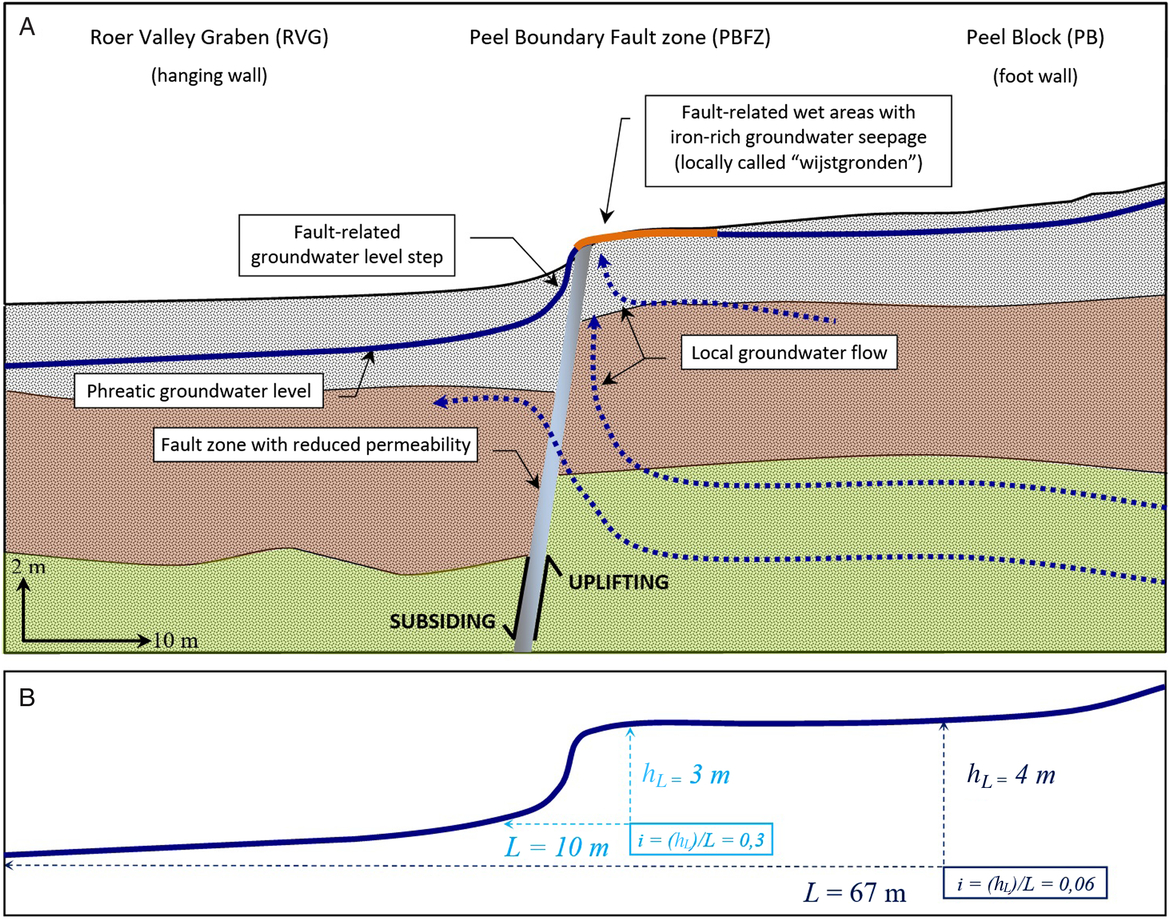
Fig. 2. (A) Schematic cross section of the Peel Boundary Fault zone (PBFZ) and its effect of reduced permeability on local groundwater flow and location of fault-related wet areas (locally called wijstgronden) and (B) cross-fault hydraulic gradient (i) as a function of head loss (h L) and distance between measurement locations (L).
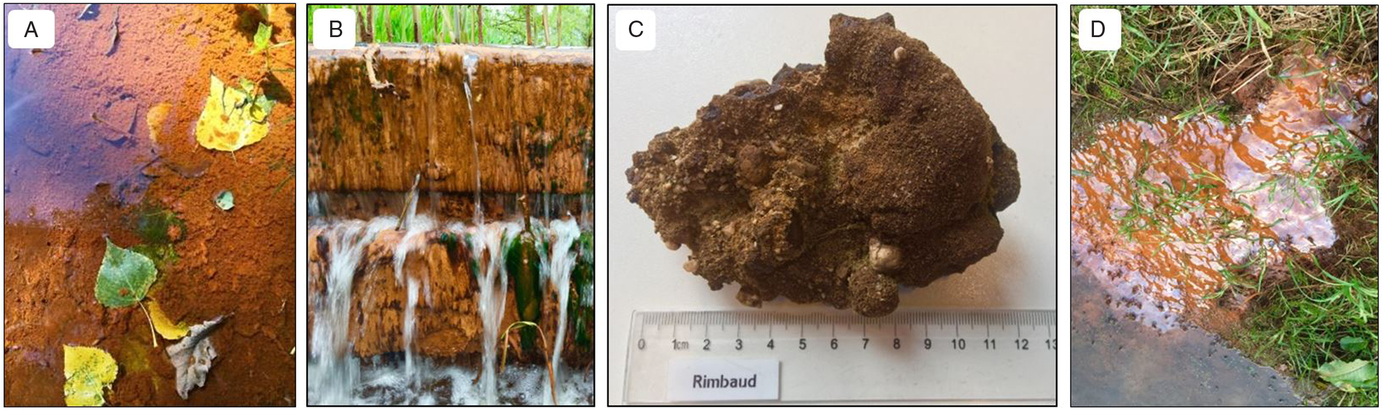
Fig. 3. Iron oxidation in fault-related wet areas (locally called wijstgronden): (A) precipitation of iron on the bottom of a small watercourse, (B) an iron overgrown weir, (C) 12 cm piece of iron-cemented sand and (D) iron sludge flowing from drainage pipes.
Visser (Reference Visser1948) was the first to study the interaction between groundwater flow direction, geological structure and high groundwater levels on the foot wall of the Peel Boundary Fault zone (PBFZ). He concluded that ‘a rapidly falling water table’ and existence of ‘sandy material of insufficient permeability’ was occurring at the fault zone. The reduced horizontal groundwater flow in coarse-grained gravelly sands due to faulting was first quantified by Ernst & De Ridder (Reference Ernst and De Ridder1960) in a study area near Wanssum (Venlo Fault zone, Fig. 1A). Almost half a century later, the relation between deformation mechanisms and hydraulic properties of fault zones in unconsolidated sediments in the RVRS was studied in detail by Bense et al. (Reference Bense, Van den Berg and Van Balen2003) for the Feldbiss Fault zone. They used digital-image-analysis techniques to estimate the spatial distribution of hydraulic conductivity properties at a small scale (mm). In addition, laboratory measurements were carried out on core samples (cm-scale) to establish the larger-scale distribution of permeability in the fault-damage zone.
Despite the previous studies, an overview of the distribution and magnitudes of groundwater level steps and multi-directional fault permeabilities is still lacking. Such an overview is required to infer the fault and topographic controls, which are in turn needed to develop new concepts for designing regional groundwater models and to improve nature restoration policy. This paper presents the first inventory, mostly in shallow groundwater systems, based on data in the RVRS from 1948 until the present. The overview is based on a literature review, hydrogeological results from trench sites (Houtgast, Reference Houtgast2003; Bense, Reference Bense2004), findings from Dutch and German water authorities, calibrated and validated groundwater models and new fieldwork data. We use the inventory (database) to compare different fault zones, to identify control mechanisms that influence cross-fault hydraulic heads and to address future research topics such as the need to incorporate heterogeneity in future groundwater modelling. Finally, we discuss the implications of our findings for nature restoration projects.
2. Geological and morphological setting
The RVRS is an active rift system (Van Balen et al., Reference Van Balen, Houtgast and Cloetingh2005, Reference Van Balen, Bakker, Kasse, Wallinga and Woolderink2019) situated in the southeastern part of the Netherlands and adjoining areas in Belgium and Germany (Fig. 1A). The RVRS is situated in the northwestern part of the European Cenozoic Rift System (Michon et al., Reference Michon, Van Balen, Merle and Pagnier2003). The current extension phase in the RVRS started at the Oligocene–Miocene transition (Michon et al., Reference Michon, Van Balen, Merle and Pagnier2003; Michon & Van Balen, Reference Michon and Van Balen2005; Van Balen et al., Reference Van Balen, Houtgast and Cloetingh2005). The RVRS (Fig. 1A) is composed of the Campine Block in the southwest, the Roer Valley Graben (RVG) in the centre, the Peel and Venlo Blocks in the northeast and the Erft Block in the southeast. The graben is separated from the Campine Block by the Feldbiss Fault zone and from the Peel Block by the PBFZ.
During the Quaternary the average subsidence rate of the tectonic blocks in the RVRS was variable (Houtgast & Van Balen, Reference Houtgast and Van Balen2000). The RVG subsided considerably faster (88 mm ka−1), than the neighbouring Campine Block (27 mm ka−1) and Peel Block (46 mm ka−1). During the Miocene and Pliocene, sedimentation of shallow marine deposits prevailed in the northern (Dutch) part of the RVRS. In the southeastern (German) part of the RVRS, up to 100-m-thick brown coal or lignite deposits were formed. During the Pleistocene, Rhine and Meuse fluvial systems and smaller rivers, sourced from the uplifting and eroding hinterlands, started to fill the RVRS (Schokker et al., Reference Schokker, Cleveringa, Murray, Wallinga and Westerhoff2005; Westerhoff et al., Reference Westerhoff, Kemna and Boenigk2008). After the Rhine abandoned the RVG during the early Middle Pleistocene, coarse-grained fluvial sediments were deposited by the Meuse in the RVG. From the late Middle Pleistocene onwards, the Meuse also abandoned the graben and deposited on the Peel and Venlo Blocks. In the RVG, mostly fine-grained, local fluvial, lacustrine and aeolian sands accumulated (Schokker et al., Reference Schokker, Cleveringa, Murray, Wallinga and Westerhoff2005). These deposits reach their maximum thickness of approximately 35 m in the northern part of the graben. On the Campine Block and Peel Block the Middle Pleistocene coarse-grained Rhine and Meuse fluvial deposits are found close to the surface (Schokker et al., Reference Schokker, Cleveringa, Murray, Wallinga and Westerhoff2005) due to limited subsidence and periglacial erosion.
A digital elevation model (AHN2, 2018; Land NRW, 2018) showing the elevation pattern of tectonic blocks and fault scarps is depicted in Fig. 4. The primarily NW–SE orientation of the fault scarps of the Peel Boundary and Feldbiss Fault zones can be followed over long distances. The height differences across individual fault scarps vary from approximately 1 to 10 m.

Fig. 4. Digital elevation model (DEM) of the Roer Valley Rift System based on AHN2 (2018) with fault pattern (Land NRW, 2018) and the lower-situated Roer Valley Graben (RVG) bounded by higher blocks. Colours range from light blue (1 to 10 m above mean sea level) to brown-white (>120 m above mean sea level). For abbreviations see Fig. 1A.
3. Methods
A four-step approach was applied to systematically summarize available data on fault-related hydraulic head differences and fault zone permeabilities in the RVRS (Fig. 5) and to present their spatial distribution using a geographical information system (GIS).

Fig. 5. Schematic representation of the four-step review strategy.
The first step was to collect data from various sources of information, such as published articles, theses, earlier trench studies, field data, new fieldwork, internal reports, monitoring arrays, pumping tests, the Dutch national geological database DINOloket (www.dinoloket.nl) and groundwater models. A total of 39 sources of information were found, containing well-documented and relevant data on cross-fault hydraulic head differences and/or hydraulic conductivity values. Data collection was geographically focused on, but not limited to, the Dutch part of the RVRS. The extent of the inventory area (Fig. 1A) has been aligned with the coverage of the reviewed groundwater models (Fig. 6).
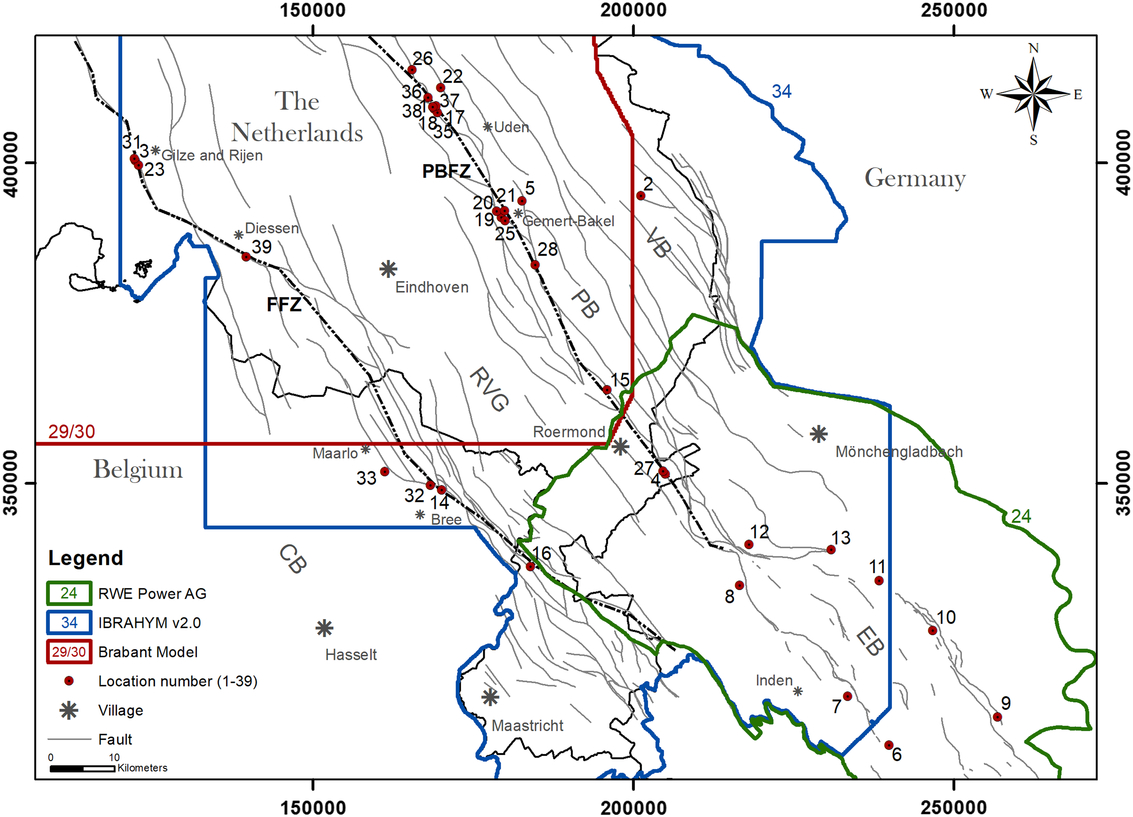
Fig. 6. Location of the 39 sources of information (1–39) including the three groundwater models (24, 34 and 29/30) and their model boundaries (corresponding with the inventory boundary in Fig. 1A) regarding hydraulic head differences and permeabilities of fault zones during the 1948–2018 period.
In the second step, data clustering and processing took place. Each of the reviewed sources of information was assigned to one of five categories: (1) publication, (2) fieldwork, (3) internal report, (4) groundwater model and (5) database. Published (inter)national articles and theses, for example on earlier trench research, have been merged into the category ‘publication’. Various forms of fieldwork, such as inventories made by the local water authorities, monitoring results from piezometer arrays, field research for the construction of underground infrastructure, and recent (2017–2018) fieldwork for this inventory are all summarized in the category ‘fieldwork’. Some institutes and companies have conducted and reported fault zone research, but these results were published internally only. These sources of information, for example from drinking water companies, have been added to the category ‘internal report’. Three partially overlapping groundwater models that jointly cover the inventory area in the Netherlands, Belgium and Germany were reviewed. The groundwater models were built by a drinking water company, regional water authority and mining company and are primarily applied to calculate regional groundwater flow. These regional models have in common that they are currently used and constantly improved. However, they differ in how they simulate cross-fault hydraulic head differences by applying fault zone permeabilities. Relevant groundwater levels from the national Dutch database DINOloket were grouped in the category ‘database’. Multiple reviewed sources could be placed in more than one category. For those cases, the most obvious (dominant) category was selected. For example, extensive fieldwork in a trench across the PBFZ described and elaborated on in a thesis was added to the category ‘publications’ (and not to ‘fieldwork’).
In addition to the classification process, for each source of information the corresponding fault zone was identified and the level of data accuracy estimated. This was necessary because some sources gave a descriptive classification, such as ‘exceptionally steep gradients in the groundwater table were encountered’ (Ernst & De Ridder, Reference Ernst and De Ridder1960), while other sources were based on numerous accurate measurements from piezometers and presented more detailed information. For example, for location 22 (Fig. 6), monitored by regional water authority Aa en Maas, an average hydraulic head difference of 1.7 m could be calculated that was based on more than 65,000 measurements in seven piezometers during the time period from 2009 until the present day. Furthermore, the cross-fault hydraulic head difference varies at a given time with measuring distance across the fault zone, where an increasing measuring distance leads to a somewhat larger hydraulic head difference (Fig. 2B). These differences at a local scale were not further studied, because the exact cross-fault measuring distance was often not available and because this overview represents a regional scale. In this paper the term ‘permeability’ is used in a general sense to refer to the capacity of the subsurface to allow groundwater to pass through. When permeability is quantified we use ‘hydraulic conductivity’ or ‘hydraulic resistance’. We present hydraulic conductivity in m d−1, because the vast majority of the reviewed information sources used this unit and only very few sources used different units (e.g. cm s−1). Hydraulic resistance is expressed in days (d) and obtained by dividing fault thickness (m) by fault hydraulic conductivity (m d−1).
At the third step a database was built based on the five review categories. The oldest reviewed source dates back to 1948 (Visser) and the most recent source dates from 2018 (Deckers et al., Reference Deckers, Van Noten, Schiltz, Lecocq and Vanneste2018). Next, all sources of information were given a unique location number (1–39), compiled into a GIS and plotted on a map. The metadata of the 39 sources including additional hydrogeological specifications, measuring method(s) and data precision, for as far as they were available, are presented in a separate table. Amongst other attributes, this table presents information on location (nearby village name, fault zone name, country and coordinates), data type (point, line or area), summarized hydrogeological characteristics, cross-fault hydraulic head differences, permeability values and a short explanation of the available data. This table is downloadable from the DANS data repository (http://dans.knaw.nl). The corresponding link is presented in the Supplementary Material available online at https://doi.org/10.17026/dans-zug-4hcr. Please note that the reviewed groundwater models cover regional or sub-regional areas.
The fourth and final step of the inventory primarily focused on addressing the research objectives as earlier presented in the introduction. In addition, knowledge gaps and implications for future research were identified.
4. Results
The 39 available sources of information primarily consisted of publications (16) and fieldwork (14). Less available were internal reports (4), databases (1) and groundwater models (3). Their spatial distribution is shown in Fig. 6, combined with the boundaries of the studied groundwater models. One of the three reviewed models, the Brabant Model (Verhagen et al., Reference Verhagen, Van der Wal, Moorman, Westerhof, Peerdeman and Van Sijl2014), is presented as two separate sources of information, because it contained specific datasets for the PBFZ (location 29) and for the FFZ (location 30). Fig. 6 shows that the sites are mainly situated along the major faults, but it also shows that they are unevenly distributed over the western and eastern parts of the RVRS. The majority of sources (74%) are located around the PBFZ and clustered around the villages of Uden and Gemert-Bakel. In the State of North Rhine-Westphalia (Germany), six locations provided information on abrupt differences in groundwater level in and around the opencast lignite mining area (Wallbraun, Reference Wallbraun1992) and two locations provided information on hydraulic head differences and permeabilities. This mining area is covered by the German RWE Power AG groundwater model (RWE Power, 2013) and the improved (in 2015) Dutch IBRAHYM v2.0 groundwater model (Vermeulen et al., Reference Vermeulen, Roelofsen and Veldhuizen2015). Far less data are available for the FFZ (26%). Altogether two calibrated groundwater models (Brabant Model and IBRAHYM v2.0) and eight locations, clustered around the villages Gilze, Rijen and Diessen in the Netherlands and the villages Maarlo and Bree in Belgium, provided information on groundwater level steps and permeabilities for this fault zone.
4.1 Fault-related groundwater level steps
For the PBFZ most data sources show fault-related phreatic groundwater level steps that vary from 1.0 to 2.5 m (Fig. 7). Smaller steps of around 0.5 to 0.8 m occur at locations 15 and 21. At location 28, a step of 3.5 m is present. The overall range from 0.5 to 3.5 m largely corresponds with the calibrated values from the IBRAHYM v2.0 groundwater model, which is 0.5 to 4.0 m. In the German opencast lignite mining area, induced head differences across faults of the southeastern continuation of the PBFZ are as high as 130 m (Fig. 7A) and influence the deeper groundwater system.
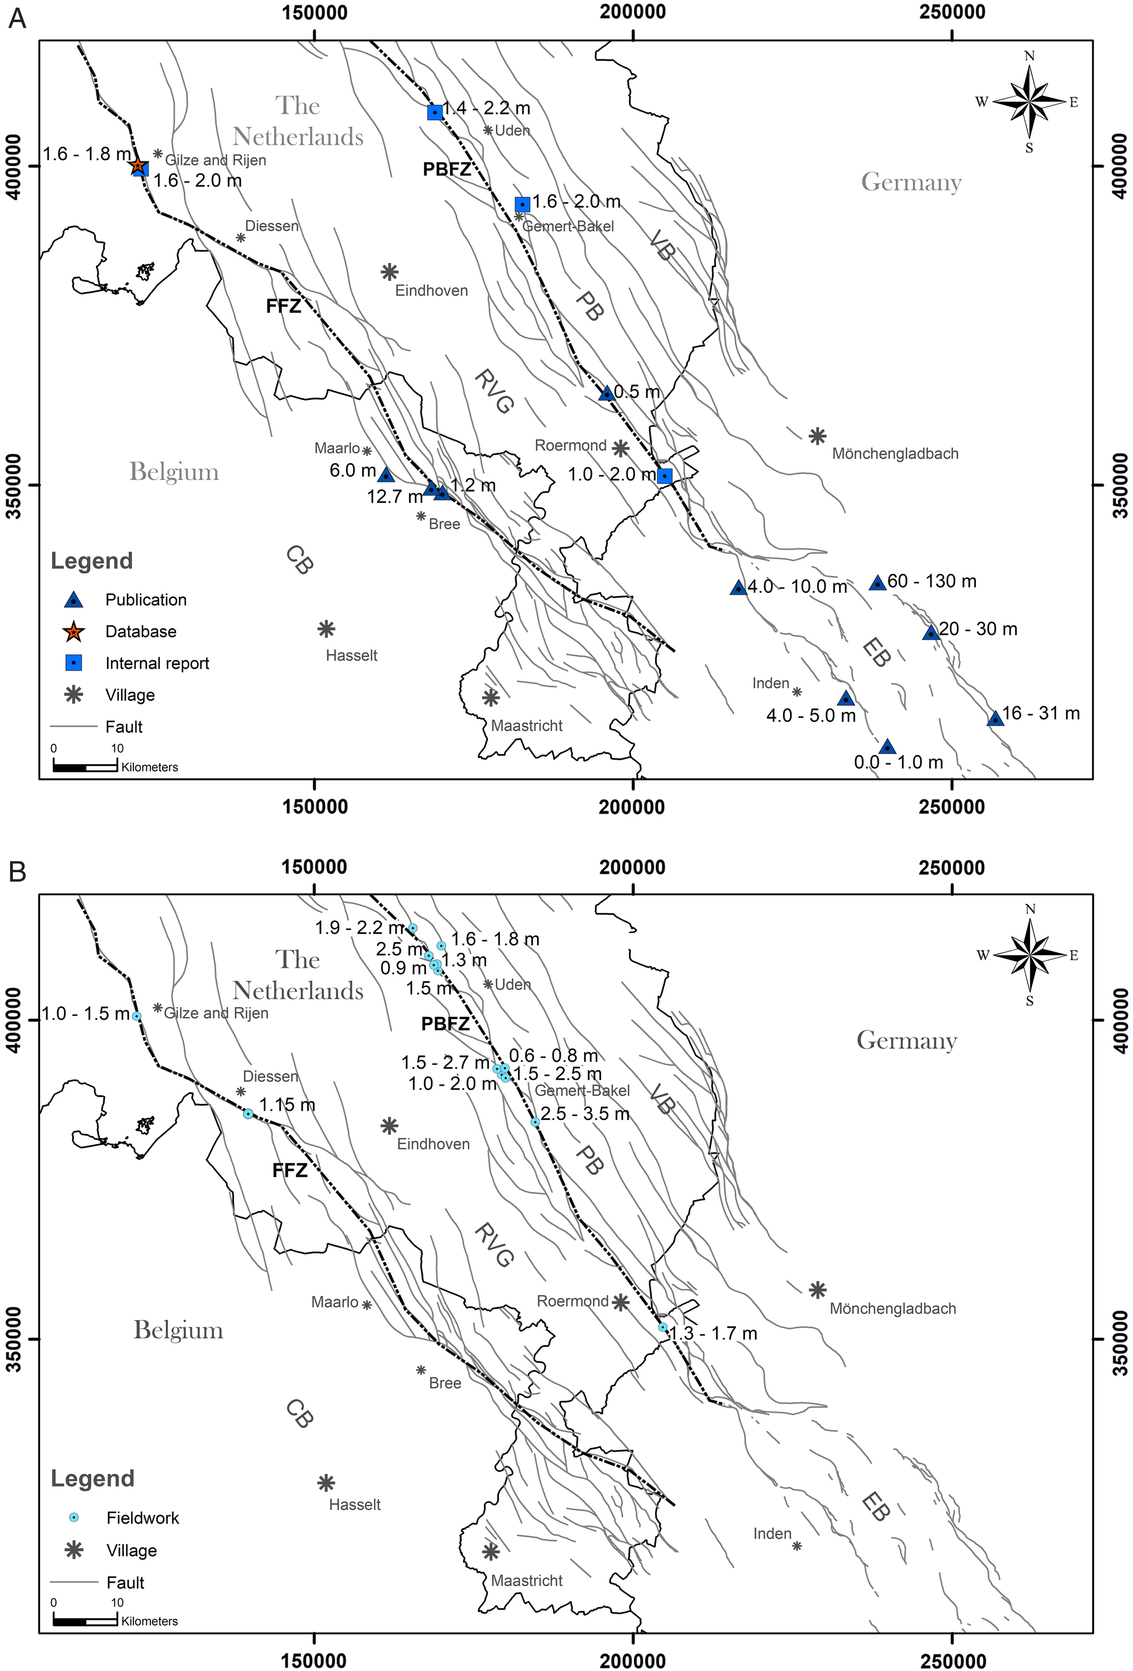
Fig. 7. Phreatic, cross-fault hydraulic head differences (m) in the RVRS based on publications, databases and internal reports (A) and fieldwork including new data collected for this study (B) during the 1948–2018 period.
For the FFZ, the available data sources show fault-related phreatic groundwater-level steps that vary from 1.0 to 2.0 m (Fig. 7). This range is not only smaller than the presented range for the PBFZ, but also somewhat smaller than the calibration values in groundwater model IBRAHYM v2.0, which is 0.0 to 3.0 m. At two locations in Belgium, larger steps are reported. In Bree (location 32) and in Maarlo (location 33), fault-related phreatic groundwater level steps of 12.7 and 6.0 m occur (Fig. 7A). Because topography drives shallow groundwater flow, the relation between topographic offsets and phreatic fault-related groundwater level steps for 26 (out of 39) locations is presented in Fig. 8. At two of these sites (locations 1 and 2) the hydraulic conductivity at point locations along the fault zone was also measured.
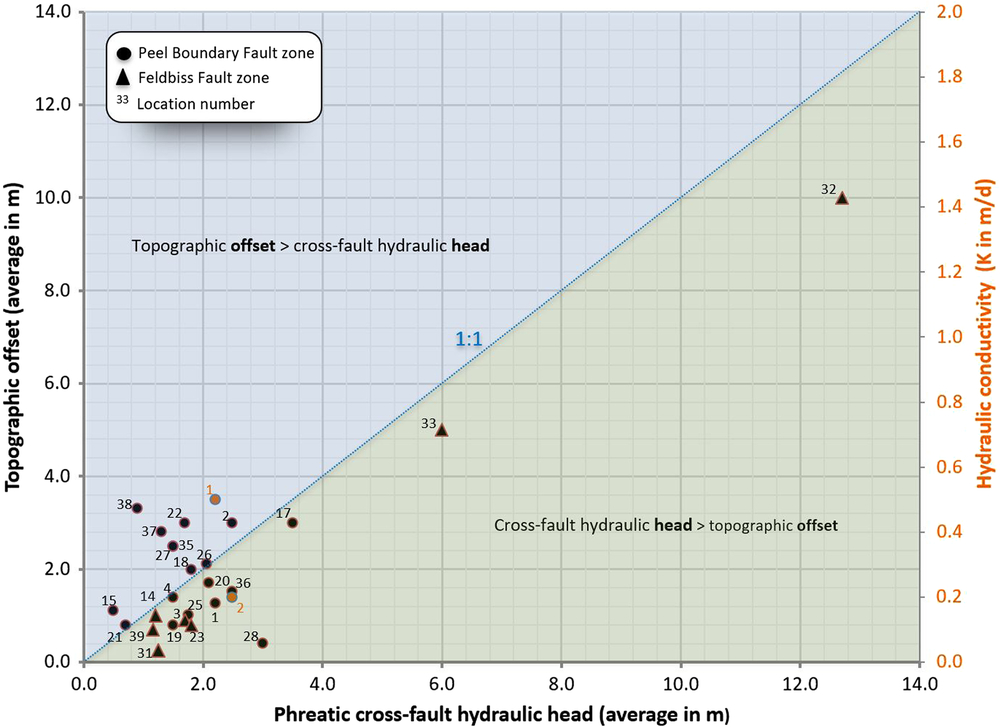
Fig. 8. Phreatic, cross-fault hydraulic heads compared with their corresponding topographic offset (26 locations) and with their corresponding hydraulic conductivities (two locations). A distinction is made between Peel Boundary Fault zone and Feldbiss Fault Zone data.
4.2 Fault zone permeabilities
The Netherlands onshore regional geohydrological information system (REGIS v2.2) provides horizontal and vertical permeability values at formation level. The majority of the near-surface part of, for example, fault zones from the PBFZ are in the Boxtel Formation. For this formation, REGIS provides horizontal permeability values in the range of 2.5 to 10.0 m d−1 and vertical permeability values in the range of 0.01 to 0.005 m d−1. However, these ranges represent undisturbed sediments and are therefore most likely not representative to quantify fault zone permeability in multiple directions. Our overview presents six fault zone locations with quantitative values for hydraulic conductivity and hydraulic resistance. The locations are unevenly distributed across the study area, and the presented values are based on different sources of information (Fig. 9). Two of those values are for the PBFZ (locations 1 and 17), one value for the Venlo Fault zone (location 2) and two values for the fault zones at the northern boundary of the Erft Block (locations 12 and 13). The hydraulic conductivity values at these locations varied from 0.013 to 0.5 m d−1. For the FFZ, hydraulic conductivity is available for the Geleen Fault trench site (location 16) where three box-core samples were taken (Bense et al., Reference Bense, Van den Berg and Van Balen2003). Based on the measured values of porosity and volumetric specific-surface area, the mean hydraulic conductivity and standard deviation for the three samples were calculated, using the semi-empirical Kozeny–Carman equation. The calculated mean hydraulic conductivity values varied from 7.7 m d−1 at 0.1 m distance from the fault core to 22.1 m d−1 closer to the damage zone at approximately 2 m distance from the fault core. These calculated values are up to two orders of magnitude larger than those reported in publications regarding the PBFZ, Venlo and Erft Fault zones mentioned above. Apart from the quantitative values, other sources provided a subjective description, such as ‘a substantial hydraulic resistance (low permeability) is expected based on the hydraulic head difference across the fault zone’ (locations 27 and 28) or ‘increasing differences in hydraulic head during the pumping test could be explained by the fact that the Milheeze Fault zone separates well WP4 from well WP5 and has significant low(er) permeability’ (location 5).
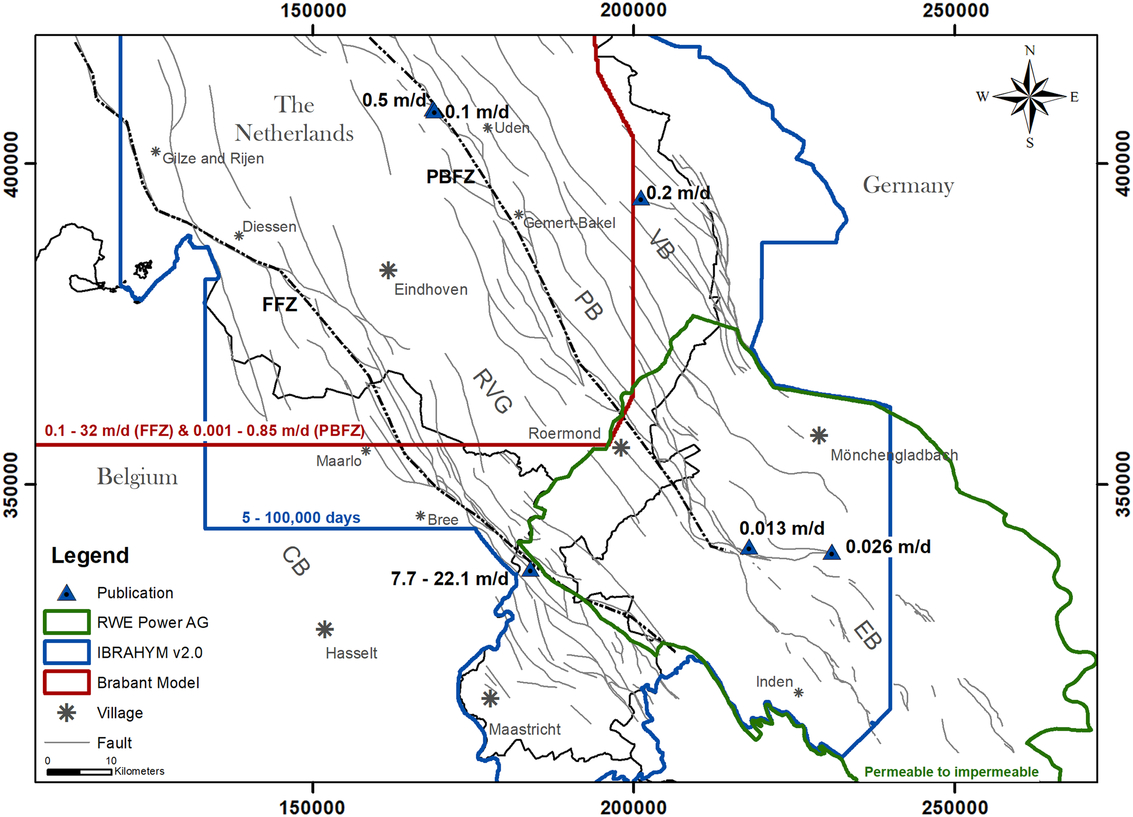
Fig. 9. Cross-fault hydraulic conductivity (m d−1) and hydraulic resistance (days) values in the RVRS per data source during the 1948–2018 period.
4.3 Hydraulic conductivity and hydraulic resistance values in groundwater models
Three regional groundwater models (Fig. 9) covering sub-regions in the RVRS were consulted: RWE Power AG model, Brabant Model and IBRAHYM v2.0 model. Each of these models incorporated fault zone permeability in a different way.
In the RWE Power AG model, fault zone permeability is implemented by applying low(er) hydraulic conductivity values to fault zone grid cells. These conductivity values were iteratively calculated and optimized until the modelled head differences matched with field-measured hydraulic head differences. In this way, specific ‘model K-values’ are generated for fault zone grid cells and assigned to each fault zone, taking into account different hydrogeological model layers. The resulting fault zone conductivity values vary from permeable to clay-like impermeable. Unfortunately, an overview of ‘model K-values’ is lacking (S. Lenk, pers. comm., 2017).
In the Brabant Model, the hydraulic conductivity values of fault zones are directly related to the transmissivity of the adjacent model layers (aquifers and aquitards) by introducing a ‘reduction factor’. This factor is not a constant, but a modelling result of calibration cycles to adjust for the measured cross-fault hydraulic head differences. This approach is thus very similar to the method applied in the RWE Power AG model. The resulting conductivities are layer-specific and vary between 0.1 and 32 m d−1 for the FFZ and 0.001 and 0.85 m d−1 for the PBFZ. This distinction at regional scale is based on model calibration results and corresponds with the previously presented hydraulic head differences (Fig. 7) and conductivity values (Fig. 9) at local scale.
IBRAHYM is a 19-layer groundwater model developed in the 2005–2007 period for the Province of Limburg in the Netherlands. In 2015 a new version with several model improvements was released (IBRAHYM v2.0). Recently (2018), the model layer schematization, including faults, was improved by using the Netherlands onshore regional geohydrological information system (REGIS v2.1). The subsurface in this model is now schematized as a series of tops and bases of (hydro)geological layers with vertically orientated faults. Based on expert judgement, hydraulic resistance values have been assigned to each fault plane in the model. For fault planes representing minor faults, the hydraulic resistance value ranges from 5 to 500 days and for fault planes representing major faults, such as the PBFZ and FFZ, the hydraulic resistance value is fixed at 100,000 days (J. Cok, pers. comm., 2019).
In conclusion, the Brabant, RWE Power AG and IBRAHYM v2.0 groundwater models incorporate fault zones slightly differently and the models do not account for heterogeneity to model three-dimensional groundwater flow near fault zones.
5. Discussion
Our results show that fault-related groundwater level steps appear to be related to fault zone topographic offset and fault permeability (see also below). However, these steps are also affected by groundwater abstractions, local water level management (e.g. land drainage), by seasonal influences as a result of natural variation in rainfall and evapotranspiration (e.g. locations 18–21 and 25) and by distance between measurement locations across the fault zone. Concerning the latter, Fig. 2B shows the influence of distance between measurement locations on the reported phreatic across-fault hydraulic head differences, where a larger distance (L) results in a larger groundwater level step (expressed as head loss h L). At the same time a larger distance (L) results in a lower cross-fault hydraulic gradient (i) despite a larger head loss (h L), because it is outnumbered by the distance between measurement locations. If the measurement locations are narrowed, the magnitude of the cross-fault hydraulic head difference decreases with decreasing distance. Because in the majority of the reviewed cases it is unknown at what distance from the fault the hydraulic heads were measured, and because there is no standard measurement protocol available, the data in Fig. 8 should be regarded as the best possible approximate values for the phreatic across-fault hydraulic head differences. Despite the uncertainties in the hydraulic head data, they are still useful for making inferences on a regional scale.
5.1 Cross-fault hydraulic head and topographic offset
Our data suggest that an increase in topographic offset corresponds with a larger cross-fault hydraulic head, especially for the FFZ (Fig. 8). A similar finding was made by Deckers et al. (Reference Deckers, Van Noten, Schiltz, Lecocq and Vanneste2018) for the Grote Brogel Fault of the FFZ (Bree and Maarlo). However, at some locations (e.g. locations 15 and 36) the topographic offset is (almost) the same but the hydraulic head varies from approximately 0.5 to 2.5 m, indicating that at these locations cross-fault hydraulic head variation is not explained by topographic offset alone. In the German opencast lignite mining area, fault-related groundwater level steps of up to 130 m were recorded (Fig. 7A). These hydraulic head differences (locations 6–13) are artificially induced and caused by extensive groundwater pumping of around 550 million m3 a−1 to sufficiently lower the groundwater table for opencast mining activities.
Our overview study has not revealed locations where no hydraulic head differences occur. This implies that the faults have associated groundwater steps everywhere, in agreement with the three consulted groundwater models and with the fact that the faults are visible at the surface as cropmarks and soil moisture contrasts. Thus, discontinuity of faults, for example resulting from relay structures (Bense and Van Balen, Reference Bense and Van Balen2004), does not seem to have a major impact on the large-scale hydrogeology. However, observational bias cannot be excluded, due to a focus on fault locations with a clear visible fault scarp and an already proven step in groundwater level.
The data compilation has resulted in six sources with hydraulic conductivity values (Fig. 9). Locations 1 and 2 (Fig. 8) demonstrate the expected relationship where a lower hydraulic conductivity value (K-value) indicates a decrease in fault zone permeability and leads to a larger phreatic cross-fault hydraulic head. Thus, based on this, at locations where phreatic cross-fault hydraulic heads are larger than the corresponding topographic offset, the fault zone acts as a more efficient barrier. This seems the case at locations 3, 14, 23, 31, 32, 33 and 39 (Fig. 8). An alternative explanation could be that deeper groundwater abstractions on the hanging wall have an effect on phreatic groundwater systems, creating artificially increased cross-fault hydraulic head differences. At locations 22, 37 and 38 near the PBFZ a relatively large topographic offset exists in combination with a relatively small corresponding cross-fault hydraulic head, deviating from our trend observation between topography and hydraulic head changes. This could result from a locally more permeable fault zone or it could be due to the way hydraulic heads were measured, especially the distance to the fault (Fig. 2B). Another deviation is seen at location 16 near the FFZ. This location shows substantially higher permeability values (7.7 and 22.1 m/d−1) compared to other locations, which has been explained by the fact that sampling (based on three box-core samples) was outside the fault core (Bense et al., Reference Bense, Van den Berg and Van Balen2003). The reported uncertainties and limitations of the applied Kozeny–Carman equation (Xu & Yu, Reference Xu and Yu2008) could also be a reason for this deviation.
5.2 Fault zone permeability and heterogeneity
The reviewed sources, including the three groundwater models, make no distinction between permeability in horizontal and vertical groundwater flow directions in the fault zone (fault core and damage zone together). The model conductivity and hydraulic resistance values have in common that they are non-directional and result from calibration (output) instead of in situ or laboratory measurements (input) and do not distinguish between permeability differences caused by tectonic processes in the damage zone and in the fault core (Bense & Person, Reference Bense and Person2006). As a result, these models are not yet optimally equipped for simulating three-dimensional groundwater flow in unconsolidated sediments near fault zones in the RVRS. However, this differentiation is important because several studies on groundwater flow near fault zones indicate a reduced groundwater flow in horizontal, cross-fault direction and an expected preferential flow in vertical direction (Bense, Reference Bense2002; Lewis et al. Reference Lewis, Knipe and Anren2002; Bense & Person, Reference Bense and Person2006; Anderson & Bakker, Reference Anderson and Bakker2008; Bense et al., Reference Bense, Person, Chaudhary, You, Cremer and Simon2008, Reference Bense, Shipton, Kremer and Kampman2016; Howald et al., Reference Howald, Person, Campbell, Lueth, Hofstra, Sweetkind, Gable, Banerjee, Luijendijk, Crossey, Karlstrom, Kelley and Philips2015; Gumm et al., Reference Gumm, Bense, Dennis, Hiscock, Cremer and Simon2016; Stober et al., Reference Stober, Zhong, Zhang and Bucher2016). In addition, heterogeneity should be considered. This is necessary because groundwater flow is influenced by sedimentary heterogeneity (Bersezio et al., Reference Bersezio, Bini and Giudici1999), e.g. in faulted deposits, and by sedimentary structures as shown by Lapperre et al. (Reference Lapperre, Smit, Simmelink and Van Lanen1996) who studied heterogeneity using hydraulic conductivity measurements on 271 undisturbed core samples taken in horizontal, vertical and ‘structure’ direction. Based on water-saturated model experiments (Schmatz et al., Reference Schmatz, Vrolijk and Urai2010) and multiple experiments using a water-saturated sandbox to simulate clay smear, Kettermann et al. (Reference Kettermann, Urai and Vrolijk2017) concluded that flow patterns under these circumstances are complex and three-dimensional. Vertical temperature profiles in nests of piezometers in unconsolidated sedimentary aquifers in the German opencast lignite mining area also indicate fault zone heterogeneity. These profiles revealed thermal anomalies up to +8°C. Bense et al. (Reference Bense, Person, Chaudhary, You, Cremer and Simon2008) explained these irregularities under the assumption that faults act as a conduit–barrier system and form sub-vertical pathways connecting deep and shallow aquifers that are elsewhere separated. Our dataset predominantly provides single measurements that relate to the shallow groundwater system and is therefore not suitable to study the deeper part of groundwater systems. Bense & Van Balen (Reference Bense and Van Balen2004) suggest using the Shale Gouge Ratio (SGR) method to estimate fault zone hydraulic properties in hydrogeological modelling. This ratio quantifies the effect of clay smearing on hydrodynamic behaviour of faults and is widely used in hydrocarbon-related studies. Perhaps this method can also be applied to shallow groundwater systems.
5.3 Iron (hydr)oxide precipitation and fault self-sealing
Seepage with high iron concentrations occurs at various locations (e.g. locations 17–22, 25–28 and 35–38) on the foot wall of the PBFZ and Feldbiss Fault zone (location 39). This phenomenon results in orange-coloured watercourses, dams and weirs overgrown with iron bacteria, soil profiles with an orange colour, orange sludge flowing from drainage tubes and the local presence of iron-cemented sand layers (Fig. 3). Dejonghe (Reference Dejonghe1985) describes two potential sources for the origin of iron in the adjoining Belgian territory: the glauconiferous Late Tertiary marine deposits and the weathering of the surficial deposits. In the study area these are the deposits of the deeper-situated Breda Formation and the surficial coversand deposits of the Boxtel Formation respectively. Given the predominantly limited height difference between e.g. the top of the Peel Block and RVG, which is in the order of 10 m, the shallow groundwater system does not reach a large depth, so a coversand source seems most likely. The iron deposits in the RVRS provided a valuable and renewable source for local iron production from Roman times. In the Netherlands these local-scale mining activities were mainly concentrated in stream valleys (Van Enk, Reference Van Enk2016) and near fault zones. In both situations the hydrogeological processes are characterized by a permanent influx of iron-rich groundwater (Fig. 3) from anoxic depth where iron is reduced combined with favourable oxic conditions for (near-)surface precipitation to such an extent that thick and hard iron ore layers were formed. These layers contribute to the sealing capacity of several fault zones within the boundaries of our inventory area. According to farmers, after deep ploughing of fault zones to improve water drainage, their agricultural land suffers from renewed wetness within a period of only a few years. When it comes to drainage systems, they reported that at least biannual, but sometimes even annual, maintenance is required to ensure sufficient drainage capacity. Based on field observations in 2016–2018 near the villages of Uden (Fig. 1B), Heesch, Gemert-Bakel and Deurne, as well as earlier field reconnaissance studies by the regional water authority De Aa (2003), Bonte & Witjes (Reference Bonte and Witjes Th.2007), Van Balen (Reference Van Balen2009) and Ettema (Reference Ettema2010), iron precipitation and the associated catalysing effect of iron bacteria could play a role in the mechanism of self-sealing for the shallow, near-surface part of fault zones. This observed mechanism of self-sealing is probably complex and has not been studied in detail so far. The first step of such a study could be to identify the (key) factors involved in self-sealing, their mutual interaction and cost-effective measures to enhance this mechanism. Self-sealing could be effective for restoration of existing and drained wijstgronden and needs further study.
6. Conclusions
Phreatic groundwater levels across the Peel Boundary Fault zone demonstrate a step of 1.0 to 2.5 m with a maximum range of 0.5 to 3.5 m, and phreatic groundwater levels across the Feldbiss Fault zone are in the order of 1.0 to 2.0 m. The faults seem to have associated groundwater steps everywhere, without discontinuities. The cross-fault groundwater level step size is determined by a permeability reduction of the fault zone and by topographic offset as a result of fault throw: an increase in offset thus seems to correspond with a larger phreatic cross-fault groundwater level step.
Hydraulic conductivity values for the PBFZ, based on gradient analysis, pump tests, expert judgement and model calibration, vary between 0.013 and 0.5 m d−1. For the Feldbiss Fault zone, hydraulic conductivity estimations, based on three box-core values, vary between 7.7 m d−1 near the fault core and 22.1 m d−1 close to the damage zone.
Acknowledgements
Regional water authority Aa en Maas, the Province of Noord-Brabant and drinking water company Brabant Water have a common interest in acquiring more knowledge about groundwater flow processes near fault zones in their management areas and have supported this inventory as part of a more extensive research. Their support is highly appreciated. Jon and Tom Mensink are complimented for their unremitting contribution and knowledge of digital groundwater-monitoring techniques during many days of fieldwork. The cooperation with Stephan Lenk from regional water authority Erftverband, who kindly shared his knowledge on groundwater flow and fault zone permeability in the German opencast lignite mining area, is highly appreciated. Regional water authority Aa en Maas (Chris van Rens and Jos Moorman), drinking water company Brabant Water (Jelle van Sijl and Jeroen Castelijns) and regional water authority Limburg (Jurriaan Cok) were willing to share their vision on modelling fault zones using 3D regional groundwater models. We would like to thank Jelle Buma and an anonymous reviewer for their positive comments and suggestions.
Supplementary material
To view the table with metadata from the 39 reviewed sources, please visit https://doi.org/10.17026/dans-zug-4hcr.


 Open access