


Overweight and obesity are increasing in prevalence worldwide( Reference Ng, Fleming and Robinson 1 , Reference Midthjell, Lee and Langhammer 2 ), and are associated with a range of adverse health outcomes( Reference Lu, Hajifathalian and Ezzati 3 – Reference Aune, Sen and Prasad 5 ). The highest increase in obesity rates has been reported among young women( Reference Midthjell, Lee and Langhammer 2 ). A recent large population-based study revealed that less than one in 100 obese persons managed to achieve and sustain normal weight( Reference Fildes, Charlton and Rudisill 6 ). Thus, maintaining normal weight is of high value and preferable to treating overweight and obesity( Reference Fildes, Charlton and Rudisill 6 , Reference Poston, Bell and Croker 7 ). One of the biological causes for female overweight is related to the natural increase in weight during pregnancy and its influence on future weight-gain trajectory( Reference Rong, Yu and Han 8 ). Approximately 75 % of women retain the extra weight they gain following pregnancy( Reference Endres, Straub and McKinney 9 ). This extra adipose tissue may be difficult to lose later, and may adversely influence metabolism.
Increased body weight before entering new pregnancies may also affect subsequent pregnancies. Pre-pregnant maternal obesity is associated with a range of adverse pregnancy and neonatal outcomes, such as increased risk of pre-eclampsia, gestational diabetes, offspring malformations and later obesity in the child( Reference Poston, Caleyachetty and Cnattingius 10 ). Both pre-pregnancy BMI, excessive gestational weight gain (GWG) and post-partum weight retention have been identified as risk factors for long-term maternal weight gain( Reference Kirkegaard, Stovring and Rasmussen 11 ). This highlights the importance of the pre-pregnancy–pregnancy–post-partum period in relation to the primary prevention of obesity( Reference Hanson, Barker and Dodd 12 ).
Diet is important in the prevention of excessive weight gain during pregnancy and in the prevention of obesity in general. Several intervention studies have explored the effectiveness of dietary modifications on GWG and on short-term weight retention, showing that it is possible to affect GWG with dietary changes during pregnancy( Reference Thangaratinam, Rogozinska and Jolly 13 ). Associations between dietary patterns during pregnancy and short-term weight development post-partum have also been investigated in longitudinal studies( Reference Kirkegaard, Stovring and Rasmussen 11 , Reference Von Ruesten, Brantsaeter and Haugen 14 ). Von Ruesten et al. ( Reference Von Ruesten, Brantsaeter and Haugen 14 ) found that adherence to the Nordic food guidelines during pregnancy was associated with lower post-partum weight retention up to 6 months in the Norwegian Mother and Child cohort. However, few have explored the association between dietary patterns in pregnancy and longer-term weight development of the mother( Reference Kirkegaard, Stovring and Rasmussen 11 ).
The concept of the New Nordic Diet (NND) was reported in 2009 as a potentially sustainable regional alternative to the Mediterranean diet( Reference Bere and Brug 15 ). Documentation of its dietary composition and nutritional qualities was further developed by Mithril et al.( Reference Mithril, Dragsted and Meyer 16 ). The NND is characterised by foods that can be produced within the Nordic countries such as whole grains, potatoes, milk, fruits, berries, root vegetables, cabbages, wild game and fish( Reference Bere and Brug 15 , Reference Mithril, Dragsted and Meyer 16 ). We previously showed that higher adherence to this dietary pattern was associated with healthier macronutrient distribution and higher nutrient density in a cohort of pregnant women( Reference Hillesund, Bere and Haugen 17 ). Health effects of Nordic Diets are increasingly being investigated in the Nordic countries( Reference Poulsen, Due and Jordy 18 – Reference Poulsen, Crone and Astrup 21 ). In intervention trials, increasing adherence to aspects of healthy Nordic diets has been shown to be beneficial with respect to weight loss( Reference Poulsen, Due and Jordy 18 , Reference Adamsson, Reumark and Fredriksson 20 ), satiety( Reference Poulsen, Crone and Astrup 21 ) and weight regain after weight loss( Reference Poulsen, Crone and Astrup 21 ). Furthermore, in observational studies, increased adherence to aspects of a Nordic diet has been inversely associated with abdominal obesity( Reference Kanerva, Kaartinen and Ovaskainen 22 , Reference Kanerva, Kaartinen and Schwab 23 ), body fat percentage( Reference Kanerva, Kaartinen and Ovaskainen 22 ), risk of excessive GWG in normal-weight women( Reference Hillesund, Bere and Haugen 17 ) and inflammatory markers associated with obesity( Reference Kanerva, Loo and Eriksson 24 ). The association between adherence to a Nordic diet during pregnancy and long-term weight trajectories has, however, not been investigated. Thus, the current study aimed to investigate the associations between maternal adherence to the NND during pregnancy and maternal BMI trajectories up to 96 months post delivery.
Methods
Participants and data sources
We used linked data from the Norwegian Mother and Child Cohort Study (MoBa)( 25 ) and the Medical Birth Registry of Norway (MBRN)( Reference Irgens 26 ). The MoBa cohort is a prospective population-based pregnancy cohort study conducted by the Norwegian Institute of Public Health( Reference Magnus, Irgens and Haug 27 – Reference Magnus, Birke and Vejrup 29 ). Participants were recruited from all over Norway from 1999 to 2008. The women consented to participation in 40·6 % of the pregnancies. At the time of this report, the cohort includes 114 500 children and 95 200 mothers. MBRN was established in 1967 and is based on compulsory notification of all live births and still births from 16 weeks of gestation (12 weeks from 2001) in Norway( Reference Irgens 26 ) (Fig. 1).
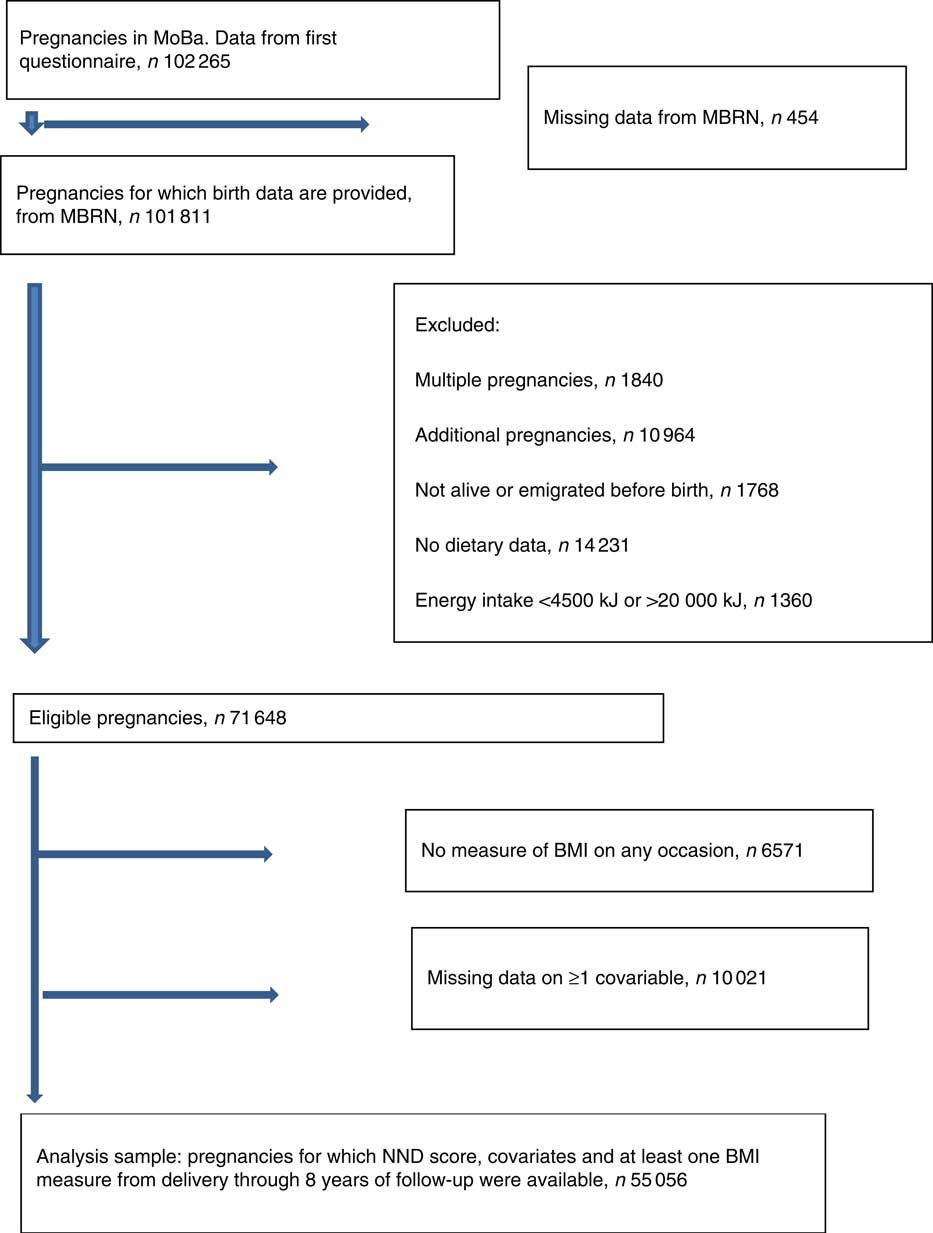
Fig. 1 Flow chart of sample selection. MoBa, Norwegian Mother and Child Cohort Study; MBRN, Medical Birth Registry of Norway; NND, New Nordic Diet.
Fig. 1 describes how we arrived at the number of participants to be included in the analyses. In total, 102 265 unique pregnancies were identified from the MoBa study, and of these 101 811 had data from the MBRN. We only included women carrying a single fetus, and only the first pregnancy if a mother participated with more than one pregnancy in the MoBa cohort. We excluded pregnancies resulting in perinatal deaths, and women who emigrated before birth. We also excluded those who had not completed the FFQ in mid-pregnancy, and those with extreme energy intakes defined as <4500 kJ or more than 20 000 kJ( Reference Meltzer, Brantsaeter and Ydersbond 30 ). Of 71 648 eligible pregnancies, the ones who did not have data for calculation of BMI on any occasion (n 6571) and those with missing data on one or more covariable (n 10 021) were excluded. The final analysis sample comprised 55 056 pregnancies.
Written informed consent was obtained from each MoBa participant upon recruitment. The study was approved by The Regional Committee for Medical Research Ethics in South-Eastern Norway (reference S-97045 and S-95113). Follow-up is conducted by questionnaires at regular intervals. The present study is based on version 7 of the data files from the MoBa study made available in 2014. Data from seven different postal questionnaires were used. In questionnaire 1 (Q1), completed around gestational week 17, women provided information about lifestyle and socio-economic factors. Questionnaire 2 (Q2), completed around gestational week 22, contained a validated FFQ. Further data on maternal weight were collected from follow-up questionnaires.
Outcome
Height and pre-pregnant weight were self-reported and collected around week 17 of pregnancy. Six additional self-reported weight measures were included in the analyses: at delivery (before giving birth), and at 6, 18, 36, 60 and 96 months post delivery. BMI (weight (kg)/height (m2)) was calculated at each time point and used as the main outcome. We standardised height, weight and BMI using z scores and only included values within +/−4 sd in the analyses. From this standardisation, 296 out of 231 290 BMI observations were removed, in total 0·1 %. As weight and BMI were not normally distributed, these variables were log-transformed before the z scores were computed. If a mother became pregnant again, she was censored at the point of this subsequent pregnancy.
The New Nordic Diet score
The exposure of interest in the present study was degree of adherence to the NND as measured by a previously constructed diet score( Reference Hillesund, Bere and Haugen 17 ).
The rationale for, and the construction of, the NND score has been thoroughly described elsewhere( Reference Hillesund, Bere and Haugen 17 ). In short, the score is built from ten subscales capturing different identities of the NND: (1) meal pattern (frequency of eating breakfast, lunch, dinner and evening meal), (2) Nordic fruits (frequency of eating pears, apples, plums and strawberries), (3) root vegetables (frequency of eating carrots, rutabaga and onions), (4) cabbages (frequency of eating kale, cauliflower, broccoli and Brussels sprouts), (5) potatoes (frequency of eating potatoes relative to rice and pasta), (6) whole-grain breads (consumption of whole-grain breads relative to refined breads), (7) oatmeal porridge (frequency of eating oatmeal porridge), (8) foods from the wild countryside (frequency of eating native berries, game, wild fish and seafood), (9) milk (consumption of unsweetened milk relative to fruit juice) and (10) water (consumption of water relative to all kinds of sweetened beverages).
Each subscale was constructed from one or more relevant FFQ items in the questionnaire completed by mothers around week 22. The FFQ included 255 items, covering diet during the first half of pregnancy. The frequency of consumption was given per day, per week and/or per month, depending on the food item. Predefined portion sizes were applied to bread and drinks( Reference Brantsaeter, Haugen and Alexander 31 ). Single missing values in the FFQ were addressed by assuming that any missing value in the FFQ was likely to reflect no intake and therefore assigned ‘0’( Reference Cade, Thompson and Burley 32 ). Each subscale was dichotomised with the sample-specific median as cut-off. Participants were assigned a score of ‘1’ in any given subscale if they had frequency of intake above the median. The diet score ranged from 0 to 10 points, with higher participant score reflecting higher adherence to the NND. Participants were categorised as having ‘low’ (0–3 points), ‘medium’ (4–5 points) or ‘high’ (6–10 points) NND adherence. This was performed in line with previous analyses with NND adherence as the exposure, where diet quality of the respective adherence categories is presented. In short, high NND adherence yields higher intakes of energy, nutrients and higher nutrient density, as well as higher intakes of fruits, vegetables, milk, whole-grain bread, fish, meat and desserts, whereas lower intakes of sweetened beverages, sweets and snacks( Reference Hillesund, Bere and Haugen 17 ). Similar methods of constructing diet scores for assessing diet–disease associations have been widely reported in epidemiological studies, especially diet scores reflecting adherence to the Mediterranean diet( Reference Bach, Serra-Majem and Carrasco 33 ).
Potential confounders and mediators
Eight covariates were selected for their known association with maternal weight gain: maternal age, parity, maternal educational level, pre-pregnant smoking, pre-pregnant physical activity level, maternal energy intake, offspring birth weight and duration of exclusive breast-feeding. From the MBRN, we obtained information on the women’s age at delivery, parity and offspring birth weight. The first MoBa questionnaire provided data on maternal height, pre-pregnant weight, maternal education, pre-pregnant smoking and pre-pregnant physical activity. Energy intake was extracted from calculations based on the MoBa FFQ answered around week 22 of pregnancy. The MoBa follow-up questionnaires at 6 and 18 months post delivery provided data on exclusive breast-feeding duration. Detailed information about the measurement of these covariates is provided in the online Supplementary material.
Statistical analysis
Means and standard deviations, medians and interquartile ranges and proportions were used to describe the women included in the analyses and to compare with women who were eligible but had missing data on the exposure and/or at least one covariable.
Linear spline multi-level models with a random intercept and random slopes were used to estimate the association between NND adherence and the post-partum trajectory of maternal BMI (kg/m2). A visualisation of the overall mean trajectory and individual trajectories suggested that knots at 6 and 18 months most closely captured the shape of the trajectory (see Fig. S1 in the online Supplementary material). To check the robustness of our findings to this choice, we also performed a sensitivity analysis using knots at 6 months and 3 years post-partum. The NND score was modelled as approximate tertiles (described above) so that non-linear associations could be explored. Using quartiles or quintiles would cause the model to have many more parameters and be very complex; tertiles were therefore used. The NND exposure was allowed to affect the intercept and all three slopes. Thus, the measures of association were the difference in maternal BMI at birth (in kg/m2) and the differences in BMI velocities (kg/m2 per year) from birth to 6 months, 6–18 months and 18 months to 8 years post-partum, comparing each of the medium and high NND adherence tertiles against the low NND tertiles.
Three sets of analytical models were considered: a crude model (unadjusted), a model adjusted for potential confounders (model (a)) and a model adjusted for both potential confounders and exclusive breast-feeding duration (model (b)). All covariables were also allowed to affect the intercept and slopes. Model (a) adjusted for maternal age (years), parity (nulliparous, multiparous), offspring birth weight (g), pre-pregnancy maternal smoking (none, occasional, daily), years in education of the mother (<13 years, 13–16 years and ≥17 years), pre-pregnancy physical activity levels (regular, irregular, light, none) and energy intake (quintiles). Model (b) included the variables in model (a) and duration of exclusive breast-feeding. Maternal age, offspring birth weight and breast-feeding were modelled as continuous variables; all others were modelled as categorical variables.
We also fitted a linear spline model with no explanatory variables to describe the post-partum trajectory of BMI for the so-called average woman in the cohort and a set of models including NND score with adjustment for each potential confounder in turn to understand the confounding structure of the NND score. Finally, as a secondary analysis, we examined the association between NND score and trajectories of overweight or obesity using mixed logit models.
All statistical analyses were conducted in Stata (version 14), and plots of the marginal means in each NND category were produced using R (version 3.3.3).
Results
Sample description
Table 1 describes the analysed sample along with a comparison with those who were eligible but not included in the analyses owing to missing data. With respect to those included in the analysis sample, the median age at delivery was 30 years. The median BMI was 28·6 kg/m2 at delivery and 24 kg/m2 8 years post delivery, and at 8 years 39·6 % of the mothers were classified as overweight/obese. The median NND score was 5·0. In all, 70 % had received a higher education, 46 % had one or more than one previous children and 73 % were non-smokers before pregnancy. A total of 50 % reported regular physical activity before getting pregnant and 28·7 % reported that they exclusively breast-fed the child 4 months post-partum. Those excluded owing to missing data had on average slightly higher BMI, less years of education, higher energy intake and were more likely to be multiparous, less active and not having initiated breast-feeding.
Table 1 Description of study sample and comparison with those eligible but not included in the analysis due to missing data(Medians and interquartile ranges (IQR); numbers and percentages)

NND, New Nordic Diet.
Association between maternal New Nordic diet score and covariables
Table 2 shows the associations between the covariables and the NND adherence tertiles. All potential confounders were unevenly distributed according to NND adherence. Participants with higher adherence to the NND were on average older and more physically active and had higher energy intakes. Those with higher NND adherence were also more likely to have received more years of education, be multiparous and non-smokers and exclusively breast-feed for more than 4 months. Babies born to mothers in the highest NND tertile were also more likely to be heavier.
Table 2 Associations between each potential confounder/ mediator and New Nordic Diet (NND) score(Numbers and percentages)

* χ 2 test unless indicated.
† F test.
Post-partum BMI trajectories and its association with maternal New Nordic diet adherence
The post-partum BMI trajectory for the so-called average woman in the cohort was characterised by a loss of approximately 5 kg/m2 over the first 6 months followed by a gradual gain of 0·01 kg/m2 per year up to 18 months and slightly elevated gains of 0·1 kg/m2 per year up to 8 years (full results available on request).
Table 3 shows the association between maternal NND adherence during pregnancy and maternal BMI at birth and changes in BMI in intervals up to 8 years post-partum. These results are visualised in Fig. 2, which plots the marginal mean trajectory of BMI at birth, 6 months, 18 months and 8 years post-partum for each NND category. In the unadjusted model, there was a strong linear relationship between NND adherence and BMI at birth, with lower BMI among higher NND adherers. On average, women in the highest NND adherence tertile had a BMI 0·6 kg/m2 lower at birth compared with those in the lowest tertile. This association was attenuated by approximately a half to −0·32 kg/m2 after adjustment for confounders (model (a)) and attenuated further to −0·25 kg/m2 after adjustment for exclusive breast-feeding duration (model (b)), but the evidence was still strong.
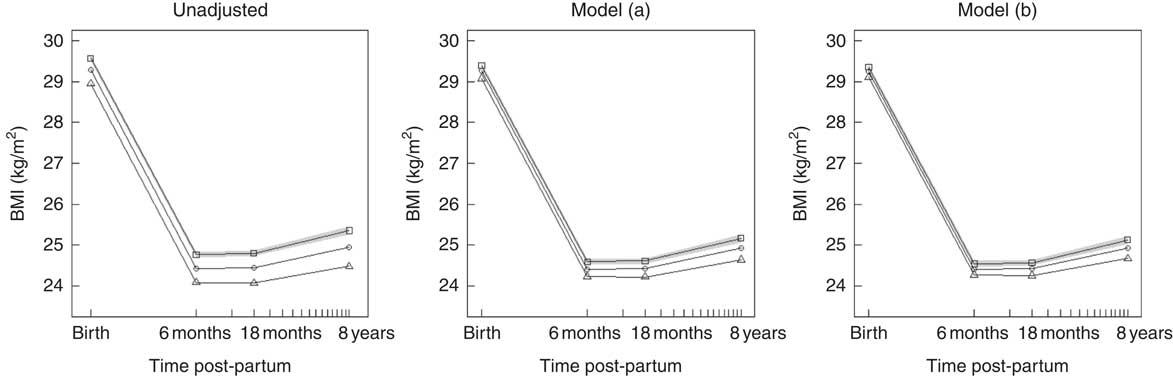
Fig. 2 Predicted marginal mean BMI trajectory for each category of New Nordic Diet (NND) adherence score. The plot on the left is from the unadjusted model; the middle plot is the confounder-adjusted model (a); and the right plot the confounder plus mediator model (b). For clarity, only the 95 % CI for NND tertile 1 (lowest) is shown (![]() ).
). ![]() , NND tertile 1 (lowest);
, NND tertile 1 (lowest); ![]() , NND tertile 2;
, NND tertile 2; ![]() , NND tertile 3 (highest). Model (a): adjusted for maternal age, parity, education, pre-pregnant smoking, physical activity, energy intake and offspring birth weight. Model (b): model (a)+exclusive breast-feeding duration.
, NND tertile 3 (highest). Model (a): adjusted for maternal age, parity, education, pre-pregnant smoking, physical activity, energy intake and offspring birth weight. Model (b): model (a)+exclusive breast-feeding duration.
Table 3 Associations between New Nordic Diet (NND) and post-partum BMIFootnote *(β-Coefficients and 95 % confidence intervals)

Ref., referent values.
* From the main analysis using knots at 6 and 18 months and complete cases (n 55 056).
† Model (a): adjusted for maternal age, parity, education, pre-pregnant smoking, physical activity, energy intake and offspring birth weight.
‡ Model (b): model (a)+exclusive breast-feeding duration.
There was some evidence that the highest adherers to NND had faster weight loss in the first 6 months following birth and lower weight gain thereafter to 8 years, although these associations were small, as shown by the parallel slopes in Fig. 2. After adjustment for confounders, only the slopes from 6 to 18 months and 18 months to 8 years post-partum in the highest adherers showed any evidence of a difference from the lowest adherers, but again the strength of association was small – a difference of only −0·04 kg/m2 per year and −0·02 kg/m2 per year for the 6–18 months and 18 months–8 year interval, respectively.
Separate plots of the predicted mean post-partum BMI trajectory for each category of NND adherence adjusted for each confounder one at a time are given in the online Supplementary material (Fig. S2). The covariables that most attenuated the relationship between NND and post-partum BMI were maternal education and breast-feeding duration, although each only( Reference Von Ruesten, Brantsaeter and Haugen 14 ) attenuated the association to a small extent. As expected given the positive association between energy intake and NND, adjusting for energy intake slightly intensified the association.
Sensitivity analysis
The results were broadly similar to the main analyses in models that used different knot points at 6 months and 3 years (see Table S1 and Fig. S3 in the online Supplementary material). Similarly, excluding the preterm births from the analysis sample did not alter the general findings (see Table S2 and Fig. S4 in the online Supplementary material).
Secondary analysis: New Nordic diet score and trajectories of overweight or obesity
Owing to non-convergence problems with estimation, it was only possible to fit a model with a single knot at 6 months in the secondary analysis of overweight/obese trajectories. Differences between NND tertiles in the proportion overweight or obese participants were not present at birth where the prevalence was, as expected, high (approximately 70 %) but emerged at 6 months post-partum and widened slightly through to 8 years (see Fig. S5 in online Supplementary material). The overall patterns were thus similar to those for BMI from 6 months.
Discussion
Our study showed that women with higher adherence to the New Nordic dietary pattern during pregnancy had on average lower post-partum BMI trajectories and slightly less weight gain up to 96 months post delivery. These associations were independent of a range of confounders, and were not explained by differences in energy intake or mediated by exclusive breast-feeding duration. Similar patterns of associations were seen with trajectories of overweight as the outcome.
Our results extend Von Ruesten et al.’s findings in the same cohort, which reported that higher adherence to the Nordic food-based dietary guidelines was associated with lower maternal weight retention at six months post-partum( Reference Von Ruesten, Brantsaeter and Haugen 14 ). Few studies( Reference Kirkegaard, Stovring and Rasmussen 11 , Reference Von Ruesten, Brantsaeter and Haugen 14 ) have investigated diet in pregnancy in relation to long-term maternal weight development. Kirkegaard et al.( Reference Kirkegaard, Stovring and Rasmussen 11 ) found that healthy dietary behaviours during pregnancy in the Danish National birth cohort was associated with lower weight gain 7 years later. Three distinct dietary patterns were described in this Danish cohort: a Western dietary pattern high in fat, dairy and red meat; a health-conscious dietary pattern with high consumption of fruit and vegetables; and an intermediate dietary pattern comprising women with intakes of foods from the other two dietary patterns in a balanced way( Reference Knudsen, Orozova-Bekkevold and Mikkelsen 34 ). Women with the intermediate dietary pattern in the Danish cohort have previously been described as the ones with the most varied diet( Reference Knudsen, Orozova-Bekkevold and Mikkelsen 34 ), and seem to have a diet quality that resembles that of the women with high NND adherence in our sample( Reference Hillesund, Bere and Haugen 17 , Reference Knudsen, Orozova-Bekkevold and Mikkelsen 34 ). Women consuming health-conscious and intermediate diets during pregnancy had gained less weight 7 years later than women consuming a Western diet( Reference Knudsen, Orozova-Bekkevold and Mikkelsen 34 ). Interestingly, both Von Ruesten et al. and Knudsen et al. adjusted for pre-pregnancy BMI in their analysis. Kramer et al.( Reference Kramer, Zhang and Bin 35 ) recommend not adjusting for earlier measures of the outcome when the exposure also affects the outcome at the earlier age. In an expository analysis, they show how such an adjustment results in a systematic underestimate of the effect of the exposure, in our case the NND score, as it appears twice on the right-hand side of the regression equation( Reference Kramer, Zhang and Bin 35 ). In line with this, we decided not to adjust for maternal pre-pregnancy BMI because it could be considered an over-adjustment. However, to enable a comparison with these two studies, we estimated an additional model with adjustment for pre-pregnancy BMI; see results in the online Supplementary material (Fig. S6, Tables S3 and S4). For a woman of average stature in our data set, this equated to a difference between high and low NND adherers of −0·1 kg at 6 months and −0·6 kg at 8 years post-partum. These associations are of similar magnitude to those described by Kirkegaard et al. and Von Ruesten et al.( Reference Kirkegaard, Stovring and Rasmussen 11 , Reference Von Ruesten, Brantsaeter and Haugen 14 ). Without adjusting for pre-pregnancy BMI, these differences equated to −1·04 and −1·48 kg at 6 months and 8 years, respectively. Similar over-adjustment arguments apply when considering controlling for GWG. Nonetheless, we performed a sensitivity analysis adjusting for GWG (online Supplementary Fig. S7, Table S5), and it did not influence the associations we report in this paper.
A few observational studies in non-pregnant populations have assessed cross-sectional associations between adherence to various Nordic diets and measures of weight or adiposity. The National FINRISK Study found that higher adherence to the National Finnish Dietary guidelines was associated with lower body fat in normal-weight women and less abdominal fat in men( Reference Kanerva, Kaartinen and Ovaskainen 22 ). In the same population, higher adherence to the Baltic Sea Diet was associated with lower abdominal obesity in men. A similar trend was observed in women, although not significant( Reference Kanerva, Loo and Eriksson 24 ).
Possible explanations for the more beneficial weight development with higher NND adherence could be a higher satiety potential of the diet, favourable gut microbial profile( Reference Wong 36 ) owing to the diet composition and a healthier regulation of hunger and satiety( Reference Poulsen, Crone and Astrup 21 ). The NND is characterised by high intakes of whole grain, vegetables and fruit, and low intake of sugar and sugar-sweetened beverages, all of which have been found to be associated with reduced long-term weight gain( Reference Mozaffarian, Hao and Rimm 37 , Reference Te, Mallard and Mann 38 ). A healthy Nordic diet in the NORDIET study was associated with high satiation( Reference Adamsson, Reumark and Fredriksson 20 ). In the FINRISK study, high consumption of fruit and low consumption of sugar were the most important contributors to low body fat in women( Reference Kanerva, Kaartinen and Ovaskainen 22 ). High intake of vegetables and rye( Reference Kanerva, Kaartinen and Ovaskainen 22 ), as well as other cereals( Reference Kanerva, Kaartinen and Schwab 23 ), contributed most to the prevention of abdominal obesity in men. These benefits might partly be explained by the high content of fibre, and for women low content of sugar in the Finnish diets( Reference Kanerva, Kaartinen and Schwab 23 ). Animal models suggest that ingestion of carbohydrates high in fibre might regulate appetite and energy homoeostasis through a number of mechanisms by which colonic SCFA are one of the modulators( Reference Byrne, Chambers and Morrison 39 ). High adherence to the NND in our data set also implied higher consumption of milk and higher consumption of milk relative to fruit juice( Reference Hillesund, Bere and Haugen 17 ). In several prospective studies, fruit juices( Reference Mozaffarian, Hao and Rimm 37 , Reference Schulze, Manson and Ludwig 40 ), as opposed to milk( Reference Mozaffarian, Hao and Rimm 37 , Reference Wang, Troy and Rogers 41 , Reference Rosell, Hakansson and Wolk 42 ), are reported to be positively associated with weight gain. Furthermore, in the present study, women with high, as compared with low, NND adherence had a lower intake of sugar-sweetened beverages, which has consistently been linked to weight gain( Reference Mozaffarian, Hao and Rimm 37 , Reference Hu 43 ).
Strengths to this study are the large population included, the robust dietary data from validated FFQ, birth outcomes from the MBRN and the statistical methods that maximise the sample size by including all women with at least one measure of BMI and are unbiased under the assumption that the data are missing at random. Further, our sensitivity analyses showed that the results were robust to the way the form of the trajectory was modelled.
There are several limitations. Although we adjusted for a range of confounders, residual or unmeasured confounding is likely. Random measurement error from misreporting of diet would lead to misclassification of NND adherence and may have biased the associations towards the null. However, the results could also be biased in the other direction through response bias of self-reported diet, weight and height among less healthy and more overweight groups. In addition, other aspects of life may have influenced the participants’ weight trajectories during the eight-year time span that were not accounted for in this study. For example, we only adjusted for pre-pregnancy physical activity at one time point; this is unlikely to fully capture an individual’s activity during pregnancy and beyond. The participation rate of around 40 % in the MoBa study could be a concern regarding generalisability. MoBa participants have been shown to be older, more often co-habiting, highly educated, non-immigrant, non-smoking and parous compared with the general pregnant population in Norway( Reference Nilsen, Vollset and Gjessing 28 ). Nilsen et al.( Reference Nilsen, Vollset and Gjessing 28 ) previously documented biased prevalence data for some pregnancy conditions in the MoBa cohort, but documented in the paper unbiased diet–outcome associations. This documented self-selection could imply a healthier study sample with potentially less variation in post-partum weight development, as well as less variation in the diet than in the background population. The way we have internally constructed the NND score could make it difficult to reproduce findings in other cohorts, because the cut-offs for scoring are sample-specific. Last, NND adherence was assessed in mid-pregnancy in this study, but most likely reflects longer-term pre-conception diet as well, as dietary patterns tend to track( Reference Lien, Lytle and Klepp 44 ). Future studies should include prospective dietary information assessed before pregnancy to reveal potential time-associated vulnerability during adolescence, pre-conception, pregnancy or post-partum regarding the association between diet quality and long-term weight development.
In conclusion, our findings suggest that the NND may have beneficial properties to long-term weight regulation among women post-partum. To understand whether it is a useful target for public health intervention, further research is needed to understand the correlates of this dietary pattern and the mechanisms that may underlie the associations reported here.
Acknowledgements
The authors are grateful to all the participating families in Norway who take part in this on-going cohort study.
The Norwegian Mother and Child Cohort Study are supported by the Norwegian Ministry of Health and Care Services and the Ministry of Education and Research, National Institutes of Health (NIH)/National Institute of Environmental Health Sciences (NIEHS) (contract no. N01-ES-75558), NIH/NINDS (grant no. 1 UO1 NS 047537-01 and grant no. 2 UO1 NS 047537-06A1). The present study was funded by the University of Agder, Norway. None of the funders had any role in the design, analysis or writing of this article.
E. R. H., E. B. and N. C. Ø. conceived the project and designed the present study; A. L. B. was involved in the development and calculations of the MoBa FFQ; E. R. H., M. S. and N. C. Ø. prepared the data set; A. K. W. designed and performed all statistical analyses and drafted the results. M. S. and N. C. Ø. drafted the rest of the manuscript. All authors read and approved the final version.
The authors declare that there are no conflicts of interest.
Supplementary material
For supplementary material/s referred to in this article, please visit https://doi.org/10.1017/S0007114518000776


