


Restriction of dietary protein intake has been reported to decrease urinary protein excretion and protect renal function in uraemic patients, and therefore it is one of the major treatment strategies for chronic kidney diseases (CKD)( Reference Kopple 1 , Reference Beto and Bansal 2 ). It was once believed that such protective effects were produced by haemodynamic changes( Reference Tilton, Pugliese and Chang 3 – Reference Brenner, Meyer and Hostetter 5 ). However, further investigations showed that a low-protein diet (LPD) also has several non-haemodynamic protective effects, such as ameliorating oxidative stress, balancing protein metabolism, decreasing the expression of growth factors, preventing metabolic acidosis and reducing inflammation( Reference Peuchant, Delmas-Beauvieux and Dubourg 6 – Reference Wang and Mitch 8 ). Furthermore, accumulating evidence has shown that reno-protective effects of LPD are also associated with the inhibition of intrarenal renin–angiotensin system (RAS).
Inappropriate activation of the intrarenal RAS is becoming increasingly important in the pathogenesis of renal injury than systemic RAS( Reference Kobori, Nangaku and Navar 9 ). All of the RAS components are found in the kidney. Angiotensin II (AngII) concentrations within the kidney are 1000-fold higher than those in circulating blood, providing evidence for the functional importance of locally generated AngII( Reference Kim and Iwao 10 , Reference Schalekamp and Danser 11 ). In this way, the activation of intrarenal RAS is a key factor in CKD progression.
Several studies have investigated the relationship between different amounts of dietary protein and the activation of intrarenal RAS. Rosenberg et al.( Reference Rosenberg, Chmielewski and Hostetter 12 ) found renal renin mRNA levels to be higher in male rats fed a 50 % protein diet than in those fed a 20 % protein diet and lower in male rats fed a 6 % protein diet. Arimura et al.( Reference Arimura, Horiuchi and Kawaguchi 13 ) reported mRNA levels of angiotensinogen and renin to be lower in mice fed an 18 % protein diet than in those fed a 24 % protein diet. Correa-Rotter et al.( Reference Correa-Rotter, Hostetter and Rosenberg 14 ) reported renal renin mRNA levels to be higher in CKD rats fed a 40 % protein diet than in those fed a 6 % protein diet. These studies indicated that high protein intake was linked to increased renin expression in normal rats, as well as in CKD rats. However, most of these investigations have focused only on local renin and angiotensinogen expression and may have overlooked the results of local AngII and AngII receptor expression. Furthermore, these studies failed to explore the possible mechanisms underlying the interaction between different protein intakes and intrarenal RAS.
It is well known that AngII contributes to proteinuria through Ang type 1 receptor (AT1R) activation, and AT1R blockade can ameliorate proteinuria in human CKD patients and CKD animals( Reference Galle 15 , Reference Rodriguez-Iturbe, Sato and Quiroz 16 ). It has also been reported that LPD combined with losartan, an AT1R blocker, has additive effects on retarding renal deterioration in CKD rats by further reducing the concentration of transforming growth factor-β1 (TGF-β1)( Reference Peters, Border and Noble 17 ). In this way, the association between anti-proteinuria and anti-fibrotic effects of LPD and AT1R blockade and whether they had any synergetic effects merit further exploration.
Ketoacids (KA), keto-analogues of essential amino acids, have been prescribed alongside LPD to patients with CKD( Reference Aparicio, Bellizzi and Chauveau 18 ). Low-protein diet plus ketoacids (LPD+KA) has more pronounced beneficial effects than LPD alone with respect to impeding the progression of CKD and retarding the initiation of kidney replacement therapy( Reference Aparicio, Bellizzi and Chauveau 19 , Reference Chang, Kim and Park 20 ). However, the extra reno-protective effects of KA remain unclear. The association between KA and intrarenal RAS is also unclear.
Here it is hypothesised that the reno-protective effects of ameliorating proteinuria associated with LPD+KA treatment might be related to the direct inhibition of intrarenal RAS, in addition to the changes in renal haemodynamics. An in vivo experiment was designed here to evaluate the effects of LPD+KA on intrarenal RAS in 3/4 nephrectomised rats and another in vitro experiment was designed to investigate the direct impact of LPD+KA on RAS in mesangial cells with and without AT1R blockade. Proteomics and biochemical detection were performed to evaluate the possible mechanisms underlying these beneficial effects of LPD+KA.
Methods
Animals
The experimental protocol was approved by the Animal Study Committee at Fudan University. Here, 3/4 nephrectomy was performed on 200–250-g male Sprague–Dawley rats (Laboratory Animal Institute of Fudan University), as reported previously( Reference Nath, Hostetter and Hostetter 21 ). Animals were placed on normal-protein diet (NPD) (18 %, Nx-NPD, n 10), LPD (6 %, Nx-LPD, n 10) and LPD (5 %)+KA (1 %) (Nx-LPD+KA, n 10) 1 week after 3/4 nephrectomy surgery. The ten male Sprague–Dawley sham-operated rats fed NPD served as control. All the three diets were modified from AIN-93 (American Institute of Nutrition Rodent Diets), and contained the same energy content (14·6 kJ (3·5 kcal/g)), vitamins and minerals (Table 1). KA (compound α-ketoacid) was provided by Fresenius-Kabi. The active ingredients of KA were l-lysine monoacetate 105 mg, ketoanalogue α-leucine 101 mg, ketoanalogue α-valine 86 mg, α-phenylalanine ketoanalogue 68 mg, α-isoleucine ketoanalogue 67 mg, α-hydroxy analogue of methionine 59 mg, l-threonine 53 mg, l-histidine 38 mg, l-tyrosine 30 mg and l-tryptophan 23 mg. Animals were permitted free access to food and water and were housed in metabolic cages for 24 h of urine collection every 4 weeks. After 12 weeks of feeding, the rats were killed and the blood samples were obtained for biochemistry detection. The cortex of kidney was immediately removed and prepared for histological, protein and mRNA analysis. For RIA and ELISA analysis, a portion of the renal cortex tissues was homogenised (on ice) in the buffer containing 0·1 m-phosphate and 10 μm-indomethacin at pH 7·4. The resulting homogenate was centrifuged for 30 min at 4000 rpm at 4°C. The supernatant was aspirated into polypropylene test tubes and stored at −70°C.
Table 1 The composition of different protein diets
NPD, normal-protein diet; LPD, low-protein diet; LPD+KA, low-protein diet plus ketoacids.
Culture of renal mesangial cells
Conditionally immortalised mouse glomerular mesangial cells were provided by Vanderbilt University Medical Center( Reference Pozzi, Zent and Chetyrkin 22 ). They were cultured in Dulbecco’s Modified Eagle Medium (DMEM) supplemented with 10 % (v/v) fetal bovine serum (FBS) (GIBCO), penicillin (100 U/ml) and streptomycin (100 μg/ml). Cultures were incubated at 33°C in 95 %O2/5 %CO2 with 100 U/ml interferon-γ for proliferation and 37°C in 95 % O2/5 % CO2 for intervention. After serum starvation for 12 h, cells were treated with DMEM supplemented with FBS as control and various kinds of serum (100 μl/ml) obtained from animal experiments with or without losartan (0·02 mm) for 48 h. The supernatant and cell pellets were collected through centrifugation at 3000 rpm for 10 min and stored at −70°C.
Laboratory measurements
The levels of serum albumin, total protein, serum creatinine and blood urea nitrogen, TAG, total cholesterol, LDL, HDL, fasting blood glucose, insulin and homoeostasis model assessment of insulin resistance (HOMA-IR) were determined by automatic clinical chemistry analyzer (Modular Corporation). Coomassie Blue G-250 (Nanjing Jiancheng Bioengineering Institute) was used to detect 24-h proteinuria in the rats. The levels of malondialdehyde (MDA), protein carbonylation, GSH peroxidase (GSH-PX) and superoxide dismutase (SOD) in serum were detected using oxidative stress detection kits (Nanjing Jiancheng Bioengineering Institute).
Levels of AngII in the renal cortex were detected using RIA kits (provided by Shanghai Chinese Traditional Medical University). ELISA kits (R&D Systems) were used to measure the levels of AngII in serum and supernatant of cultured cells. All of the samples for measuring AngII were pre-treated by passing them through a Centricon-10 column with a cut-off of >10 000 Da (Amicon; EMD Millipore). The amount of fibronectin (FN) and TGF-β1 released in the cell culture medium was also detected using ELISA kits.
Real-time PCR
Total RNA was extracted from freshly removed cortex of rat kidney and cultured mesangial cells using Trizol® Reagent (Invitrogen). The reverse transcription system included the following: RNA template 5 μg, Oligo dT 1 μl, dNTP 2 μl, Moloney murine leukaemia virus reverse transcriptase (MMLV) 5× buffer 4 μl, RNA inhibitor 1 μl, MMLV 1 μl and diethyl pyrocarbonate H2O.6 μl (First-strand cDNA Synthesis Kit; Fermentas). The fluorescence quantification PCR system included the following: SYBR Premix Ex Taq, 25 μl; Primer F, 1·0 μl (0·2 μm); Primer R, 1·0 μl (0·2 μm); ROX Reference Dye, 1·0 μl; DNA template, 4·0 μl; and dH2O.18·0 μl with a sum volume of 50·0 μl (SYBR Premix Ex Taq kit; TaKaRa). PCR reaction was carried out at 95°C for 3 s and at 60°C for 30 s for forty cycles (7500 Fast Real-Time RCR System; Applied Biosystems). The primers and renin probe used in the rat model were as follows – forward primer: 5'-ACC CTC CCC GAC ATC TCC TT-3', reverse primer: 5'-AGA ACT TGC GGA TGA AGG TGG-3', probe: 5'-TGG GAG GCA GGA CCT ACA CTC TCA GCA-3'. Primers and probe for AT1R were as follows – forward primer: 5'-TGG ATT TCG AAT AGT GTC TGA GAC C-3', reverse primer: 5'-AGA TGA TGC TGT AGA GGG TAG GGA T-3', probe: 5'-TCA ACC CAG AAA AAC AAA ATG GCC C-3'. For cultured mouse mesangial cells, primers for FN were as follows – forward primer: 5'-CCA GGT TGA TGA TAC TTC CAT TGT T-3', reverse primer: 5'-GCT CTG TGC TAC TGC CTT CTA CTG-3'. Primers for TGF-β1 were as follows – forward primer: 5'-TCC AAA CTA AGG CTC GCC AGT CC-3', reverse primer: 5'-TGT TGC GGT CCA CCA TTA GCA C-3'. Primers for AT1R were as follows – forward primer: 5'-CAA AGG CCA AGT CGC ACT CA-3', reverse primer: 5'-GAT GCT GCC CTG GTT TCT GT-3'.
Experimental cycle threshold (C
t
) values were normalised to glyceraldehyde-3-phosphate dehydrogenase (Fermentas) measured on the same plate, and the relative levels of gene expression were determined using the
 $$2^{{{\minus}\Delta \Delta C_{t} }} $$
method.
$$2^{{{\minus}\Delta \Delta C_{t} }} $$
method.
Immunoblotting
Freshly removed cortex from rat kidneys were homogenised and extracted in lysis buffer containing 150 mm-NaCI, 100 mm TRIS buffered saline (pH 8·0), 1 % Tween 20, 50 mm-diethyl dithio carbamate, 1 mm-EDTA, 1 mm-phenylmethylsulfonyl fluoride, 10 μg/ml leupeptin, 10 μg/ml aprotinin, 10 μg/ml trypsin inhibitor and 10 μg/ml pepstatin. Protein concentration was determined using bicinchoninic acid protein assay (Sigma). A measure of 20 μg of protein extract was separated on a 12 % SDS-PAGE gel. Protein was transferred to a polyvinylidene difluoride membrane at 22 V overnight at 4°C. The membrane was washed three times with Tris-buffered saline with Tween (50 mm TRIS (pH 7·5), 150 mm-NaCl and 0·05 % Tween 20) and then incubated in blocking buffer (150 mm-NaCl, 50 mm-TRIS, 0·05 % Tween20 and 5 % Carnation nonfat dry milk (pH 7·5)) for 1 h at room temperature. The membrane then was incubated with antibodies raised against TGF-β1 (1:100; Santa Cruz Biotechnology Inc.), renin (1:600; Professor Inagaki, Vanderbilt University), AT1R (1:200; Santa Cruz Biotechnology Inc.) and β-actin (1:2000; Sigma) overnight at 4°C. After three washes, the membrane was incubated with a horseradish-peroxidase-conjugated secondary antibody (1:10 000; Jackson Immuno Research Laboratories) for 1 h at room temperature followed by three 15-min washings. Antibody labelling was visualised using ECL (Amersham Biosciences).
Proteomics
Quantitative serum proteomics using isobaric tags for relative and absolute quantification (iTRAQ) was used to assess the up- and down-regulation induced by different protein intakes in nephrectomised rats, with detailed protocol described in previous works( Reference Tonack, Aspinall-O’Dea and Jenkins 23 ).
Statistics
All values were described as means with their standard errors. One-way ANOVA was used for analysis of difference between groups by SPSS statistic 11. Statistical significance was considered at P<0·05.
Results
Animal studies
The body weights of Nx-NPD, Nx-LPD and Nx-LPD+KA rats were lower than those of sham-operated rats but without statistically significance. Furthermore, there was no significant difference between body weights of Nx-NPD, Nx-LPD and Nx-LPD+KA rats. Other nutritional indices such as serum albumin and total protein were comparable in each group (Table 2).
Table 2 The general condition and 24-h proteinuria of 3/4 nephrectomised rats fed different protein diets for 12 weeks (Mean values with their standard errors)
Nx-NPD, 18 % normal-protein diet; Nx-LPD, 6 % low-protein diet; Nx-LPD+KA, 5 % low-protein diet plus 1 % ketoacids; TP, total protein; Alb, albumin; Scr, serum creatinine; BUN, blood urea nitrogen.
a P<0·05 v. sham group, b P<0·05 v. Nx-NPD group, c P<0·05 v. Nx-LPD group.
The levels of serum creatinine and blood urea nitrogen in 3/4 nephrectomised groups were significantly higher than those in the sham group. Restriction of protein intake prominently reduced blood urea nitrogen levels in nephrectomised rats but had little impact on serum creatinine. The effect was retained in animals fed LPD+KA (Table 2).
There was significantly more urinary protein excretion in the Nx-NPD group than in the sham group. LPD decreased the urinary protein excretion and LPD+KA had more pronounced effects than LPD (Table 2).
The renal cortex expression of TGF-β1 was significantly higher in nephrectomised rats than in the sham group. LPD and LPD+KA significantly reduced protein levels of TGF-β1, and the level of TGF-β1 in the Nx-LPD+KA group was markedly lower than in the Nx-LPD group (Fig. 1(A) and (B)).
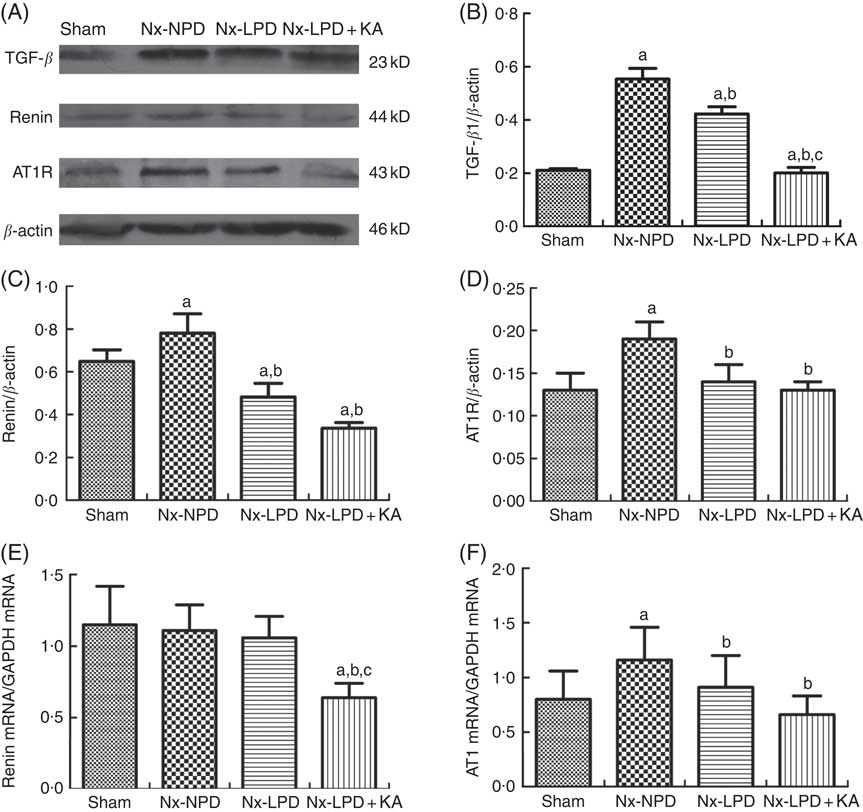
Fig. 1 Transforming growth factor-β1 (TGF-β1), renin and Ang type 1 receptor (AT1R) expression in kidney of sham-operated and 3/4 nephrectomised rats. (A–D) Immunoblot of TGF-β1, renin and AT1R in the renal cortex. (E) Real-time PCR analysis of renin mRNA in the renal cortex. (F) Real-time PCR analysis of AT1R mRNA in the renal cortex. Renal TGF-β1 protein and AT1R protein and mRNA levels were significantly higher in nephrectomised rats than in the sham group. Low-protein diet (LPD) and LPD supplemented with ketoacids (LPD+KA) significantly inhibited these abnormalities. Renin protein levels were higher in the 18 % normal protein diet (Nx-NPD) group than in the sham group, but no significant difference in mRNA levels was observed. LPD significantly reduced the protein levels of renin, and LPD+KA reduced both protein and mRNA levels in the renal cortex of 3/4 nephrectomised rats. n 10 in each group. a P<0·05 v. sham group, b P<0·05 v. Nx-NPD group, c P<0·05 v. Nx-LPD group. Nx-LPD, 6 % low-protein diet; GAPDH, glyceraldehyde-3-phosphate dehydrogenase.
Immunoblot showed renin protein levels in the renal cortex to be markedly higher in the Nx-NPD group than in the sham group. Those in the Nx-LPD and Nx-LPD+KA groups were markedly lower than in the Nx-NPD group (Fig. 1(A) and (C)). Real-time PCR showed little difference of renin mRNA in the renal cortex among the sham, Nx-NPD and Nx-LPD groups. However, the Nx-LPD+KA group had significantly less renin mRNA (Fig. 1(E)).
The levels of protein and mRNA of AT1R in the renal cortex of Nx-NPD were 1·46- and 1·45-fold higher than in the sham group, respectively (P<0·05). Treatment with LPD and LPD+KA for 3 months significantly attenuated these changes, bringing levels nearly down to the control levels. However, there was no difference between LPD and LPD+KA (Fig. 1(A), (D) and (F)).
Systemic levels of AngII were significantly higher in Nx-NPD rats than in sham-operated rats, but those in the Nx-LPD and Nx-LPD+KA groups showed no great difference compared with those in the Nx-NPD group (Fig. 2(A)). By contrast, renal cortex levels of AngII levels were significantly higher in Nx-NPD rats than in sham-operated rats. LPD and LPD+KA greatly decreased the level of AngII in the renal cortex (Fig. 2(B)).
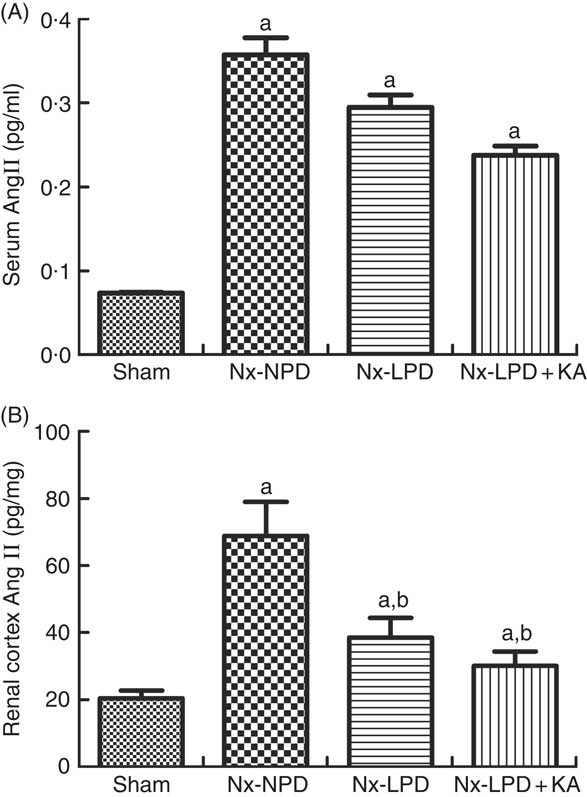
Fig. 2 Angiotensin (Ang) II levels in the serum and renal cortex of sham-operated and 3/4 nephrectomised rats. (A) Serum AngII levels, determined by ELISA kit, were markedly higher in nephrectomised rats. No difference was observed between three nephrectomised groups treated with different protein diets (P>0·05). (B) Renal cortex AngII levels, determined by RIA, were markedly higher in nephrectomised rats. Low-protein diet (LPD) and low-protein diet supplemented with ketoacids (LPD+KA) significantly reduced the AngII level in the kidney. n 10 in each group. a P<0·05 v. sham group, b P<0·05 v. Nx-NPD group. Nx-NPD, 18 % normal protein diet.
In vitro studies in mesangial cells
To determine whether the different levels of protein intake had any direct, non-haemodynamic impact on intrarenal RAS, the cultured mouse mesangial cells were treated with various kinds of serum (100 μl/ml) from different animal groups for 48 h.
As the serum concentrations of AngII in nephrectomised rats were much higher than those of sham-operated rats (Fig. 2(A)), the baseline supernatant levels of AngII were also higher in the cultured cells treated with serum from nephrectomised rats than in the sham-serum-treated group, but no significant difference was found among three groups treated with serum from Nx-NPD, Nx-LPD and Nx-LPD+KA rats (Fig. 3(A)). After 48 h of cultivation, AngII levels were still higher in the Nx-NPD and Nx-LPD groups than in the sham group, and there was no significant difference between these two groups. However, the level was considerably lower in the Nx-LPD+KA group than in the Nx-NPD and Nx-LPD groups (Fig. 3(B)).
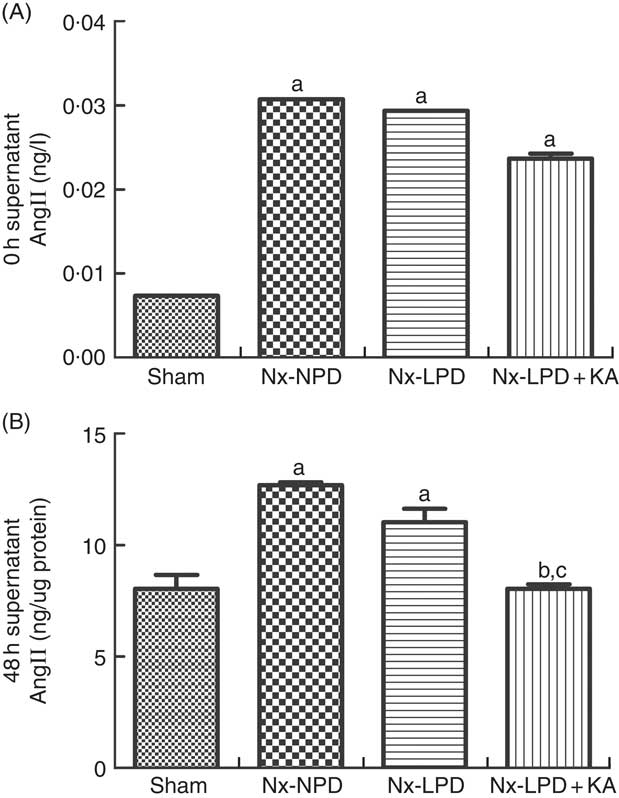
Fig. 3 Supernatant angiotensin (Ang) II levels of mesangial cells cultivated with serum from different rats at 0 and 48 h. The supernatant levels of AngII were higher in the 18 % normal protein diet (Nx-NPD), 6 % low-protein diet (Nx-LPD) and 5 % low-protein diet plus 1 % ketoacids (Nx-LPD+KA) groups than in the sham group at 0 h, whereas there was no significant difference between Nx-NPD, Nx-LPD and Nx-LPD+KA groups (A). After 48 h of cultivation of the mesangial cells, there was no significant difference of AngII level between Nx-NPD and Nx-LPD, but AngII level was markedly lower in the Nx-LPD+KA group than in the Nx-NPD and Nx-LPD groups (B). n 10 in each group. a P<0·05 v. sham group, b P<0·05 v. Nx-NPD group, c P<0·05 v. Nx-LPD group.
In addition, the Nx-NPD group had higher levels of AT1R protein and mRNA than the sham group (P<0·005). Nx-LPD serum significantly reduced the over-production of AT1R protein and mRNA levels and LPD+KA was associated with less expression of AT1R than LPD (Fig. 4).
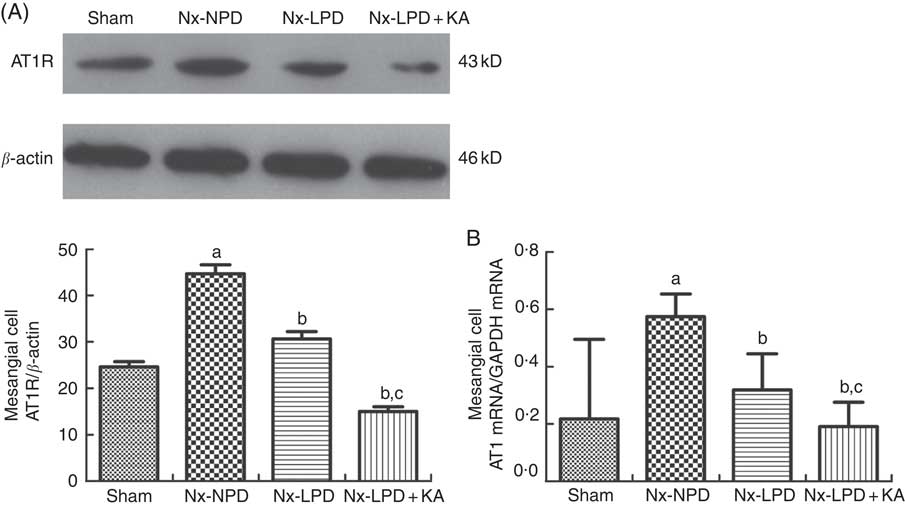
Fig. 4 Ang type 1 receptor (AT1R) expression in cultured mesangial cells with serum from different rats. Western blot analysis (A) and real-time PCR (B) showed that AT1R in mesangial cells were greatly higher in the 18 % normal protein diet (Nx-NPD) group than in the sham group, and were lower in the 6 % low-protein diet (Nx-LPD) and 5 % low-protein diet plus 1 % ketoacids (Nx-LPD+KA) groups than in the Nx-NPD group. Low-protein diet supplemented with ketoacids (LPD+KA) further reduced the expression of AT1R compared with low-protein diet (LPD). n 10 in each group. a P<0·05 v. sham group, b P<0·05 v. Nx-NPD group, c P<0·05 v. Nx-LPD group.
ELISA and real-time PCR indicated higher supernatant levels and mRNA synthesis of FN and TGF-β1 in the cells stimulated with Nx-NPD serum than in the sham-serum-treated group (P<0·05). Nx-LPD and Nx-LPD+KA serum significantly reduced the supernatant and mRNA levels of FN and TGF-β1. LPD+KA, compared with LPD, further reduced the mRNA level of TGF-β1 (Fig. 5). To investigate the mechanisms by which LPD and LPD+KA decreased FN and TGF-β1, losartan (an AT1R blocker) was added to the cell cultural medium to show the differences in FN and TGF-β1 production. The supernatant and mRNA levels of FN and TGF-β1 in the Nx-NPD, Nx-LPD and Nx-LPD+KA groups were much lower (almost to normal) after losartan supplementation, and little difference was observed in the sham group before and after losartan treatment (Fig. 5).
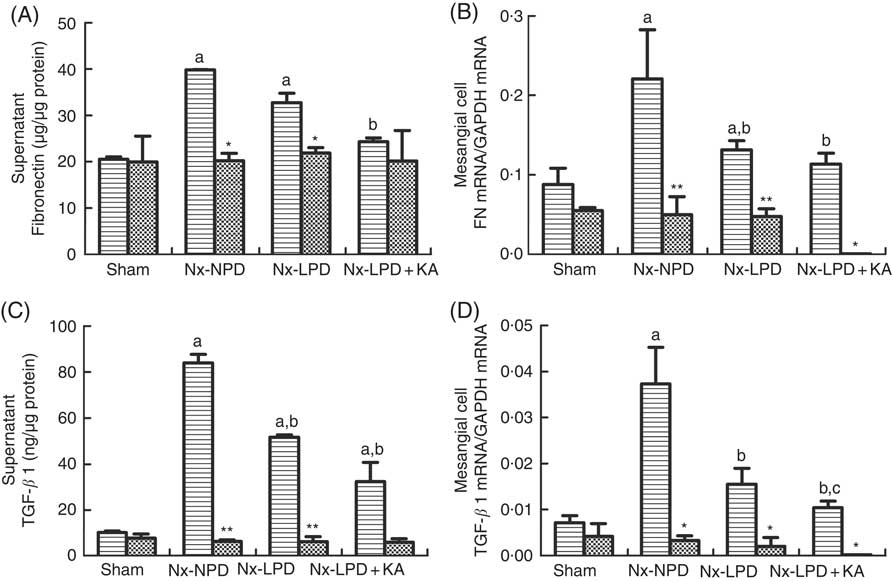
Fig. 5 Fibronectin (FN) and transforming growth factor-β1 (TGF-β1) secretion and gene expression in cultured mesangial cells treated with serum from different rats with or without losartan (LOS). (A) Supernatant levels of FN detected by ELISA kits. (B) Real-time PCR analysis for FN mRNA in cultured mesangial cells. (C) Supernatant levels of TGF-β1 detected by ELISA kits. (D) Real-time PCR analysis for TGF-β1 mRNA in cultured mesangial cells. 18 % normal protein diet (Nx-NPD) serum elevated the supernatant level and mRNA of FN and TGF-β1 in cultured cells compared with those in the sham-serum-treated group. 6 % low-protein diet (Nx-LPD) and 5 % low-protein diet plus 1 % ketoacids (Nx-LPD+KA) serum significantly reduced the supernatant and mRNA levels of FN and TGF-β1 compared with the Nx-NPD group. The levels of FN and TGF-β1 were greatly lower (almost to normal) after LOS supplementation in the Nx-NPD, Nx-LPD and Nx-LPD+KA groups, whereas little differences were found in the sham group before and after LOS treatment. n 10 in each group. a
P<0·05 v. sham group, b
P<0·05 v. Nx-NPD group, c
P<0·05 v. Nx-LPD group. * P<0·05 v. LOS (–), ** P<0·01 v. LOS (–). GAPDH, glyceraldehyde-3-phosphate dehydrogenase. ![]() , LOS (+);
, LOS (+); ![]() , LOS (–).
, LOS (–).
Proteomics and biochemical detection
As the serum from nephrectomised rats fed NPD could directly activate the RAS in mesangial cells, there might have been some effectors in the serum associated with the local RAS activation. Therefore, proteomics was used to screen the differentially expressed proteins in the serum from each group of rats.
Here, 328 proteins were analysed, and in sum thirty-seven proteins (11 % of all proteins) changed quantity. Among the thirty-seven proteins, the levels of 15 (41 %) showed a statistically significant difference between sham-operated rats and nephrectomised rats fed different protein diets. These fifteen proteins were mainly involved in the physiological functions such as nutritional metabolism, oxidative stress and extracellular matrix synthesis (Table 3).
Table 3 Proteins with statistical change (n 15) in proteomic analysis of serum from each group of ratsFootnote * (Numbers and percentages)

HBA1, Hb subunit α; TF, serotransferrin precursor; SRRM2, isoform 1 of serine/arginine repetitive matrix protein 2; PTPRB, protein tyrosine phosphatase, receptor type B; ALB, isoform 1 of serum albumin precursor; FASN, fatty acid synthase; APOE, apo E precursor; CES1, isoform 2 of liver carboxylesterase 1 precursor; IGFALS, insulin-like growth factor-binding protein complex acid labile chain precursor; AHSG, α-2-HS-glycoprotein precursor; NOS2A, isoform 1 of nitric oxide synthase, inducible; GPX3, glutathione peroxidase 3 precursor; COL1A1, collagen α; FN1, fibronectin 1; LAMB3, laminin subunit β-3 precursor; iTRAQ, isobaric tags for relative and absolute quantification.
* Totally, 328 proteins in serum were analysed by iTRAQ methods, in which thirty-seven proteins changed, accounting for 11 % of total proteins. Furthermore, fifteen proteins (41 %) have statistical difference between each group.
To confirm the results of proteomics, the animals were subjected to biochemical detection. Regarding carbohydrate metabolism, we found that with a comparable level of fasting blood glucose the secretion of insulin and HOMA-IR was greatly increased in 3/4 nephrectomised rats and LPD partially reduced the degree of insulin resistance. LPD+KA had further beneficial effects on reducing insulin and HOMA-IR compared with LPD (Table 4). Regarding lipid metabolism, the levels of TAG, total cholesterol and LDL were higher in 3/4 nephrectomised rats than in the sham group. LPD had no significant effects on reducing these levels, but LPD+KA markedly reduced the levels of TAG and total cholesterol. There was no difference in high-density lipoprotein levels among these four groups (Table 4). Regarding amino acid metabolism, serum levels of tryptophan, valine and isoleucine were measured, and no difference was found between these four groups (Table 4). Regarding oxidative stress, the levels of MDA in serum and renal cortex and the level of protein carbonylation in serum were higher in 3/4 nephrectomised rats than in the sham group. The levels of antioxidant enzymes such as GSH-PX and SOD were lower in the serum and renal cortex of 3/4 nephrectomised rats than in the sham group. LPD and LPD+KA greatly ameliorated the changes, compared with NPD. LPD+KA also had better effects than LPD alone on the MDA, SOD and GSH-PX levels (Fig. 6 and 7).
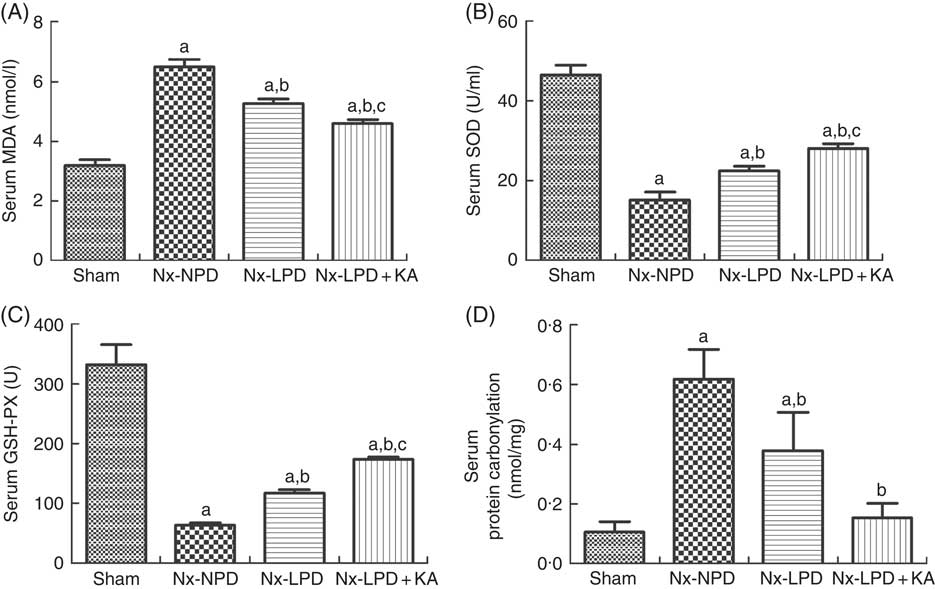
Fig. 6 Oxidative stress in the serum of sham-operated and 3/4 nephrectomised rats. (A) Malondialdehyde (MDA) levels in the serum. (B) Superoxide dismutase (SOD) levels in the serum. (C) GSH peroxidase (GSH-PX) levels in the serum. (D) Protein carbonylation levels in the serum. The levels of MDA and protein carbonylation were higher and the levels of GSH-PX and SOD were lower in the serum of the 18 % normal protein diet (Nx-NPD) group compared with the sham group. Low-protein diet (LPD) and low-protein diet plus ketoacids (LPD+KA) significantly inhibited these abnormalities. Furthermore, LPD+KA also had better effects than LPD alone on the MDA, SOD and GSH-PX levels. n 10 in each group. a P<0·05 v. sham group, b P<0·05 v. Nx-NPD group, c P<0·05 v. Nx-LPD group. Nx-LPD, 6 % low-protein diet; Nx-LPD+KA, 5 % low-protein diet plus 1 % ketoacids.
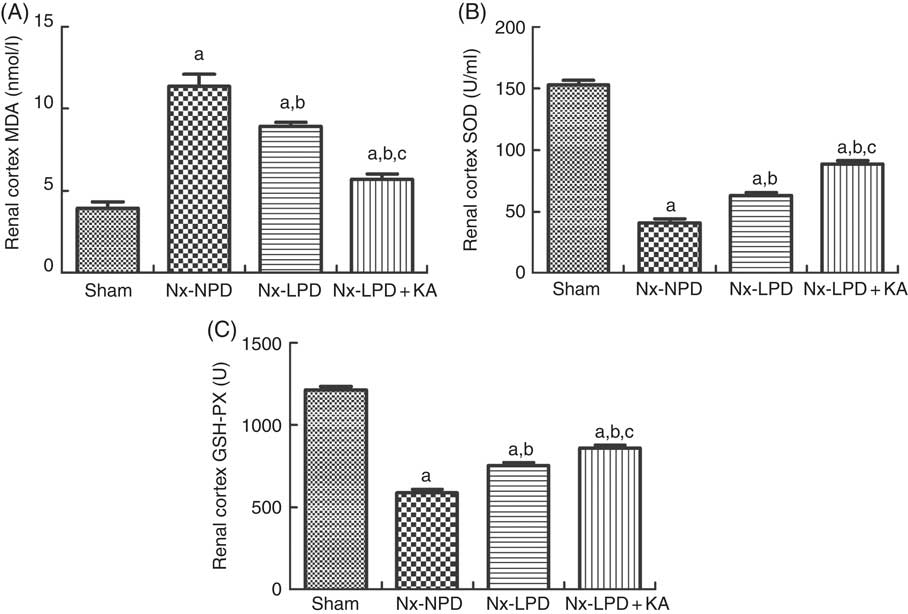
Fig. 7 Oxidative stress in the renal cortex of sham-operated and 3/4 nephrectomised rats. (A) Malondialdehyde (MDA) levels in the renal cortex. (B) Superoxide dismutase (SOD) levels in the renal cortex. (C) GSH peroxidase (GSH-PX) levels in the renal cortex. The levels of MDA and protein carbonylation were higher and the levels of GSH-PX and SOD were lower in the renal cortex of 18 % normal protein diet (Nx-NPD) group than in the sham group. Low-protein diet (LPD) and low-protein diet plus ketoacids (LPD+KA) significantly inhibited these abnormalities. Furthermore, LPD+KA also had better effects than LPD alone on the MDA, SOD and GSH-PX levels. n 10 in each group. a P<0·05 v. sham group, b P<0·05v. Nx-NPD group, c P<0·05 v. Nx-LPD group. Nx-LPD, 6 % low-protein diet.
Table 4 The nutritional metabolism in sham-operated and nephrectomised rats fed different protein diets for 12 weeks (Mean values with their standard errors)

Nx-NPD, 18 % normal-protein diet; Nx-LPD, 6 % low-protein diet; Nx-LPD+KA, 5 % low-protein diet plus 1 % ketoacids; FBG, fast blood glucose; HOMA-IR, homoeostasis model assessment of insulin resistance; TC, total cholesterol.
a P<0·05 v. sham group, b P<0·05v. Nx-NPD group, c P<0·05 v. Nx-LPD group.
Discussion
The present study has demonstrated that LPD+KA could significantly inhibit intrarenal RAS activation, attenuating the proteinuria in CKD rats. Mesangial cells were treated with serum derived from each of the experimental groups, and results showed that the serum from 3/4 nephrectomised rats fed NPD directly induced higher expression of AngII, AT1R, FN and TGF-β1 in the mesangial cells than that of sham-operated rats fed NPD. Serum from 3/4 nephrectomised rats fed LPD+KA significantly inhibited these abnormalities. Proteomics and biochemical detection suggested that direct inhibition of intrarenal RAS by LPD+KA, independently of renal haemodynamics, might be associated with improvement of nutritional metabolic disorders and oxidative stress in CKD rats.
In 1980s, LPD was found to slow the progression of experimental CKD( Reference Brenner, Meyer and Hostetter 5 ). Since then, the reno-protective effects of LPD have been verified through clinical trials and animal studies( Reference Griffin, Picken and Giobbie-Hurder 24 – Reference Pedrini, Levey and Lau 26 ). LPD has been found to reduce 24-h proteinuria, ameliorate glomerular sclerosis, suppress TGF-β1 expression and maintain nutritional status, which were consistent with the current findings. Our results also showed that LPD brought blood urea nitrogen levels down well below NPD but with slight changes in serum creatinine level, consistent with previous reports( Reference Wang and Mitch 8 , Reference Chauveau, Combe and Rigalleau 27 ). To some degree, this indicates the retardation, but not reversal, of renal function in CKD by dietary intervention.
Haemodynamic changes are believed to play an important role in the reno-protective effects of protein restriction( Reference Neuringer and Brenner 4 , Reference Brenner, Meyer and Hostetter 5 , Reference Heidland, Sebekova and Ling 7 ). However, the reno-protective effects extend far beyond such haemodynamic benefits. Further investigation has indicated the possible non-haemodynamic mechanisms of reno-protection through LPD( Reference Peuchant, Delmas-Beauvieux and Dubourg 6 , Reference Heidland, Sebekova and Ling 7 , Reference Narita, Border and Ketteler 28 ). The present work reports the excessive oxidative stress and insulin resistance in renal ablated rats fed NPD, which were found to be ameliorated by LPD and LPD+KA. Interestingly, the additional non-haemodynamic action in improving lipid disorders was only detected in the Nx-LPD+KA group, not in the Nx-LPD group, suggesting that KA might have a direct impact on lipid profiles, as previously reported in clinical trials( Reference Teplan, Schuck and Knotek 29 , Reference Di Iorio, Minutolo and De Nicola 30 ).
Furthermore, the association between dietary protein intake and intrarenal RAS in normal and CKD rats has been addressed in the recent years( Reference Rosenberg, Chmielewski and Hostetter 12 – Reference Correa-Rotter, Hostetter and Rosenberg 14 , Reference Cartwright and Jaenke 31 ). In the present study, a comprehensive observation of systemic and intrarenal RAS was carried out in 3/4 nephrectomised rats fed different amounts of protein. The results showed that NPD not only increased the humoral AngII levels in nephrectomised rats but also up-regulated the expression of renin protein, AngII and AT1R in the kidney, indicating local over-activation of RAS. Although restricted protein intake did not reduce the AngII levels in the circulation, both LPD and LPD+KA mitigated the changes of renin and its down-stream AngII synthesis and AT1R expression in the kidney. Therefore, the reno-protective effects of LPD and LPD+KA were partly because of its down-regulation of intrarenal RAS.
The mechanisms by which LPD inhibits renin protein remain speculative. Some studies demonstrated that LPD resulted in a decrease in the production of PG in the kidney and inhibition of Na re-absorption in the loop of Henle, which then increases Na delivery to the macula densa, which may modulate the release of renin in nephrectomised rats( Reference Rosenberg, Chmielewski and Hostetter 12 , Reference Schweda and Kurtz 32 ). The decrease in renin protein contributed to the reduced intrarenal levels of AngII. Low AngII levels may up-regulate the expression of glomerular AT1R expression( Reference Kobori, Nangaku and Navar 9 ). However, in the present study the expression of AT1R in the renal cortex was inhibited in both Nx-LPD and Nx-LPD+KA rats, accompanied by reduced intrarenal AngII levels, suggesting that other mechanisms might be involved in the regulation of AT1R in the renal cortex.
To explore whether LPD and LPD+KA had any direct effects, in addition to the changes of haemodynamics, on intrarenal RAS activation in CKD rats and to identify the underlying mechanisms, the mesangial cell, which plays a key role in the pathological changes that take place during glomerular sclerosis and responses to variable stimuli via local RAS, was selected for further experimentation in vitro ( Reference Ardaillou, Chansel and Stefanovic 33 , Reference Becker, Yasuda and Kondo 34 ). The serum samples derived from nephrectomised rats fed different dietary protein were added to the culture medium for the first time. The supernatant levels of AngII in 0-h culture medium of mesangial cells were measured, and no significant differences were observed between Nx-NPD, Nx-LPD and Nx-LPD+KA. In this way, the effects of original AngII from different sera of these groups on the expression of AT1R were excluded. Because, according to previous articles and reviews( Reference Xu, Miao and Cui 35 – Reference Nickenig and Harrison 40 ), there is no evidence that FN and TGF-β1 have any regulatory effects on AT1R expression in mesangial cells, the levels of FN and TGF-β1 in 0-h culture medium were not measured. As expected, Nx-NPD serum directly up-regulated AT1R expression accompanied by the enhanced productions of FN and TGF-β1, which are both well-recognised parameters associated with glomerular sclerosis( Reference Kagami, Border and Miller 41 ). Both Nx-LPD and Nx-LPD+KA serum reduced the expression of AT1R significantly, but LPD had no effects on the levels of AngII in the supernatant of mesangial cells, suggesting that non-haemodynamic effects of LPD on intrarenal RAS may be mediated by decreasing expression of AT1R. LPD+KA could decrease both of the AngII levels in the supernatant and AT1R in the mesangial cells. As shown here, because AngII contributes to proteinuria through AT1R activation, and because AT1R blockade can ameliorate proteinuria in human CKD patients and CKD animals( Reference Galle 15 , Reference Rodriguez-Iturbe, Sato and Quiroz 16 ), the effects of LPD and LPD+KA in reducing proteinuria are partly mediated by inhibiting AT1R in CKD rats. Meanwhile, the high expression levels of TGF-β1 and FN induced by Nx-NPD serum were reduced to control levels by losartan treatment, as in previous findings in animal studies( Reference Peters, Border and Noble 17 , Reference Cartwright and Jaenke 31 ). Nx-LPD and Nx-LPD+KA serum treatment had the same effects as losartan on TGF-β1 and FN in mesangial cells, further indicating that the changes of some components in the serum induced by dietary protein intake may have direct regulatory effects on the expression of AT1R in the kidney, and then participate in the pathogenesis of glomerular sclerosis.
The present proteomics analysis further revealed that the main changes in the circulation of nephrectomised rats caused by different protein diets involved proteins related to nutritional metabolism, oxidative stress and extracellular matrix synthesis. Some studies have demonstrated that elevated levels of amino acids or glucose, insulin, LDL, TNF-α and IL-1 could stimulate the expression of AT1R in the mesangial cells and vascular smooth muscle cells( Reference Xu, Miao and Cui 35 – Reference Nickenig and Harrison 40 ). Thus, different protein-diet-induced changes of some nutritional metabolites, especially insulin and lipid components confirmed by biochemical detection in this study, might have direct effects on the up-regulation of AT1R in the kidney. Moreover, the reactive oxygen species were found to be substantially enhanced in the circulation and renal cortex of nephrectomised rats fed NPD, whereas LPD and LPD+KA decreased the severity, consistent with the previous study( Reference Gao, Wu and Dong 42 ). The enhanced oxidative stress might directly activate intrarenal RAS and may exacerbate nutritional disorders or inflammatory status( Reference Nickenig and Harrison 39 , Reference Xue, Yuan and Ni 43 – Reference Sungkaworn, Lenbury and Chatsudthipong 45 ).
Our results demonstrated that the additional effects of KA supplementation of LPD were on the reduction of proteinuria, improvement of insulin and lipid metabolism, and amelioration of oxidative stress and glomerular sclerosis. This suggested that LPD+KA might have better effects on renal protection in nephrectomised rats than LPD alone( Reference Gao, Wu and Dong 42 ). Notably, this is the first report to show that KA had the effect beyond LPD with respect to inhibiting renin, AngII and AT1R expression in the kidney. Although the expression of AT1R in the renal cortex showed no difference between Nx-LPD and Nx-LPD+KA groups, in culture of renal mesangial cells the expression of AT1R induced by serum from Nx-LPD+KA group was lower than that in the Nx-LPD group. This discrepancy might be attributable to the fact that AT1R in different regions of the kidney had different susceptibilities to KA supplementation of LPD, and it merits further exploration. These anti-RAS effects of KA might have been caused by the more pronounced improvement in glucose and lipid metabolism in nephrectomised rats fed LPD+KA than in those fed LPD alone, but the direct effect of KA cannot be completely excluded and is worth further exploration.
In conclusion, LPD+KA was found to directly inhibit intrarenal RAS, independently of renal haemodynamics, attenuating the proteinuria in CKD rats, and the underlying mechanisms might be associated with the improvement of nutritional metabolism and oxidative stress.
Acknowledgements
None.
This work was supported by Major State Basic Research Development Program of China (973 program, no. 2012 CB517700) and Program of Shanghai Subject Chief Scientist (XBR2013080) to J. C. The funders had no role in the design, analysis or writing of this article.
J. C. and S.-y. L. designed the research; J.-y. Z. and Y. Y. wrote the manuscript and conducted the research; Q. L. conducted the research; L. N., L. Y. and Q. Z. analysed the data; and J. C. had primary responsibility for the final content. All authors read and approved the final manuscript.
There are no conflicts of interest to declare.


