


Introduction
A new era of national identity was emerging in the United States at the beginning of the twentieth century. Between the end of the Civil War and the beginning of the Great Migration, established cultural systems were experiencing both rapid expansion and worsening division. On one hand, the Great Migration increased national labor mobility from the South to the North and Midwest, increasing the cultural exchange between the two regions (Boustan Reference Boustan2008). On the other hand, the Civil War had aggravated the cultural and ideological differences between regions in a way that lead to a mentality of resentment and isolation in all regions. Footnote 1 It comes as no surprise, then, that Southern migrants to the North and Midwest often encountered hostilities along with the new economic opportunities found there (Hume Reference Hume1977).
What were the social and economic effects of those hostilities for people perceived to be regional “outsiders” in the North and Midwest? To what extent did prejudice against regional outsiders affect people’s socioeconomic outcomes? Specifically, we address two questions in our research: First, did people living in the North or Midwest do worse if they were perceived to be of Southern origins (regardless of their actual regional origins)? Second, how did the effects of being perceived to be of Southern origins matter differently for White and Black individuals?
Background
In many ways the economic effects of the Great Migration have been comprehensively studied (Alexander et al. Reference Alexander, Leibbrand, Massey and Tolnay2017; Boustan Reference Boustan2008; Eichenlaub et al. Reference Eichenlaub, Tolnay and Alexander2010; Gardner Reference Gardner2016; Smith and Welch Reference Smith and Welch1989). In general, migration was economically beneficial for migrants’ economic circumstances through a combination of higher salaries and more prestigious jobs coming within reach. However, this prosperity was often limited along racial lines. For instance, Gardner (Reference Gardner2016) found that despite individual increases, the salary of the average Black man in the northern states went down during the Great Migration due to a combination of two factors. First, while Black migrants to the North did make more than they had in the South, they were still kept from many of the higher paying jobs that White migrants dominated, making their income lower overall (Boustan Reference Boustan2008). Second, Blacks already residing in the North experienced a decrease in pay due to the sudden influx into the labor market of Black labor from the South (Eichenlaub et al. Reference Eichenlaub, Tolnay and Alexander2010). In short, more Black men were competing for a limited number of jobs, leaving many under- or unemployed. Although much of the research literature focuses on Blacks, the Great Migration involved the mass movement of both Whites and Blacks from the South to the North and Midwest. While not as well documented, one can imagine that the White population may have experienced similar, if less extreme, changes in their economic circumstances during this period. With this in mind, resentment and hostility by Northerners toward Southern migrants—or, at least, people perceived to be of Southern origins—is not unexpected.
However, this socioeconomic shift would not have been the only source of tension at the time. While the surrender of the South in 1865 meant the political reunification of the country, distrust and hostility both persisted and grew in the years after the war. The inevitable resentment in the aftermath of a civil war was also aggravated by an ineffective and culturally insensitive reconstruction effort on the part of the North, which delayed the South’s economic recovery. The deep suspicion and hostility that this created would persist for generations. One study of Southern culture found that an “Us vs. Them” mentality was maintained between the North and South well into the twentieth century (McKinney and Bourque 1971). It wasn’t until the 1960s, when the South saw a rapid increase in integration and industrialization, that the cultural divide became less pronounced (ibid). With these deeply ingrained hostilities, it would seem natural that any person perceived to be of Southern origins would face social and economic discrimination in the North and Midwest.
Isolating the Effects of Discrimination
Regional migrants—people who move to a region in which they were not born—differ on important life outcomes as compared to nonmigrants living in the same region. For example, Southern-born African Americans moving north in the early twentieth century were very different from African Americans already living in the North with respect to culture, skills, and socioeconomic origins. Differences in observed outcomes, hence, do not represent (just) the effects of region-based discrimination; they also reflect preexisting differences. How can we isolate the effects of region-based discrimination from the effects of cultural, skill, and socioeconomic factors that might confound the association between migrant status and life outcomes? In other words, if people living in the North or Midwest who are perceived to be of Southern origins do worse with respect to education, occupation, and earnings, how can we tell the degree to which this is due to discrimination on the basis of perceived regional origins?
Our strategy is to compare siblings, identical in terms of region of birth and family cultural and socioeconomic factors, who differ with respect to the degree to which their names signal Southern origins. Proper names are an important indicator of group membership, and can convey a great deal about social, economic, cultural, religious, racial, and regional origins (e.g., Arai and Skogman Thoursie Reference Arai and Skogman Thoursie2009; Biavaschi et al. Reference Biavaschi, Giulietti and Siddique2017; Busse and Seraydarian Reference Busse and Seraydarian1977; Elchardus and Siongers Reference Elchardus and Siongers2011; Laham et al. Reference Laham, Koval and Alter2012; Rubinstein and Brenner Reference Rubinstein and Brenner2014). By comparing individuals who are the same with respect to factors that might confound the association between migrant status and life outcomes but who differ with respect to the “Southern-ness” of their names, we seek to isolate the effects of discrimination against perceived regional outsiders. Among brothers who both lived in the North (or Midwest), if the brother with the more Southern-sounding name typically fared worse, then this is evidence of discrimination based on perceived regional origins. This is true regardless of actual regional origins, although we examine differences in effects across actual region of birth.
Why Might People with Southern-Sounding Names Have Faced Discrimination?
Previous studies have demonstrated that socially or culturally nonnormative names—names that identify a person as an “other” or “outsider”—subject the individuals who hold them to negative life outcomes relative to individuals with socially normative names. This literature has considered the effects of holding names that are nonnormative with respect to race, gender, immigrant status, and perceived income in both historical and contemporary contexts (e.g., Bertrand and Mullainathan Reference Bertrand and Mullainathan2004; Busse and Seraydarian Reference Busse and Seraydarian1977; Carneiro et al. Reference Carneiro, Lee and Reis2020; Cook et al. Reference Cook, Logan and Parman2016; Figlio Reference Figlio2005; Fryer Jr. and Levitt 2004; Goldstein and Stecklov Reference Goldstein and Stecklov2016). In general, because names often indicate cultural or social group membership, holding a name from a social outgroup can lead a person to experience discrimination. For example, Bertrand and Mullainathan (Reference Bertrand and Mullainathan2004) assessed the impact of racialized names on employment outcomes by submitting nearly identical resumes, differing only on the implied race of the applicant’s first name, to various employers. They found that applicants with Black-sounding first names received 50 percent fewer callbacks than those with White-sounding first names. In other words, when all other social and cultural factors were the same, an outgroup name caused individuals to experience worse outcomes compared to their otherwise similar peers.
However, no previous research has used names to identify the effects of being a (perceived) regional outsider in the United States in either historical or contemporary contexts. Our study is thus innovative in that it fills this gap in the current literature and does so in the context of one of the largest migratory movements in American history: the Great Migration. Why might people with Southern-sounding names have faced professional and social discrimination in the North or Midwest?
Given the significant economic, cultural, and political differences between the North and the South in the early twentieth century, it is fair to compare the relationship between the two regions to the relationship between two nations. In this context, we draw on previous research that has considered the effects of holding names associated with international migrants on social and economic outcomes. For example, Biavaschi et al. (Reference Biavaschi, Giulietti and Siddique2017) examined the consequences for new immigrants to America of changing their names. They found that a more “American” name provided economic benefits for immigrants living in New York City, and could even make up for the economic deficits of being an immigrant (Biavaschi et al. Reference Biavaschi, Giulietti and Siddique2017). Similarly, Arai and Skogman (2009) found that immigrants moving to Sweden who changed their surname experienced an increase in economic outcomes in comparison to their nonconforming peers (Arai and Skogman Thoursie Reference Arai and Skogman Thoursie2009; Goldstein and Stecklov Reference Goldstein and Stecklov2016).
With all this in mind, it is reasonable to hypothesize that having a Southern-sounding name may have had detrimental effects on life outcomes among people living in the North or Midwest—regardless of their actual origins. People with more Southern-sounding names may thus have had worse life outcomes than their siblings with less Southern-sounding names. Given the unique racial dynamics of Northern and Midwest areas that received large numbers of in-migrants during the Great Migration, it is also reasonable to suppose that the effects of having a Southern-sounding name may have been more pronounced for African Americans than for Whites. That is, in the hostile context faced by African Americans, discrimination against men with Southern-sounding names may have been even more severe.
Why Having a Southern-Sounding Name Might Not Have Mattered
Our hypothesis—that having a Southern-sounding name had detrimental effects on life outcomes among people living in the North or Midwest—is based on extensive research that has found name-based discrimination on the basis of race, nativity, gender, and other attributes. However, the bulk of this research has been conducted in contemporary settings. In modern America, decisions about things like college admissions and hiring often happen without face to face interactions. In such bureaucratic and impersonal contexts, those with the power to make admissions or hiring decisions often make guesses—consciously or unconsciously—about applicants’ personal attributes and group memberships (e.g., race, regional origin, gender, nationality). Names can be one important source of information for making such assumptions and guesses. In that space, names—and thus assumptions about personal attributes—can lead to biases and discrimination. However, in the early twentieth century, most such decisions were made after in-person meetings. Job seekers applied in person at the factory or farm, for example, and college applicants more often relied on family and personal connections to gain admission. In these contexts, those with the power to make admissions or hiring or other consequential decisions did not have to make guesses about applicants’ regional origin (or other attributes) based on their names. They met applicants in person, heard their accents, saw their manner of dress, knew their families, or observed other cultural cues directly. Consequently, even though extensive prior research conducted in more contemporary contexts implies that people with Southern-sounding names may have fared worse that their siblings with less Southern-sounding names, there is also good reason to doubt that this hypothesis will hold in the context of the early twentieth century.
Research Design
We address our research questions using data that begins with all 11,272,765 US-born males between the ages of 0 and 10 who appeared in the IPUMS version of the complete-count 1920 US Census (Ruggles et al. Reference Ruggles, Sarah Flood, Josiah Grover, Pacas and Sobek2020). From the 1920 Census we obtain information about these boys’ first and last names; their demographic characteristics (including age, sex, race, and place of birth); their coresident parents’ demographic and socioeconomic characteristics; and their household’s geographic location. We then identify those same boys in the IPUMS version of the complete-count 1940 US Census when they were between the ages of 20 and 30. From the 1940 Census we obtain information about these boys’ educational attainment, occupation, and wage and salary income.
We begin by restricting our sample to the 11,047,470 boys who were children, grandchildren, stepchildren, or nephews of the head of their household in 1920; this is necessary to ensure that pairs of boys in households are siblings. We further restrict the sample to the 1,188,618 boys (and thus 594,309 pairs of siblings) whose 1920 Census records could be linked to their 1940 Census records and who lived in households in 1920 that contained at least two brothers between the ages of 0 and 10; when there were more than two age-appropriate boys in a household, we picked two of them at random. Finally, we restrict the sample to the 1,022,344 boys (and thus 511,172 pairs of boys) whose names appeared at least 100 times in the 1920 Census and who either: (1) were born in the South and lived in the South in 1940; (2) were born in the South and lived in the North in 1940; (3) were born in the South and lived in the Midwest in 1940; (4) were born in the North and lived in the North in 1940; or (5) were born in the Midwest and lived in the Midwest in 1940.
Linking Records
To match records across the 1920 and 1940 censuses we first defined the universe of potential matches. To make the task computationally tractable, we restricted the population of potential matches to records that displayed identical or similar characteristics on features that should be consistent over time (e.g., year and place of birth). For example, when attempting to find the 1940 Census record for Michael Corcoran—born in 1917 in Massachusetts according to the 1920 Census—we limited the population of potential matches in 1940 to males born in Massachusetts between 1914 and 1920. Because age is reported in the 1920 and 1940 censuses rather than year of birth, and because of reporting inaccuracies, we allow for deviations of ±3 years in birth year across data sources.
To identify the correct record from among all possible records in the 1940 Census—for example, the correct “Michael Corcoran” in 1940 from among all the possible Michael Corcorans—we employed a machine learning algorithm that performed probabilistic record linking techniques. Briefly, we trained a computer algorithm to recognize patterns in a dataset of potential matches that are consistent with a true match. We used a modification of Feigenbaum’s (2016) probit regression approach, which—like other methods of supervised machine learning—required input from training data. The training data represents a subsample of the population that one wishes to link, but where links have been declared by a trained human to ascertain that confirmed links are as accurate as possible. We used these training data to calibrate the linking algorithm and to evaluate how well it performs in declaring matches and avoiding false positives matches. The goal was to train the algorithm to link as many records as possible while keeping the false positive match rate exceedingly low.
To construct the training data, we randomly selected 1,000 age-appropriate boys from the 1920 Census who we then attempted to link by hand to the relevant universe of possible 1940 matches. Here, the universe of potential matches was limited to cases in which name similarity scores (Jaro Reference Jaro1989, Reference Jaro1995; Winkler Reference Winkler1990, Reference Winkler2006) were at least 0.8. We assessed all potential matches by hand using the wealth of digitized historical information and search features available from Ancestry.com. Historical information about parents, siblings, and the focal individual’s places of residence from the time between the 1920 and the 1940 Census allowed us to make confident assessments regarding the validity of potential matches and to minimize the rate of false positive linkages. Using these procedures, and carefully guarding against false positive matches, we were able to manually declare 50.2 percent of the training data sample as uniquely matched across 1920 and 1940.
To calibrate our linking algorithm, we implemented a “train-test-split” procedure using our training data (in which true matches are known). In the first part of the procedure, we split our training data into two equally sized parts. To train the algorithm, we fit a probit regression model on one-half of the sample, and then evaluated its out-of-sample performance on the other half. The model specification we used is similar to the one proposed by Feigenbaum (Reference Feigenbaum2016), but we added additional individual- and household-level covariates to reduce the risk of false positives, as also illustrated by Helgertz et al. 2020. Results from the model inform the algorithm as to which, if any, of the universe of possible matches should be considered a valid link (e.g., which “Michael Corcoran,” if any, is the one we are looking for). The algorithm declared a unique link based on threshold values (1) the greatest required similarity between any 1-to-1 match (technically the predicted probability based on the probit regression estimates) and (2) the required relative difference between the best and second-best possible match. When selecting thresholds values, the precision and recall of the resulting data are fundamental metrics to consider. Recall refers to the proportion of true matches that are declared as matches by the algorithm, whereas precision indicates the proportion of the declared matches that are true matches. If the thresholds are set very conservatively, few but accurate matches will be made, translating to a low recall and a high precision. Conversely, less conservative thresholds will result in high recall but a low precision.
Choosing thresholds that favor a high precision or a high recall is not a straightforward task, which is why we used the Matthew’s Correlation Coefficient (MCC). Described in Equation 1,Footnote 2 the MCC is an especially useful measurement for two-class data where the classes are not well balanced (Chicco Reference Chicco2017); MCC provides a single metric of linking performance (ranging from –1 to +1) and is based on both precision and recall. By looping multiple times over a range of realistic threshold values, we were able to choose values for (1) and (2) that optimized the overall performance of the linking algorithm.
 $$MCC = {{{TP \times TN - FP \times FN} \over {\sqrt {\left( {TP + FP} \right)\left( {TP + FN} \right)\left( {TN + FP} \right)\left( {TN + FN} \right)}} }}$$
Weighting
Although the rates at which we matched records across data sources are very high by the standards of historical record linkage (see, e.g., Beach et al. Reference Beach, Ferrie, Saavedra and Troesken2016; Ferrie Reference Ferrie1996), a threat to the external validity of our results is that the sample of boys we were able to match may differ systematically from the sample of boys we were unable to match. To address this potential problem, we constructed and employed poststratification weights that account for each boy’s probability of being matched across the 1920 and 1940 censuses.
We take advantage of the fact that we observe several attributes of boys in 1920 regardless of whether we could confidently match them to a record in the 1940 Census. In Table A1 we report descriptive statistics that compare boys who could and could not be matched to their 1940 Census records with respect to race/ethnicity, place of birth, mother’s literacy, father’s occupation, and homeownership. Boys who could be matched to their records in 1940 are more likely to be White, to come from somewhere other than the South, and to come from more advantaged socioeconomic origins.
To construct the weights, we estimated a probit model predicting whether a boy could be matched as a function of his race, age in 1920, state of residence in 1920, mother’s literacy, father’s literacy, father’s occupation, homeownership, and family size. We then take the inverse of the predicted probability of being linked and normalize the distribution of the resulting values to have a mean of one. Conceptually, these weights count boys who were least likely to be matched more heavily in the analyses without changing the overall sample size.
Name-Based Measures
Our key independent variable describes the percentage of boys ages 0 to 10 with each proper name who were born in a Southern state according to the 1920 Census. That is, for every boy age 0 to 10 in 1920 who had the first name “Thomas” we compute the percentage who were born in the South; we then repeat this for every first name observed among boys in this age range in the 1920 Census. As described in the preceding text, we exclude the relatively small number of boys whose first names were observed fewer than 100 times. Many of these boys had names that were abbreviations or spelling or transcription errors (e.g., “Thomqs” or “TG”). Before constructing our measure, we remove punctuation and middle names/initials (e.g., such that “Thomas A.” becomes “Thomas”). We do not account for multiple spellings or nicknames. As a result, “Thomas,” “Thos,” “Tom,” “Thom,” and “Tomas” are all treated as distinct names and appear in the data (so long as they each appear at least 100 times). We also drop names that are 0, 1, or 2 characters long (because most are simply sets of initials, like “TG”).
Table 1 describes the distribution of the resulting measure. Across our 1,022,344 linked boys, the average first name is held by someone born in the South about 33 percent of the time. The average African American boy’s first name was held by someone born in the South about 46 percent of the time. Figure 1 depicts the distribution of the “Southern-ness” of each first name held by the 980,215 White boys (top half of figure) and the 41,081 Black boys (bottom half of figure). It shows that names that are predominantly held by Southerners are more often held by Blacks. Among the names appearing at least 100 times among boys matched between the 1920 and 1940 censuses, those that were most distinctively Southern were Grady (99% Southern born), Odis (95%), and Lonnie (93%). Those that were most distinctively Northern were Carmine (91% Northern born), Regis (87%), and Salvatore (85%).
Table 1. Descriptive statistics, by race
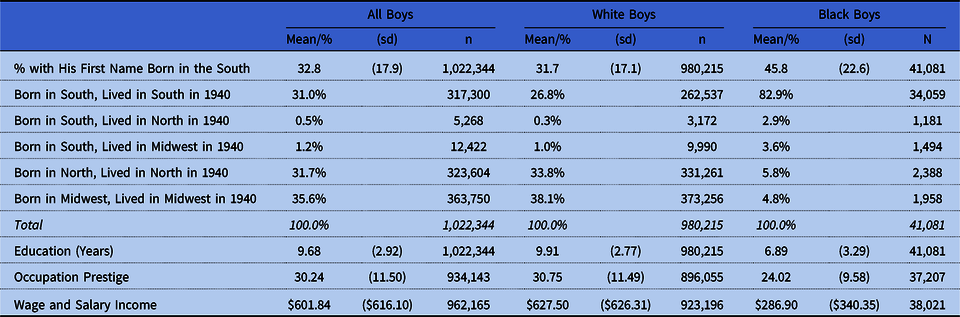
Note: Sample restricted to the 1,022,344 boys who could be linked across the 1920 and 1940 censuses; who were children, stepchildren, grandchildren, or nephews of the household head; who had at least one other age-appropriate brother in the household in 1920; whose first name appeared at least 100 times in 1920 Census; and who lived in one of the five combinations of regions of birth and regions of residence in 1940 considered in our analyses.

Figure 1. Distribution of Southern-ness of first names, by race, boys linked from 1920 to 1940.
Note: Sample restricted to the 1,022,344 boys who could be linked across the 1920 and 1940 censuses; who were children, stepchildren, grandchildren, or nephews of the household head; who had at least one other age-appropriate brother in the household in 1920; whose first name appeared at least 100 times in the 1920 Census; and who lived in one of the five combinations of regions of birth and regions of residence in 1940 considered in our analyses. All analyses are weighted by the inverse of the probability of selection into the linked sample.
Although our focus is on the effects of first names, we also constructed parallel measures for each boys’ last or surname for the purposes of supplementary analyses described in the following text.
Dependent Variables
Our outcome measures from the 1940 Census include educational attainment (measured in years), wage and salary income (in dollars, which is unavailable for many farmers and self-employed people), and occupational prestige (Siegel Reference Siegel1971). As shown in table 1, there is little missing data on educational attainment or occupational prestige (and no missing data on the name-based measures); those missing on wage and salary income were not generally wage and salary workers. As a result, in each analysis we exclude the small percentage of respondents who are missing on the dependent variable.
Analytic Methods
We begin by estimating OLS regression models that express the bivariate relationship between our measures of the Southern-ness of names and each outcome. Of course, these associations are confounded by any variable that is both associated with naming patterns and consequential for our several outcomes (e.g., geography, race/ethnicity, cultural preferences, or socioeconomic status). We thus rely most heavily on sibling fixed-effects models that account for all such attributes that are shared by siblings.
To estimate the effects of the Southern-ness of names more robustly on each outcome, we use a standard fixed-effects specification for within-pair estimation:
 $${M_{ij}} = \alpha + \beta {N_{ij}} + {C_j} + {\varepsilon _{ij}},$$
In Equation 2, M ij is a continuous outcome measure (i.e., education, occupation, or income) for individual i (i = 1, 2) in sibling pair j (j = 1, 2, …, n); N ij measures attributes of the name of individual i in sibling pair j; C j is a measure of unobserved contextual characteristics shared by both members of the pair (e.g., geography, race/ethnicity, cultural preferences, or socioeconomic status); and ϵ ij is a random individual-level error term that is assumed to be uncorrelated with the other explanatory variables in the model.
In such a within-sibling pair model, the unobserved shared components C j are “controlled away” by modeling differences within pairs of brothers:
 $${M_{1j}}-{M_{2j}} = \Delta {M_j} = \beta \Delta {N_j} + \Delta {\varepsilon _j},$$
In Equation 3, the Δs represent differences between variables for the jth sibling pair (i.e., N 1j – N 2j ). This approach eliminates the confounding effects of unobserved contextual characteristics (C j )—because siblings have these things in common. In our models, we control for birth order that differs between siblings, may be related to naming practices (e.g., names for firstborn sons may be systematically different than for subsequent sons), and can be associated with our outcomes (e.g., if firstborn sons disproportionately inherit property or businesses).Footnote 3
Both our OLS and within-sibling pair models employ the poststratification weights described in the preceding text to account for selectivity with respect to which boys could be linked across the 1920 and 1940 censuses.
Results
Table 2 describes OLS regressions of each dependent variable on our measure of the Southern-ness of boys’ first names. In Models 1, 2, and 3 boys were born in the South and lived in the South, North, and Midwest in 1940, respectively. Regardless of where they lived in 1940 and generally regardless of race, boys born in the South who had more Southern-sounding names fared worse with respect to education, occupational prestige, and income in 1940. For boys who remained in the North (Model 4) or Midwest (Model 5) from birth through 1940, there was a very weak association between name Southern-ness and education or occupational prestige. An exception is that White boys who were born and remained in the North had somewhat more education and higher income the more Southern their name sounded.
Table 2. Bivariate OLS regressions of outcomes on Southern-ness of first name, by region of birth and region in 1940
Note: Sample restricted to the 1,022,344 boys who could be linked across the 1920 and 1940 censuses; who were children, stepchildren, grandchildren, or nephews of the household head; who had at least one other age-appropriate brother in the household in 1920; whose first name appeared at least 100 times in the 1920 Census; and who lived in one of the five combinations of regions of birth and regions of residence in 1940 considered in our analyses. All analyses are weighted by the inverse of the probability of selection into the linked sample.
*p < 0.05; **p < 0.01; ***p < 0.001.
The statistically significant—and sometimes sizable in magnitude—associations observed in table 2 suggest that boys with Southern-sounding names often had poorer socioeconomic outcomes in 1940. This may have been due to discrimination against people with Southern-sounding names, but it may also have been due to selection: People with Southern-sounding names may have had other attributes (e.g., actual Southern birth, African American ancestry, fewer skills, family cultural legacies) that were correlated with family naming practices and that mattered for socioeconomic outcomes in 1940. Our sibling fixed-effects models are designed to isolate the effects of discrimination against people with Southern-sounding names—and thus the effects of region-based biases.
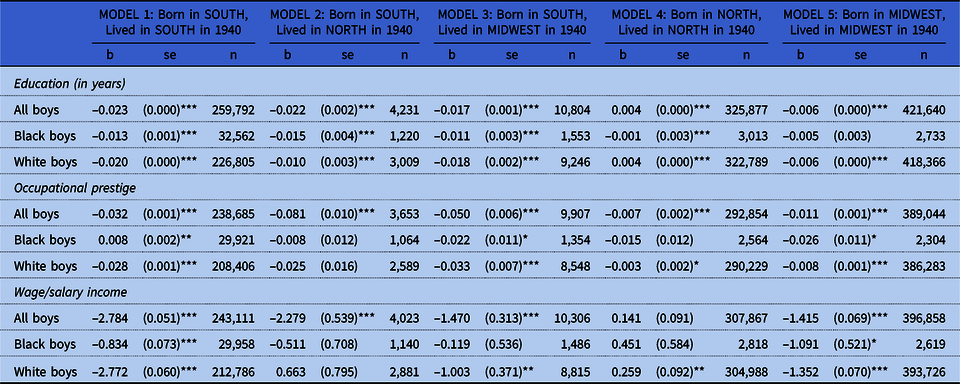
Table 3 reports the results of sibling fixed-effects models specified in Equations 2 and 3. Note that each model adjusts for birth order; we suspect that first born boys were more likely to be given their father’s (disproportionately regional) name and also to have benefited from greater socioeconomic investments by their parents in terms of educational opportunities, wealth transfer, and inheritances of farms, businesses, or other property. In table 3, the top panel pertains to educational attainment, the middle panel to occupation prestige, and the bottom panel to income. In each panel, we report separate results for all brother pairs, White brother pairs, and Black brother pairs. Recall that our sample is restricted to brother pairs in which both members of the pair lived in the same region in 1940.
Table 3. Sibling fixed effects models of outcomes on Southern-ness of first name, by region of birth and region in 1940

Note: Sample restricted to the 1,022,344 boys who could be linked across the 1920 and 1940 censuses; who were children, stepchildren, grandchildren, or nephews of the household head; who had at least one other age-appropriate brother in the household in 1920; whose first name appeared at least 100 times in the 1920 Census; and who lived in one of the five combinations of regions of birth and regions of residence in 1940 considered in our analyses. All analyses are weighted by the inverse of the probability of selection into the linked sample.
*p < 0.05; **p < 0.01; ***p < 0.001.
As shown in table 3, using this fixed-effects specification we find very few statistically significant relationships between name Southern-ness and any of these outcomes; what is more, coefficient point estimates are typically much smaller in magnitude than the corresponding coefficient estimate in the OLS models in table 2. The exception is that Northern-born boys living in the North in 1940 who have more Southern-sounding names do a bit better with respect to education and a bit worse with respect to occupational prestige. Beyond these exceptions, the overwhelming evidence in table 3 is that associations between the Southern-ness of first names and socioeconomic outcomes—observed in table 2—disappear in models that account for all of the social, economic, cultural, racial, and other factors shared by brothers.
One possibility is that the effects of the regional signaling value of last names overwhelms the regional signaling value of first names. That is, people with very Southern-sounding last names may be assumed to be Southerners regardless of their first name. To investigate, we repeated the sibling fixed-effects models described in table 3 separately for brothers with “very Southern” last names (technically, last names for which more than 75 percent of holders were born in the South) and for brothers with “not very Southern” last names (technically, last names for which fewer than 25 percent of holders were born in the South). These results are presented in table 4. Coefficients in each model represent the estimated effect of holding a more Southern-sounding first name according to levels of the Southern-ness of last names (by region of birth and region of residence in 1940).
Table 4. Sibling fixed effects models of outcomes on Southern-ness of first name, by Southern-ness of last names, region of birth, and region in 1940
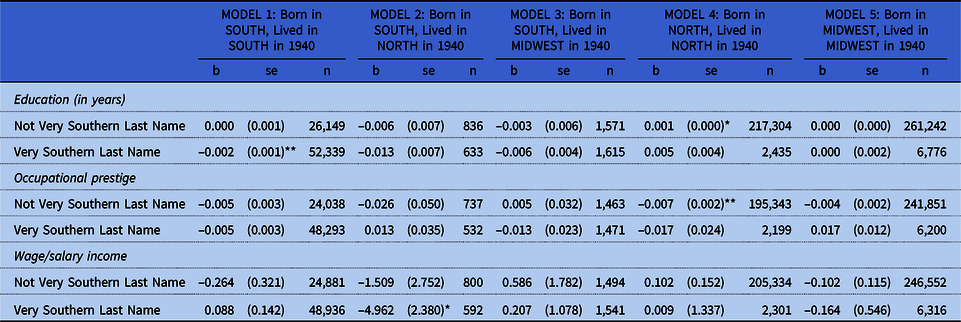
Note: Sample restricted to the 1,022,344 boys who could be linked across the 1920 and 1940 censuses; who were children, stepchildren, grandchildren, or nephews of the household head; who had at least one other age-appropriate brother in the household in 1920; whose first name appeared at least 100 times in the 1920 Census; and who lived in one of the five combinations of regions of birth and regions of residence in 1940 considered in our analyses. All analyses are weighted by the inverse of the probability of selection into the linked sample.
*p < 0.05; **p < 0.01; ***p < 0.001.
With one important exception, the results in table 4 continue to show that there are few significant or substantively large effects of the Southern-ness of boys’ first names—regardless of the Southern-ness of their last names. The one exception: Among boys who were born in the South, who lived in the North in 1940, and who had very Southern-sounding last names, those with more Southern-sounding first names earned substantially lower salaries and wages.
Another possibility is that the Southern-ness of first names typically does not vary much within sibling pairs. In this situation, we might not typically see much of an effect of a single percentage point increase in the Southern-ness of first names. However, we might see larger effects if we focused on brother pairs in which one brother had a very Southern first name and one had a very not-Southern first name.
In the top panel of table 5, we restrict our sample to the subset of brother pairs in which the Southern-ness of their first names differed by at least 25 percentage points (e.g., if one brother’s name was held by someone of Southern birth 10 percent of the time, the other brother had to have a name that was held by someone of Southern birth at least 35 percent of the time). In the bottom panel of that table, we restrict our sample to pairs of brothers in which the Southern-ness of their names differed by at least 50 percentage points. Our models in table 5 express the effect of being the brother with the much more Southern-sounding name (not the effect of a single percentage point increase in name Southern-ness as in tables 2 through 4). Here again, we see almost no significant or large effects of holding a (very) Southern-sounding first name. Within pairs of brothers who differ markedly on the Southern-ness of their first names, the brother with the (much) more Southern-sounding name did no worse (or better).
Table 5. Sibling fixed effects models of outcomes on having a very Southern first name, by region of birth and region in 1940, within highly discrepant pairs
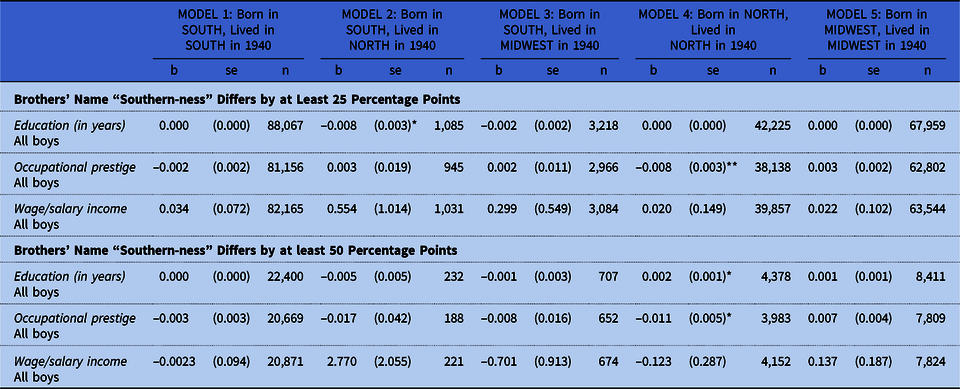
Note: Sample restricted to the 1,022,344 boys who could be linked across the 1920 and 1940 censuses; who were children, stepchildren, grandchildren, or nephews of the household head; who had at least one other age-appropriate brother in the household in 1920; whose first name appeared at least 100 times in the 1920 Census; and who lived in one of the five combinations of regions of birth and regions of residence in 1940 considered in our analyses. All analyses are weighted by the inverse of the probability of selection into the linked sample.
*p < 0.05; **p < 0.01; ***p < 0.001.
Discussion
A large body of research uses names as a proxy for people’s risk of experiencing discrimination based on social, economic, or demographic characteristics. Previous research—often using experimental designs and nearly all conducted in the context of much more recent cohorts of people—has shown that people discriminate against racial/ethnic minorities, poor people, women, immigrants, and other groups by making inferences about group membership from signals provided by proper names. Given the history of regional hostilities in the late nineteenth and early twentieth century in the United States, we expected to see evidence of discrimination against regional outsiders; our leverage in identifying the effects of discrimination was to take advantage of within-sibling pair comparisons.
On one hand, we hypothesized that we would observe negative consequences for social and economic outcomes of holding a name that implied that a boy was of Southern origins. By studying boys born in the 1910s, our results pertain to cohorts who experienced the Great Migration of Southerners—including many African American Southerners—to the North. In particular, we expected to observe that people living in the North who had Southern-sounding names would fare worse with respect to education, occupation, and wages; we anticipated that these effects might be even more pronounced for African Americans. In fact, we found few such effects; even statistically significant coefficients were small in magnitude. In general, having a Southern-sounding name had little independent impact on boys’ life outcomes.
Does this mean that Southerners moving North (and bringing their Southern-sounding names with them) did not, in fact, experience discrimination? More generally, does it mean that American regional outsiders in the decades following the Civil War and in the years of the Great Migration did not face consequential levels of bias? Perhaps, but we suspect it is more likely that such bias did not operate based on people’s names. That is, we question whether—in this historical era—names were a primary way in which people inferred people’s regional origins.
Prior research using audit study designs—experiments that randomly and artificially manipulate applicants’ names to signal group membership—has attempted to isolate the role of interpersonal discrimination in labor market and other outcomes. In a typical design, people with the power to discriminate are asked to evaluate otherwise similar people who differ only with respect to which their name is generally perceived to be typical of women, African Americans, immigrants, or other traditionally marginalized groups. These studies often (but not universally) find pronounced effects of holding a name that is typical of people from marginalized groups on educational, labor market, housing, and other outcomes. That is, in these contexts, names matter.
Although audit studies are strong with respect to their internal validity, they are weak in three other respects. First, they are not typically generalizable to the US population more broadly even in modern times. They usually pertain to a narrow subset of people—for example, applicants for one kind of job or people living in one city or region. Second, they typically pertain to a narrow range of (often hypothetical) labor force or other outcomes; these sorts of studies do not always demonstrate effects on actual realized wages, actual long-term occupational attainment, actual longevity, or other actual long-term outcomes. Third, and perhaps most importantly, in audit and similar designs people with the power to discriminate can only do so on the basis of names and not on the basis of other potentially more powerful signals of group membership—like phenotypical body features (e.g., skin tone), accents (e.g., Southern accents), or relationship to other people whose group memberships are known (e.g., a Southern father).
In our research, we overcome these limitations of audit studies for estimating the effects of discrimination against people of Southern origins. Using nationally representative data, we use a sibling comparison design to estimate the effects of Sothern-ness of boys’ first names on their actual realized educational attainment, occupational prestige, and wages and earnings. Our sibling design allows us—like audit studies—to rule out most of the factors that might otherwise confound the association between given names and these sorts of outcomes. Perhaps most importantly, however, our design does not force people at risk of discriminating to infer people’s regional origins based on names alone. Potential employers, for example, could guess job applicants’ regional origins based on their names—but they could also hear their accents, inquire about their region of birth, know their friends, or otherwise access more direct measures of their Southern-ness.
For real-world outcomes in a large and representative population in the early twentieth century, discrimination against Southerners happened in some other way than inferring regional origins based on names. Northerners in a position to discriminate against Southerners, for example, and to deny them access to education, jobs, higher pay, and other valued resources apparently did so—we reason—based on information about them besides their names.
In the end, our work calls into question the broad applicability and scope conditions of conclusions of research that uses proper names as a marker of people’s risk of suffering from discrimination on the basis of regional origins—and also on the basis of race, gender, immigration status, and other attributes. More generally, our work calls into question the conditions and circumstances under which names have independent effects on life outcomes. We conclude that names had no such independent effects in the context of early-twentieth-century America (at least with respect to regional discrimination), and instead that associations between names and life outcomes were confounded by family-level economic and cultural factors—that is, by those factors that are generally observable to people with the power to discriminate.
Acknowledgments
Paper prepared for presentation at the 2019 meetings of the Social Science History Association. The project benefited from support by a grant from the National Institute on Aging (1R21AG054824-01A1). Support has also come from the Minnesota Population Center, which receives core funding (P2C HD041023) from the Eunice Kennedy Shriver National Institute for Child Health and Human Development (NICHD). Noah Greenswig, Anna Harvatine, and Anika Tol were significant contributors to early versions of the research described in this article. We are also very grateful to J. David Hacker, Trevon Logan, Evan Roberts, and two anonymous reviewers for providing helpful comments and suggestions. However, errors and omissions are the responsibility of the authors. Please direct correspondence to John Robert Warren at warre046@umn.edu.
Appendix
Table A1. Comparison of boys’ 1920 characteristics between those who could and could not be linked to the 1940 Census
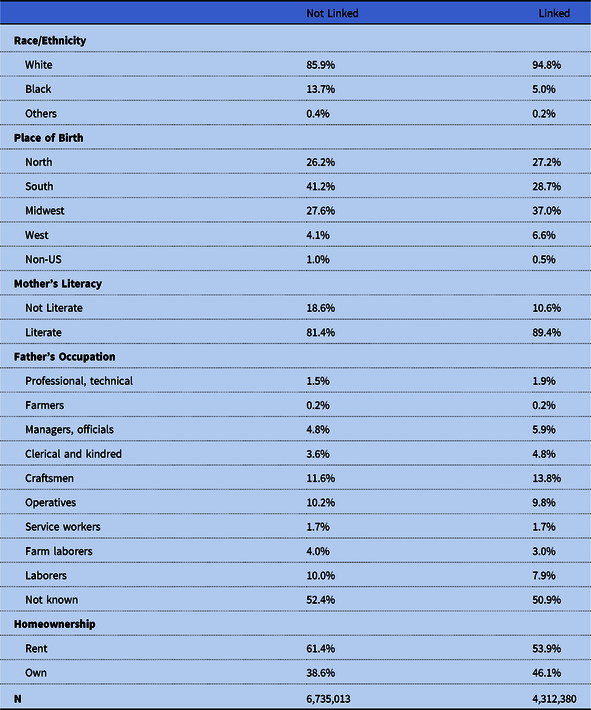
Note: Sample restricted to all boys who were 0 to 10 in 1920 and who were children, grandchildren, stepchildren, or nephews of the head of their household.


 Open access