


1. Introduction
Cavity or bubble formation in granular media due to high-energy impacts or explosions is a common phenomenon in nature and engineering, such as meteorites impacting planets (Housen & Holsapple Reference Housen and Holsapple2003) and underground blasting (Jiang et al. Reference Jiang, Zhou, Lu and Zhang2017; Anas, Alam & Umair Reference Anas, Alam and Umair2022). These processes involve strong interactions between the highly compressible gases and granular media. The cavity evolution process in granular media is similar to the bubble dynamics in a continuum fluid (Devaraj Reference Devaraj2017). Granular media exhibit characteristics unique to both continuum and discrete particles. This dual nature leads to distinctive particle jetting and splashing patterns during the collapse of granular cavities (Koneru et al. Reference Koneru, Rollin, Durant, Ouellet and Balachandar2020; Li et al. Reference Li, Xue, Zeng, Tian and Guo2022). Such a dynamics plays a crucial role in shaping prominent topographic features, notably impact craters, which have been extensively studied by Loranca-Ramos, Carrillo-Estrada & Pacheco-Vázquez (Reference Loranca-Ramos, Carrillo-Estrada and Pacheco-Vázquez2015), Zhao et al. (Reference Zhao, Zhang, Tjugito and Cheng2015) and Gao et al. (Reference Gao, Liu, Vanin, Sun, Cheng and Gordillo2018).
Arguably as relevant as the above cavity evolution in granular media is the bubble in a liquid (Lohse Reference Lohse2018). Taylor's findings (Taylor Reference Taylor1950) established a 2/5 power law for predicting cavity size relative to the explosive energy. The Rayleigh–Plesset equation (Plesset & Prosperetti Reference Plesset and Prosperetti1977; Brennen & Christopher Reference Brennen and Christopher2005) is fundamental for describing three-dimensional (3-D) bubble evolution in an infinite fluid domain. Recently, Zhang et al. (Reference Zhang, Li, Cui, Li and Liu2023) extended this equation to establish a unified theory of oscillating bubbles by considering key physical quantities such as fluid compressibility, viscosity and surface tension. Additionally, Wang et al. (Reference Wang, Li, Guo, Wang, Du, Wang, Abe and Huang2021) applied the Rayleigh–Besant equation to examine interface instability in 2-D cylindrical water films within a finite fluid domain. A key distinction between granular media and impenetrable continuum fluids lies in the permeability of granular media, allowing gas to penetrate the porous structure, leading to additional mass and energy transfers between the cavity and surrounding environment. This feature significantly influences the dynamics of the cavity or bubble evolution in granular media, offering a complex and rich field of study.
Recent efforts have focused on quantitatively describing cavity evolution in granular media. Lai, Houim & Oran (Reference Lai, Houim and Oran2017) established an empirical power-law relationship between the cavity radius and time using a two-fluid model simulation method. Pacheco-Vázquez, Tacumá & Marston (Reference Pacheco-Vázquez, Tacumá and Marston2017) compared their experimental data with the predictions of the classical Rayleigh–Plesset equation. Liu et al. (Reference Liu, Cao, Liu, Sun and Chen2020) proposed a relationship equating the cavity expansion velocity to the gas-penetration velocity estimated using Ergun's equation. Furthermore, Xue et al. (Reference Xue, Miu, Li, Bai and Tian2023) proposed a ring-pulsation model to recover the velocities of the interior and exterior interfaces for symmetrical cavity expansion by providing a fitting curve for the cavity pressure. Despite these advancements, a significant research gap remains in developing a fully closed theoretical model that explores the relationship between the cavity radius and pressure evolution, particularly considering gas-penetration effects. This indicates the need for further research to comprehensively understand these complex interactions.
This study proposes a comprehensive closed three-equation model to address these challenges of cavity evolution in granular media. First, the cavity radius equation was obtained from a 2-D finite Rayleigh–Plesset model with the to-be-determined cavity pressure. Second, the cavity pressure equation was derived based on the first thermodynamic law considering gas expansion, energy injection and leak-off. Third, the equation for determining the gas-penetration velocity was derived from Ergun's equation, which is a quadratic model for describing high-velocity non-Darcy flows in porous media. Finally, the cavity evolutions of the centrally symmetric and non-centrally symmetric cases are predicted using our proposed theoretical model, where the comparison data are from validated Eulerian–Lagrangian simulations based on the compressible multi-phase particle-in-cell (CMP-PIC) method (Tian et al. Reference Tian, Zeng, Meng, Chen, Guo and Xue2020).
2. Numerical methods
2.1. The CMP-PIC method
To numerically simulate the 2-D cavity evolution processes in granular media, we adopted our previously proposed CMP-PIC method (Tian et al. Reference Tian, Zeng, Meng, Chen, Guo and Xue2020). This method integrates the Eulerian–Lagrangian approach, where compressible gas is solved in fixed Cartesian Eulerian grids, while particles are tracked under the Lagrangian framework. The governing equations for the gas–particle system are as follows:
 $$\begin{gather} \frac{\partial \left( \alpha_g \rho_g \right)}{\partial t} + \boldsymbol{\nabla}\boldsymbol{\cdot} \left(\alpha_g \rho_g \boldsymbol{u}_g \right) = \rho_I q_I , \end{gather}$$
 $$\begin{gather}\frac{\partial \left( \alpha_g \rho_g \boldsymbol{u}_g \right)}{\partial t} + \boldsymbol{\nabla}\boldsymbol{\cdot}\left(\alpha_g \rho_g \boldsymbol{u}_g \boldsymbol{u}_g + \alpha_g P_g \right) = P_g \boldsymbol{\nabla} \alpha_g + \boldsymbol{f}_d, \end{gather}$$
 $$\begin{gather}\frac{\partial \left( \alpha_g \rho_g E_g \right)}{\partial t} + \boldsymbol{\nabla}\boldsymbol{\cdot} \left(\alpha_g \rho_g E_g \boldsymbol{u}_g + \alpha_g P_g \boldsymbol{u}_g \right) = P_g \boldsymbol{\nabla} \alpha_g \boldsymbol{\cdot} \boldsymbol{u}_p + q_d + \rho_I q_I h_I, \end{gather}$$
 $$\begin{gather}M_{p,j} \frac {{\rm d} \boldsymbol{U}_{p,j}}{{\rm d} t} = \boldsymbol{F}_{D,j} + \boldsymbol{F}_{P,j} + \sum_{i=1}^{N} \boldsymbol{F}_{C,i \rightarrow j}, \end{gather}$$
where  $\alpha _g$ is the gas volume fraction; $\rho _g$, $P_g$ and $E_g$ are the density, pressure and total energy of the gas phase, respectively; and $\boldsymbol {u}_g$ and $\boldsymbol {u}_p$ are the phase-averaged velocities of the gas and granular phases, respectively. The term $P_g \boldsymbol {\nabla } \alpha _g$ denotes the nozzling term, which is attributed to the interfacial pressure gradient force of the particle phase and $\boldsymbol {f}_d$ and $q_d$ denote the momentum and energy source terms, respectively, owing to the gas–particle drag force. To consider the energy input for the investigated gas–particle system, additional mass and energy source terms – $\rho _I q_I$ and $\rho _I q_I h_I$ – were introduced in (2.1) and (2.3), where $\rho _I$ and $h_I$ are the density and specific enthalpy of injection gas, respectively, and $q_I$ is the volumetric injection rate per unit volume of Hele-Shaw cell.
The parameters  $M_{p,j}$ and $\boldsymbol {U}_{p,j}$ denote the mass and velocity of parcel $j$, respectively. The forces exerted on the parcel include the gas–particle drag force $\boldsymbol {F}_{D,j}$; the pressure gradient force $\boldsymbol {F}_{P,j} = -V_j \boldsymbol {\nabla } P_g$, where $V_j$ is the parcel volume; and the collision force $\boldsymbol {F}_{C,i \rightarrow j}$ from other contacting parcels. The gas field surrounding the particle surfaces in the CMP-PIC method is not fully resolved. Therefore, the pressure gradient and drag forces were adopted to consider the gas–particle coupling effect. Specifically, the Di Felice model combined with Ergun's equation was used to calculate the gas–particle drag coefficient. The parcel–parcel interactions were resolved using a spring-dashpot model based on the coarse-grained discrete element method (CG-DEM) to calculate the collision force.
2.2. Simulation set-up
This study investigates two scenarios: centrally symmetric and non-centrally symmetric cases, as illustrated in figure 1. The simulation domain size was set to  $1.6 {\rm m} \times 1.6\ {\rm m}$ with a mesh size of $400 \times 400$ to solve for the gas equations. To prepare the initial 2-D parcel configuration of the granular media, a pure CG-DEM simulation of gravitational settling was priorly conducted without solving the gas equations to obtain a parcel template of a randomly close-packed granular bed (see supplementary materials for details).

Figure 1. (a) Simulation set-up of centrally symmetric scenario for 2-D cavity evolution in granular media. Here,  $r$ denotes the radial distance from the injection point. (b) Simulation set-up of non-centrally symmetric scenario for 2-D cavity evolution in granular media.
In the centrally symmetric scenario, a circle-shaped granular disk was clipped from the parcel template and positioned at the centre of the domain. The initial maximum outer radius of the 2-D granular disk was  $R_m^0$, which was set as the characteristic length, and the realistic particle diameter of the granular media was set to a constant value and denoted as $d_p$. All four boundaries of the simulation domain were set as exterior conditions, and high-pressure gas was injected into the centre cell of the coordinate $(x_I, z_I) = (0.8\ {\rm m}, 0.8\ {\rm m})$, as illustrated in figure 1(a).
For the non-centrally symmetric scenario, the initial configuration of the granular media was obtained by clipping the parcel template into a new granular bed with a specified height of  $H$. The gas injection point was then located at the cell with coordinates $(x_I, z_I) = (0.8\ {\rm m}, 0.3\ {\rm m})$, and the buried depth, denoted as $D_b$, was set as the characteristic length, as illustrated in figure 1(b). In this scenario, the left, right and bottom boundaries were set as non-penetrating solid wall conditions, and the remaining upper boundary was set as the exterior condition.
This study investigates the effects of three parameters on cavity evolving processes in centrally symmetric and non-centrally symmetric scenarios, i.e. the injection energy rate of gas  $Q_E = \rho _I h_I q_I A_{cell}$, where $A_{cell}$ is the area of the injection cell, the physical particle diameter $d_p$ of granular media and the characteristic length ( $R_m^0$ or $D_b$). To describe the process quantitatively, the cavity radius varying with time $t$ is denoted as $R(t)$. In the asymmetric scenario, the effective cavity radius is introduced and defined as $R_{eff}(t)=\sqrt {A_c(t)/{\rm \pi} }$, where $A_c(t)$ is the cavity area that varies with time $t$. The temperature of the injected gas is considered as the ambient temperature $T^0$; hence, the gas specific enthalpy $h_I = ({\gamma }/({\gamma -1}))R_g T^0$ is a constant where $\gamma$ is the adiabatic index and $R_g$ is the gas constant. Once $Q_E$ is determined, the mass injection rate of $\rho _I q_I A_{cell} = Q_E/h_I$ can be deduced from $Q_E$ and $T^0$. Given the total injection gas energy $E_T$, the characteristic time is denoted by $t_c = {E_T}/{Q_E}$.
2.3. Numerical validation
In our previous studies, the CMP-PIC method was validated for the centrally symmetric cases (Tian et al. Reference Tian, Zeng, Meng, Chen, Guo and Xue2020) and successfully applied to investigate centrally driven granular-induced instability problems (Xue et al. Reference Xue, Miu, Li, Bai and Tian2023). In this study, we further validated our in-house code for the non-centrally symmetric scenario by comparing our numerical results with those of Gao et al. (Reference Gao, Liu, Vanin, Sun, Cheng and Gordillo2018).
The experimental configuration for studying explosive cavity evolution processes closely mirrors our simulation setting for the non-centrally symmetric scenario. Specifically,  $D_b$ was set to 32 mm and the average $d_p$ was measured as $90\ \mathrm {\mu } {\rm m}$. The experimental close-packed fraction of the granular media was approximately 60 %, and the particle density was $\rho _s = 2500\ {\rm kg}\ {\rm m}^{-3}$. Therefore, the average particle density $\bar {\rho }_s = 1500 \ {\rm kg}\ {\rm m}^{-3}$. The ambient gas density $\rho _g^0$ was $1.18\ {\rm kg}\ {\rm m}^{-3}$ and gas viscosity $\mu _g$ was $1.81\times 10^{-5}\ {\rm Pa} \ {\rm s}$. Owing to the presence of granular media surrounding the gas injection valve, inferring the gas energy injection rate is difficult. To resolve this, $Q_E$ was obtained through calibration by comparing the effective cavity radius of the numerical results with the experimental data, which was estimated as $Q_E = 5.6\times 10^4\ {\rm J}\ {\rm m}^{-1}\ {\rm s}^{-1}$. We mainly investigated the behaviour in the time range of $t<$ 100 ms. Therefore, the total injected gas energy was $E_T = 5.6\times 10^3 \ {\rm J}\ {\rm m}^{-1}$. As the effective radius was not directly provided in their original work, we extracted the cavity outlines at different time points based on their attached high-resolution videos for the quasi-2-D cavity evolution processes (see supplementary materials for details). Table 1 lists the extracted data of the effective cavity radius at 24 time points (time interval is 5 ms) for comparison.
Table 1. Values of estimated  $R_{eff}$ at 24 time points (time interval is 5 ms) based on experimental data in previous literature (Gao et al. Reference Gao, Liu, Vanin, Sun, Cheng and Gordillo2018).

Figure 2 demonstrates the comparisons of  $R_{eff}$ between the experimental data and simulation results. Under such conditions, gravity does not significantly affect $R_{eff}$. Consequently, the effect of gravity was disregarded in subsequent analyses and simulations. A mesh convergence test confirmed that the current mesh size was sufficiently small to obtain converged results for $R_{eff}$. The CMP-PIC simulation results align with the experimental data. Furthermore, as illustrated in figure 2 the $R_{eff}^*=R_{eff}/D_b$ curve in a log–log plot vs dimensionless time $t^*=t Q_E/E_T$ shows notable scaling law of $\sqrt {t^*}$ during the latter stage of cavity expansion, necessitating further investigation into the intrinsic mechanism. In subsequent sections, $E_T$ is considered a constant value, while varying the injection rate to study the corresponding effect on the cavity evolution.

Figure 2. Comparisons of effective cavity radius  $R_{eff}$ among experimental data (Gao et al. Reference Gao, Liu, Vanin, Sun, Cheng and Gordillo2018) and simulation results. Here, $R_{eff}^*=R_{eff}/D_b$ is the non-dimensionalized effective cavity radius by the buried depth $D_b$ of the injection point, and $t^* = tQ_E/E_T$ is the non-dimensionalized time by total injection time $E_T/Q_E$.
3. Three-equation model for cavity evolution
In this section, we derived a three-equation model for a centrally symmetric scenario. Subsequently, the model was extended by considering the radial variation of the cavity radius to describe the non-centrally symmetric scenario. Finally, we performed a dimensional analysis to obtain a set of dimensionless numbers for investigating the effects of the control parameters.
3.1. Centrally symmetric cases
We assumed that the volume-average density of the granular phase, denoted as  $\bar {\rho }_s$, is constant. The viscosity effect of the granular medium and the compressibility of the granular medium are neglected during the cavity expansion processes, analogous to a 2-D bubble evolution process within an incompressible liquid film (Devaraj Reference Devaraj2017). First, in the radial $r$ direction, the governing equations of the mass and momentum balance are expressed as
 $$\begin{gather} \dfrac{1}{r} \dfrac{\partial}{\partial r} \left( r u_r \right) = 0 \iff r u_r = F(t) = R \dot{R}, \end{gather}$$
 $$\begin{gather}\dfrac{\partial u_r}{\partial t} + u_r \dfrac{\partial u_r}{\partial r} ={-}\dfrac{1}{\bar{\rho}_s} \dfrac{\partial P_g} {\partial r}, \end{gather}$$
where  $u_r$ is the radial average velocity of the granular phase and $P_g$ is the gas pressure; $F(t)$ denotes the mass flux constant along the $r$ direction and $R$ and $\dot {R}$ are the cavity radius and the velocity of the cavity boundary, respectively.
By substituting (3.1) into (3.2) and integrating from  $r = R(t)$ to $r = R_{m}(t)$, we obtain
 \begin{equation} \left( R \ddot{R} + \dot{R} ^ 2 \right) \ln{\dfrac{R_{m}}{R}} + \dfrac{1}{2} \dot{R}^2 \left[ \left( \dfrac{R}{R_{m}}\right)^2 - 1 \right] = \dfrac{P(t)-P^0}{\bar{\rho}_s}, \end{equation}
where  $P$ and $P^0$ are the average gas pressure inside the cavity and ambient gas pressure outside the cavity, respectively.
Assuming the granular medium keeps a close-packing state during cavity expansion, the area of the granular ring remains constant and is denoted as  $A_s$. Introducing a dimensionless factor $\alpha = \sqrt {1+A_s/{\rm \pi} R^2} - 1 = ({R_m}/{R}) - 1$, (3.3) can be rewritten as
 \begin{equation} \left( R \ddot{R} + \dot{R} ^ 2 \right) \ln{\left( 1 + \alpha \right)} + \dfrac{1}{2} \dot{R}^2 \left[ \left( \dfrac{1}{1+\alpha}\right)^2 - 1 \right] = \dfrac{P(t)-P^0}{\bar{\rho}_s} . \end{equation}
Second, the cavity pressure equation is derived based on the first principle of thermodynamics. For 2-D adiabatic expansion processes, considering the energy balance equation of the gas phase inside the 2-D cavity, the following equation should be satisfied:
 \begin{equation} \dfrac{{\rm d}\left( \rho_g A_c e_g \right)}{{\rm d}t} ={-}P \dfrac{{\rm d} A_c }{{\rm d}t} - \oint_{L_c} \left( \rho_g h_g u_l \right) {\rm d}l + Q_E, \end{equation}
where  $A_c={\rm \pi} R^2$ denotes the cavity area, $e_g=({1}/({\gamma -1}))({P}/{\rho _g})$ denotes the internal energy of the gas phase in the cavity and $L_c$ denotes the cavity boundary. The left-hand side indicates the accumulation rate of the gas internal energy, while the three terms on the right-hand side indicate the work due to cavity expansion, energy leak-off through the gas–granular interface and energy injection, respectively. Also, $u_l$ is the gas leak-off velocity along cavity boundary $L_c$. Since the cavity shape is circular in centrally symmetric cases, (3.5) can be simplified to
 \begin{equation} \dfrac{{\rm d}\left( \rho_g {\rm \pi}R^2 e_g \right)}{{\rm d} t} ={-}P \dfrac{{\rm d} \left({\rm \pi} R^2 \right)}{{\rm d}t} - 2 {\rm \pi}R \left( \rho_g h_g u_l \right) + Q_E. \end{equation}
 Furthermore, by applying the ideal gas equation of state  $P = (\gamma - 1) \rho _g e_g$ and $h_g = P/\rho _g + e_g$, the following pressure equation can be obtained:
 \begin{equation} {\rm \pi}R^2 \dot{P} + 2{\rm \pi} \gamma P R \dot{R} ={-} 2 {\rm \pi}\gamma R P u_l + \left(\gamma-1\right) Q_E . \end{equation}
 For isothermal expansion, the cavity gas pressure can be expressed as  $P = \rho _g R_g T^0$, where $R_g$ is gas constant. The mass-balance equation for the gas inside cavity is written as
 \begin{equation} \dfrac{{\rm d} \left(\rho_g A_c \right)}{{\rm d}t} ={-} 2 {\rm \pi}R \rho_g u_l + \dfrac{Q_E}{h_I} , \end{equation}
where  $h_I = ({\gamma }/({\gamma -1}))R_g T^0$. Therefore, the pressure equation can be obtained as
 \begin{equation} \gamma {\rm \pi}R^2 \dot{P} + 2{\rm \pi} \gamma P R \dot{R} ={-}2 {\rm \pi}\gamma R P u_l + \left(\gamma-1\right) Q_E . \end{equation}
 The forms of (3.7) and (3.9) are similar, differing only in the substitution of the adiabatic index of  $\gamma$ by one for the pressure derivative term in (3.7).
Third, for modelling the gas leak-off velocity  $u_l$ through the granular media, the linear Darcy's law is utilized for describing the relationship between the pressure drop and gas-penetration velocity for low particle Reynolds number ( $Re_p = \rho _g |u_l| d_p / \mu _g \ll 1$) cases (Devaraj Reference Devaraj2017). For higher $Re_p \gg 1$, a nonlinear modification is required to consider the nonlinear inertial migration effect. Ergun's equation (Ergun Reference Ergun1952) has been widely utilized to describe the relationship between the pressure gradient and gas-penetration velocity for high $Re_p$ and low $\alpha _g$ cases, and is expressed as
 \begin{align} -\dfrac{\partial P_g}{\partial r} &= \dfrac{150 \mu_g}{d_p^2} \dfrac{(1-\alpha_g)^2}{\alpha_g ^3} u_l^{\prime} + \dfrac{1.75 \rho_g}{d_p} \dfrac{(1-\alpha_g)}{\alpha_g ^3} u_l^{\prime} |u_l^{\prime}| \nonumber\\ & = \left( 1+\dfrac{1.75}{150} Re^*\right) \frac{\mu_g}{K_{KC}} u_l^{\prime} , \end{align}
where  $u_l^{\prime }=u_l^{\prime }(r)$ indicates local gas leak-off velocity varying with the radial distance $r$,
$r$,  $Re^* = {\rho _g |u_l^{\prime }| d_p}/{\mu _g (1-\alpha _g )}$ is the modified particle Reynolds number and $K_{KC}={\alpha _g ^3 d_p ^2}/{150 ( 1-\alpha _g ) ^2}$ is the permeability of Kozeny–Carman model.
Notably, Ergun's equation aimed to describe the non-Darcy flows, in which the pressure gradient  ${\partial P_g}/{\partial r}$ follows a quadratic formula independent of the gas leak-off velocity $u_l^{\prime }$. To calculate $u_l=u_l^{\prime }( R)$, an integral equation should be solved. An approximation method is introduced to solve this equation. To address this, the average permeability, denoted as $\bar {K} = ({150}/({150+1.75Re^*})) K_{KC}$, was introduced to obtain a more concise formula for the gas leak-off. First, Darcy flow was considered for isothermal radial systems
 \begin{equation} \dfrac{R_g T^0}{P_g} Q_{sc} ={-} \dfrac{2 {\rm \pi}r K}{\mu_g} \dfrac{\partial P_g}{\partial r}, \end{equation}
where  $Q_{sc}$ is the molar flow rate of the gas, which is constant during radial flow, and $K$ is the constant average permeability. By integrating the above equation from $r = R$ to $r = R_{m}$, the molar flow rate can be obtained as
 \begin{equation} \dfrac{R_g T^0 Q_{sc}} {K} \ln{\dfrac{R_{m}}{R}} = \dfrac{\rm \pi}{\mu_g} \left(P^2 - (P^0)^2 \right). \end{equation}
 By substituting the equation of state  $2{\rm \pi} R u_l P = R_g T^0 Q_{sc}$ into (3.12), we obtain the following $u_l$ equation:
 \begin{equation} u_l = \dfrac{K}{\mu_g} \dfrac{\left(P^2 - (P^0)^2 \right)}{2 R P \ln{ \left( 1+\alpha \right)}}. \end{equation}
 For non-Darcy flows, the effective average permeability of  $\bar {K}$ was adopted to obtain
 \begin{equation} \left(1 + \dfrac{1.75}{150} Re^*(\bar{u}_l) \right ) u_l = \dfrac{K_{KC}}{\mu_g} \dfrac{\left(P^2 - (P^0)^2 \right)}{2 R P \ln{ \left( 1+\alpha \right)}}, \end{equation}
where  $\bar {u}_l$ is the average leak-off velocity estimated as
 \begin{equation} \bar{u}_l = \dfrac{u_l+u_l(1/(1+\alpha) )}{2} =\dfrac{2+\alpha}{2+2\alpha} u_l. \end{equation}
Then,  $u_l$ can be readily calculated based on a fixed-point iteration scheme, instead of solving the integral-differential equation.
3.2. Non-centrally symmetric cases
In the context of an asymmetric scenario, our objective is to derive an angle-dependent model equation that accurately describes the evolution of the boundary radius within the cavity under varying angular conditions. The radial potential flow hypothesis is still applicable to asymmetric situations; thus, (3.1) and (3.2) are still applicable for each radial direction. Subsequently, (3.4) remains valid for describing the evolution of the cavity radius at various angles  $\theta$. The following equation can be obtained:
 \begin{equation} \left( R(\theta) \ddot{R}(\theta) + \dot{R}(\theta)^2 \right) \ln \left(1+\alpha(\theta)\right)+ \frac{1}{2} \dot{R}(\theta)^2 \left[ \left( \frac {1} {1+\alpha(\theta)}\right)^2 - 1\right]= \frac{P-P^0}{\bar{\rho}_s} . \end{equation}
For the gas leak-off velocity in each radial direction, it can similarly be modelled based on the Ergun equation
 \begin{equation} \int_{R\left(\theta \right)} ^{R_{m}(\theta) } \left( 1+ \dfrac{1.75}{150} Re^*(u_l^{\prime}(\theta,r))\right) \frac{\mu_g}{K_{KC}} u_l^{\prime}(\theta,r) \,{\rm d}r = P-P^0 . \end{equation}
For the pressure evolution equation, the gas expansion effect needs to be described based on the area and area change rate of the asymmetric cavity, while the total gas leakage amount should be integrated over the circumferential leak-off velocity. Subsequently, for the adiabatic expansion cases, the pressure evolution equation is expressed as
 \begin{equation} A_c \dot{P} + \gamma P \dot{A}_c ={-} \gamma P \int_0^{2{\rm \pi}}u_l(\theta) R(\theta) \,{\rm d}\theta + \left(\gamma-1\right) Q_E. \end{equation}
 By substituting the cavity area of  $A_c = \int _0^{2{\rm \pi} }\frac {1}{2}R(\theta )^2\,{\rm d}\theta$ into (3.18), we obtain the pressure equation as
 \begin{align} &\frac{1}{2}\dot{P} \int_0^{2{\rm \pi}}R(\theta)^2\,{\rm d}\theta + \gamma P \int_0^{2{\rm \pi}}\dot{R}(\theta)R(\theta)\,{\rm d}\theta\nonumber\\ &\quad ={-} \gamma P \int_0^{2{\rm \pi}}u_l(\theta) R(\theta) \,{\rm d}\theta + \left(\gamma-1\right) Q_E. \end{align}
3.3. Dimensionless form and dimensionless numbers
Taking the centrally symmetric scenario with adiabatic expansion as an example through dimensional analysis, the closed model equations, i.e. (3.4), (3.7) and (3.14) can be rearranged into dimensionless form as follows:
 \begin{equation} \left.\begin{array}{ll} \ln(1+\alpha) \left(R^* \ddot{R}^* + \dot{R}^{*2} \right) +\dfrac{1}{2} \dot{R}^{*2}\left[ \dfrac{1}{(1+\alpha)^2}-1 \right] = \varPi_1 \left(P^*-1\right)\\[10pt] R^{*2} \dot{P}^*+2\gamma R^* \dot{R}^* P^* = \dfrac{\gamma - 1}{\rm \pi} \varPi_2 - 2 \gamma P^* R^* u^*\\[10pt] \left(1+\beta \varPi_4\bar{u}^* \right)\ln (1+\alpha)R^*u^* = \varPi_3 \left(\dfrac{1}{P^*} - P^*\right), \end{array}\right\} \end{equation}
where  $t^* = t/t_c = tQ_E/E_T$, $R^* = R/R_m^0$, $P^*=P/P^0$, $u^*=u_l E_T/( Q_E R_m^0 )$ and $\beta =1.75/150$ is a constant coefficient in Ergun's model. Here, the average leak-off velocity is estimated as $\bar {u}^*=(({2+\alpha })/({2+2\alpha })) u^*$. The four derived non-dimensional numbers can be expressed as
 \begin{equation} \begin{split}\varPi_1 &= \frac{P^0E_T^2}{\bar{\rho}_s{Q_E^2 \left(R_m^0\right)^2}} ,\quad \varPi_2 = \frac{E_T}{P^0 \left(R_m^0\right)^2},\nonumber\\ \varPi_3 &= \frac{P^0 K_{KC} E_T}{\mu_g Q_E (R_m^0)^2}, \quad \varPi_4 = \dfrac{\rho_g^0 R_m^0 d_p Q_E}{(1-\alpha_g) \mu_g E_T}, \end{split}\end{equation}
where  $\varPi _1$ is the magnitude ratio of the work attributed to the gas pressure to the kinetic energy of the granular media; $\varPi _2$ is the dimensionless input energy, $\varPi _3$ is the magnitude ratio of gas leak-off velocity to the characteristic velocity $R_m^0 Q_E/E_T$ and $\varPi _4$ represents part of the modified particle Reynolds number, which reflects the magnitude ratio of the non-Darcy leak-off effect to the linear Darcy effect.
4. Results and discussions
In this section, we investigate the effects of three physical parameters: the injection energy rate  $Q_E$, characteristic length $R_m^0$ or $D_b$ and particle diameter $d_p$, on the cavity evolution process for centrally symmetric and non-centrally symmetric scenarios. The physical parameters and corresponding dimensionless numbers are listed in table 2. The total injection energy in all cases was kept constant, namely, $E_T=5.6 \times 10^3\ {\rm J}\ {\rm m}^{-1}$. Hence, the investigated range of dimensionless time was $0 \leqslant t^* \leqslant 1$ for these cases. For cases S1 and N1, the parameters are consistent with those in the Gao et al. experiment (Gao et al. Reference Gao, Liu, Vanin, Sun, Cheng and Gordillo2018). In case S1, the initial outer radius $R_m^0$ was set to 32 mm, similar to the buried depth $D_b$ in case N1.
Table 2. Physical parameters and dimensionless numbers for centrally symmetric cases ( ${\rm S}1\sim {\rm S}7$) and non-centrally symmetric cases ( ${\rm N}1\sim {\rm N}7$).

4.1. Centrally symmetric cases
The centrally symmetric cases are investigated by comparing the numerical solution of ordinary differential equation (ODE) set (3.20) with the 2-D simulation results. Figure 3 shows the typical cavity evolution history in the symmetric scenario. As observed, as the cavity continued to grow, the granular media appeared to be centrally symmetrical and ring shaped, with the thickness of the granular ring decreasing over time. Figure 4(a–c) demonstrates the predicted cavity radius, cavity absolute over-pressure and gas leak-off velocity, respectively. As illustrated in figure 4(a), the predicted cavity radius  $R^* = R/R_m^0$ obtained from solving the ODE set (3.20) closely matches the 2-D simulation data for all seven cases. As shown in figure 4(b), the pressure changes exhibited an initial increase followed by a decline. The rising phase corresponds to the initial stage, where the gas energy inside the cavity continues to accumulate, and the declining phase corresponds to the rapid expansion of the cavity. Note that the first stage with a sharp drop and increase in case S1 indicates the pressure transition from $P^*>1$ to $P^*<1$ in the log–log plot. When the pressure drops below ambient atmospheric pressure outside the cavity, the motion of the particle ring transitions from acceleration to deceleration. By comparing the predictions of the three-equation model with the reference results from numerical simulations, the predictions of the former were observed to be higher. This discrepancy arises because, during the derivation of the theoretical model, we neglected the inertial effects of the gas expanding outward compared with the numerical model. In the numerical simulations, owing to the inertial effect (left-hand side terms in (2.2)), more gas passed through the cavity boundary into the granular medium during the initial stage. At this point, the granular medium acts as a buffer region for the high-pressure gas. Consequently, the theoretical model's predictions of the average pressure were higher than the numerical simulation results. This explains the noticeable pre-hysteresis for the prediction of the gas leak-off rate, as shown in figure 4(c). However, this buffer mechanism, rather than a leakage mechanism, does not significantly affect the evolution of the cavity radius.

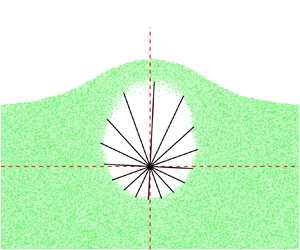
Figure 3. Snapshots of the distribution of granular particles for case S4. Particles are scattered in green points, and black solid lines indicate the radial distance from the injection point to the inner boundary of the granular ring. Here,  $x^*=(x-x_I)/R_m^0$ and $z^*=(z-z_I)/R_m^0$ are the dimensionless coordinates.

Figure 4. Comparisons between the prediction results based on (3.20) and extracted 2-D simulation data for centrally symmetric cases. (a) Solid lines indicate predicted dimensionless cavity radius,  $R^*=R/R_m^0$, and circles indicate reference simulation data; (b) solid lines indicate dimensionless cavity absolute over-pressure, $|P^*-1|$, and circles indicate reference simulation data; (c) gas leak-off velocity $U_{l,m}^*$ (solid lines: prediction results, pentagrams: reference simulation data) and granular velocity $U_{m}^*$ (dashed lines: prediction results, circles: reference simulation data) of outer boundary; and (d) predictions based on different assumptions.
To further validate the assumptions made in deriving the ODE set, three more tests were carried out with different hypotheses for case S7: test 1, isothermal gas expansion; test 2, ignoring gas leak-off; test 3, utilizing a linear Darcy model for calculating gas leak-off velocity. As depicted in figure 4(d), the isothermal test shows negligible difference between the results based on the adiabatic expansion assumption, indicating the practical applicability of either assumption. For the non-leak test, the cavity radius was significantly overpredicted because the driving force owing to the pressure drop inside and outside the granular ring was overestimated in the absence of gas leak-off. Conversely, the linear Darcy test under-predicts the cavity radius because, without considering the non-Darcy effect, the estimated gas leak-off velocity based on the linear Darcy model is larger, which over-predicts the total energy leak-off through granular media. This demonstrates the significance of the non-Darcy effect in (3.14) for high  $Re^*$ cases ( $Re^*>10^3$ in case S7). To determine the range of validity for Darcy's law, we conducted additional linear Darcy tests for cases S5 and S6. The results indicate that, when $\varPi _4 > 400$, using the Darcy model instead of the Ergun model to predict the gas leak-off velocity results in significant deviations.
The effects of the four dimensionless numbers on cavity evolution processes can be deduced by comparing the results of the seven cases. Firstly, by comparing the results of cases S1 through S3, it is evident that, with an increase in the energy injection rate  $Q_E$, $\varPi _1$ decreases, and the cavity radius gradually decreases and shifts to the right. Given that $\varPi _1$ is the coefficient of the driving force, i.e. the over-pressure $P^*-1$, $\varPi _1$ reflects the instantaneous magnitude of the driving force. A larger $\varPi _1$ corresponds to a faster response of cavity expansion. Secondly, $\varPi _2$ represents the relative magnitude of input energy compared with the work done by ambient pressure, serving as the source term in the pressure equation. By comparing the results of cases ${\rm S}3\sim {\rm S}5$, it is observed that, as the initial outer radius $R_m^0$ increases, $\varPi _2$ decreases. Consequently, the cavity radius curve gradually declines due to the lower energy input. Thirdly, $\varPi _3$ reflects the magnitude of the gas leak-off effect. Comparing the results of case ${\rm S}5\sim {\rm S}7$ reveals that, as particle size increases, the radius of the cavity gradually decreases. This is because larger particles enhance the gas leakage effect, leading to greater energy loss through the granular porous medium. Consequently, the kinetic energy acquired by the particle rings is reduced. Fourthly, $\varPi _4$ represents the particle Reynolds number, which indicates the magnitude of the non-Darcy leak-off effect.
The scaling law of  $\sqrt {t^*}$ is prominently observed in case S1, akin to the Gao et al. experiment data (figure 2). Besides, cases with a larger $\varPi _1$ develop into the scaling curve of the power law more rapidly. Furthermore, as indicated by the pressure plots in figure 4(b), a scaling curve of $t^{*-2}$ exists for cavity absolute over-pressure of $|P^*-1|$ during the latter stage in case S1. The peculiarities of this case can be further explained by simplifying the equation set (3.20).
To derive the scaling laws, the internal and external pressures can be assumed to reach an equilibrium state  $P^*\rightarrow 1$, and gas leak-off is small enough owing to the pressure equilibrium, i.e. $u^* \rightarrow 0$. Moreover, we assume that, for the pressure equation, the order of term $R^{*2} \dot {P}^*$ is much smaller than that of term $2\gamma R^* \dot {R}^* P^*$, namely $R^{*2} \dot {P}^* = o(R^* \dot {R}^* P^*)$. Then, the pressure equation implies that $R^* \dot {R}^*=C_1$, where $C_1$ is a constant related to the injection energy. This results in the scaling law $R^* = C_R t^{*{1}/{2}}$, where $C_R =\sqrt {2\varPi _2/(7{\rm \pi} )}$.
For the pressure, assuming that in the latter stage the granular ring is sufficiently thin, thus  $\alpha \ll 1$, the radius equation can be reduced into the following form based on the Taylor series expansion
 \begin{equation} \left( \alpha - \tfrac{1}{2} \alpha^2 \right) R^* \ddot{R}^* + \alpha^{2} \dot{R}^{*2} + o\left(\alpha^2\right)= \varPi_1 \left(P^*-1\right) . \end{equation}
Substituting  $\alpha = \sqrt {1+A/({\rm \pi} R^2)} \approx 1/(2R^{*2})$ and $R^* = C_R t^{*{1}/{2}}$ into the equation above, we derive
 \begin{equation} \varPi_1 \left(P^*-1\right) \approx{-}\dfrac{1}{8}t^{*-2}+\dfrac{3}{32C_R^2}t^{*-3} . \end{equation}
Notably, in the range  $4C_R^2/(3t^*) \gg 1$, the absolute over-pressure of $|P^*-1|$ approaches the scaling curve of $C_P t^{*-2}$, where $C_P = 1/(8 \varPi _1)$. Furthermore, the critical point for determining the attainment of a quasi-equilibrium state can be estimated based on the overpressure scaling law. For example, assuming that, at the critical point, the overpressure reaches a value near ambient pressure $|P^*-1| = 10^{-2}$, the critical time point can be estimated as $t_{cr}^*=\sqrt {12.5/\varPi _1}$. Particularly, $t_{cr}^*$ was 0.139 for case S1 and 0.554 for case S2, aligning closely with the curve trends.
4.2. Non-centrally symmetric cases
As shown in figure 5, in the asymmetric scenario, the cavity radius varies with different directions, and the cavity tends to develop faster towards the upper direction and forms an asymmetric oval shape.

Figure 5. Snapshots of the distribution of granular particles for case N4. Particles are scattered in green points, and black solid lines indicate the radial distance from the injection point to the inner boundary of the granular ring. Blue lines indicate the upper and lower boundaries of the cavity. Here,  $x^*=(x-x_I)/D_b$ and $z^*=(z-z_I)/D_b$ are the dimensionless coordinates.
First, we examined whether (3.16), (3.17) and (3.19) can accurately describe the evolution behaviour of an asymmetric cavity. We defined the angle corresponding to the lowest point of the cavity as  $\theta = 0$. Before calculating the evolution of the cavity radius in various angular directions with the non-centrally symmetric model equations, the outer boundary of the granular medium should be priorly specified. Based on the characteristics of the asymmetric case, we set the initial outer radius as $R_{m}^0(\theta ) = D_b (2+\cos (\theta ))^2$, in which $R_{m}^0(\theta = {\rm \pi})=D_b$ corresponds to the minimum outer cavity radius, and $\theta =0$ corresponds to the maximum $R_{m}^0(\theta = 0)$.
Figure 6 shows the final prediction results for case N1, N3, N5 and N7. For large  $D_b$ cases (cases N5 and N7), the predicted cavity shape is very close to the reference results from the numerical simulations. For the small $D_b$ case, the predicted cavity shape differs from the simulation results. We further examined the comparison results for the effective cavity radius, which is defined as $R_{eff}$ = $\sqrt {A_c/{\rm \pi} }$. The time-dependent curves of $R_{eff}^*=R_{eff}/D_b$ for seven cases are shown in figure 6(e). The results indicated that the predicted effective cavity radius still aligns with the simulation results. Furthermore, similar to symmetric case S1, the scaling law of $R_{eff}^* = C t^{*{1}/{2}}$ can be recognized in case N1.

Figure 6. Comparisons between the prediction results based on asymmetric model equations (3.16), (3.17), (3.19) and extracted 2-D simulation data for non-centrally symmetric cases. (a–d) Cavity outlines  $R^*=R(\theta )/D_b$ of case N1, N3, N5 and N7; (e) effective cavity radius $R_{eff}^*=R_{eff}/D_b$ of case ${\rm N}1\sim {\rm N}7$, where solid lines and circles indicate model prediction results and reference simulation data, respectively.
In case N1, the deviation between the theoretical equation's predictions and the numerical simulation results arises from the assumption of radial potential flow used in deriving the model equations. This assumes that the particle medium only moves radially with zero tangential velocity along the circumferential direction. This strong assumption is not strictly satisfied. Particularly, in case N1, a long range exists where  $P^* < 1$, indicating that the granular ring experiences a prolonged deceleration process. During this process, because of the thinner particle layer in the upper half of the asymmetric cavity ( ${\rm \pi} /2<\theta <3{\rm \pi} /2$), the upper half of the asymmetric cavity was easily compressed by the ambient pressure and deformed towards the central axis, resulting in a higher curvature in the upper half of the cavity. This mechanism cannot be considered in the radial potential flow model, leading to deviations in the cavity shape. This deviation has no significant effect on the prediction of the effective cavity radius.
Alternatively, we can describe the equivalent cavity radius  $R_{eff}$ through the equation set (3.20) for the symmetric scenario by introducing some modifications. It is considered that the evolution of a symmetric circular cavity with radius $R_{eff}$ is equivalent to the evolution of the investigated asymmetric case. To achieve such equivalency, one more modified factor should be introduced to remedy the larger outer radius owing to the thicker granular layer at the bottom of the cavity. The modified asymmetrical shape factor is defined as
 \begin{equation} \delta = \sqrt{\frac{A_{s,app}}{{\rm \pi} D_b^2}} = \frac{R_{m, eff}^0}{D_b}, \end{equation}
where  $A_{s,app}$ and $R_{m,eff}^0$ are the apparent driven areas of the granular media and the effective initial outer radius, respectively, for the asymmetrical scenario. The dimensionless numbers in the asymmetric cases are calculated using $D_b$ instead of $R^0_m$. In this study, the shape factor $\delta$ is set to 2.0. Except for this modification, other parameters, including the particle density and the initial conditions of gas density and pressure, were set similar to those in the symmetrical cases.
Figure 7(a) demonstrates the comparison between predicted curves of effective cavity radius by (3.20) and reference data for seven cases;  $\delta =2.0$ is notably a suitable estimate for modifying the initial outer radius in most asymmetrical cases. The average error of the prediction results of the 18 cases compared with the simulation data was less than 5 % (see supplementary materials for details). Figure 7(b) showed the comparison result among predictions based on alternative assumptions. For non-centrally symmetric cases, the difference between the predictions based on either adiabatic or isothermal expansion was negligible. Moreover, the simulation setting for case N1 was based on a physical experiment (Gao et al. Reference Gao, Liu, Vanin, Sun, Cheng and Gordillo2018). The predicted results align with the experimental data. The proposed ODE set was also proven suitable for predicting the effective radius for asymmetric cases.

Figure 7. Comparisons between the prediction results (solid lines) of  $R_{eff}^*$ based on equivalent symmetric model equation set (3.20) and extracted 2-D simulation data (circles) for non-centrally symmetric cases. (a) Effective cavity radius $R_{eff}^*$; (b) predictions based on different assumptions.
5. Conclusions
A closed three-equation model is proposed to quantitatively predict the temporally varying cavity size in granular media. The prediction results of the centre-symmetric and asymmetric scenarios were compared with the refined Eulerian–Lagrangian simulation data, and the following conclusions were drawn:
(i) Three individual equations for cavity radius, cavity pressure and gas-penetration velocity are dispensable for describing the cavity evolution process in granular media, and comprise the closed dynamic ODE system. The proposed model is compatible with either an adiabatic or isothermal gas expansion assumption, with the only variation being the coefficient of the pressure derivative term. There is no significant difference in the prediction results regardless of which assumption is adopted within the investigated parameter range in this work.
(ii) Four dimensionless numbers are derived from the three-equation model, each reflecting different aspects of the system: the relaxation time of cavity expansion, the input energy magnitude, the energy leak-off magnitude and the magnitude of the non-Darcy effect during gas penetration. Specifically, the critical time distinguishing the non-equilibrium and power-law scaling stages is estimated by the first dimensionless number $t_{cr}^*=\sqrt {12.5/\varPi _1}$. Numerical tests indicate that the non-Darcy effect must be considered when $\varPi _4 > 400$.
(iii) The proposed model is verified for both centre-symmetric and asymmetric scenarios. Specifically, for asymmetrical cases where the injection inlet is buried beneath the granular surface, two different modelling strategies were proposed to predict the radially varying cavity radius and the effective cavity radius. Particularly in the latter strategy, a modification shape factor of
$\delta = 2.0$ is introduced regarding the equivalency with the evolution of centrally symmetric cavities.


This study mainly focuses on the initial cavity expansion process. The subsequent stage, that is, cavity collapse, exhibited more complex behaviours such as diverse jetting patterns near the granular interfaces. In future studies, the proposed ODE model will be leveraged to deepen our understanding of the various jetting paradigms and mechanisms involved in these processes.
6. Supplementary materials
6.1. Extraction of cavity outlines from experimental data (Gao et al. Reference Gao, Liu, Vanin, Sun, Cheng and Gordillo2018)
As illustrated in figure 8, the initial cavity outlines from various frames are manually marked, and the cavity areas can be estimated by calculating the areas of polygons formed by the outlines. The effective radius is then estimated using  $R_{eff} = \sqrt {A_c/{\rm \pi} }$, where $A_c$ is the area of the cavity. Only 12 snapshots are shown in figure 8, while we extracted 24 data points from the video.

Figure 8. Snapshots of experimental video (Gao et al. Reference Gao, Liu, Vanin, Sun, Cheng and Gordillo2018) of explosive cavity evolution from  $t = 10$ to $t = 120$ ms (time interval is 10 ms). Red dots indicate manually marked cavity outlines.
6.2. Recovery of 3-D close-packing limit in 2-D simulations
The validation test for numerical simulation in this work is based on 2-D simulations aimed at replicating 3-D experimental results in previous literature. A crucial part of the initial condition set-up was the initial particle packing, particularly for recreating the initial dense packing limit of the 3-D particles. For monodisperse particle periodic packing, the dense packing limit of 3-D spherical particles in three dimensions is  ${{\rm \pi} }/{3\sqrt {2}}\approx 74.05\,\%$, whereas in two dimensions, the dense packing limit of 2-D circular particles is ${\sqrt {3}{\rm \pi} }/{18}\approx 90.69\,\%$, as illustrated in figure 9. The significant difference between these two values indicates that the dense disk packing obtained from 2-D simulations cannot be directly used to represent a 3-D particle packing situation.

Figure 9. Sketch of 2-D solid disk radius and effective parcel radius.
To solve this issue, we adopted an effective collision radius strategy for contact and collision calculations among granular parcels. As shown in figure 9, for the dense packing of 2-D ‘solid’ disks, the collision radius is consistent with the true physical radius, resulting in a packing limit of  $90.69\,\%$. In this study, the basic concept of parcels was adopted for describing the granular phase. Each parcel carries a certain volume of particles, and collisions between parcels are modelled and resolved using the CG-DEM. However, a critical parameter for the effective collision radius must be specified. In a 2-D parcel, the effective collision radius is defined as $\sqrt {{V}/{{\rm \pi} d}}$, where $V$ is the parcel volume and $d$ is the disk width. This ensures that the contact patterns between the parcels are identical to the packing of solid disks. However, if the effective collision radius is increased, as shown in figure 9, we can achieve any desired packing limit for the initial distribution of particles in two dimensions. Assuming that the desired packing limit is $\alpha _{{p,d}}$, the collision radius can be determined as follows:
 \begin{equation} R_{c}=\sqrt{\dfrac{\alpha_{p}^{cp}}{\alpha_{p}^{d}}}\sqrt{\dfrac{V}{{\rm \pi} d}} , \end{equation}
where  $\alpha _{p}^{cp}$ is the close-packing limit of 2-D disks for monodisperse systems and $\alpha _{p}^{cp}=90.69\,\%$. For polydisperse systems in which the collision radii of the parcels are different, $\alpha _{p}^{cp}$ should be priorly estimated based on simulation tests.
Then for the initial configuration of granular phase, the following three steps are conducted:
(i) Setting initial lattice configuration. Parcels with uniformly distributed effective parcel radii were initially placed in order on an
$800 \times 800$ lattice grid within the simulation domain without contacting each other. The use of uneven parcels avoids hexagonal crystallization, which may lead to the preferential development of granular force-chain structures.(ii) Gravitational settling. Subsequently, the parcels undergo gravitational settling with a specified downward acceleration and are randomly packed with each other. Owing to the damping effects of parcel–parcel interactions, the granular system finally reaches static equilibrium and forms a granular bed with a packing height denoted by
$H_i$.(iii) Resetting parcel radius and clipping. Owing to the significant difference between 2-D close-packing limits and 3-D limits, our study numerically simulates a 3-D experiment based on 2-D simulations. Thus, the effective parcel radius was adjusted by multiplying it with the conversion factor of
$\sqrt {\alpha _{p}^{cp} / \alpha _{p}^{d}}$ to recover a realistic experimental setting. The average particle volume fraction $\alpha _p^d$ of the close-packed granular disks was set to 60 %. Subsequently, for different scenarios, the desired initial configuration of the parcels was set by clipping the prepared close-packed granular bed.


6.3. Comparison of effective cavity radius prediction with numerical reference data
We carried out 18 more non-centrally symmetric cases, and the simulation parameters are listed in table 3. In these cases, the characteristic time  $t_c$ was constant, as used in the manuscript. However, the investigated time range increases to $0\leq t^* \leq 4$. Comparisons of the effective cavity radius predicted from the equivalent circle model and the simulation results are shown in figure 10.
Table 3. Physical parameters and dimensionless numbers of 18 additional non-centrally symmetric cases.


Figure 10. Comparisons between the prediction results (solid lines) based on (3.20) and extracted 2-D simulation data (circles) for 18 non-centrally symmetric cases.
Funding
The National Natural Science Foundation of China, Nos. 12202072, 12172156, 12472262 and 12432012; the Strategic Priority Research Program of Chinese Academy of Sciences, No. XDB0620203.
Declaration of interests
The authors report no conflict of interest.


