


Introduction
Thwaites Glacier (TG) is the second largest ice stream in the Amundsen Sea sector of the West Antarctic ice sheet (WAIS), rivaled only by its immediate neighbor Pine Island Glacier (PIG). Surface velocities past the grounding line of TG are the fastest observed in Antarctica. TG forms a large floating tongue, approximately 40 kmwideand100 km long (Fig. 1) that undergoes periodic calving. The timing of the recent calving of TG Tongue in February 2002 (Fig. 8), nearly coincident with a large calving event of PIG (R. A. Bindschadler, http://nsidc.org/iceshelves/pine__island/) has raised the question whether global climate warming could have reached this region and triggered the events. The ongoing debate on the possible inherent instability of this part of the WAIS (e.g. Reference HughesHughes, 1973; Reference Fastook, Hansen and TakahashiFastook 1984; Reference BentleyBentley, 1998) has called for long-term monitoring of TG and PIG.

Fig. 1. Location map. ERS SAR backscatter mosaic of lowerTG. Feature-tracking profiles are shown asdots, each dot representing an individual measurement location. Two black crosses, respectively, indicate a nunatak and a small rock island that were used to check the accuracy of the feature tracking. The black line delineates the grounding-line position.
Using radar altimetry for the period 1992–96,Reference Wingham, Ridout, Scharroo, Arthern and ShumWingham and others (1998) found a drop in ice-sheet surface elevation in the upper catchments of TG and PIG on the order of –0.1ma−1. Previous observations on PIG are summarized in Reference Vaughan, Alley and BindschadlerVaughan and others (2001). Further signs of currently unstable ice flow have been observed for the lower part of PIG. The ice surface there has dropped on the order of 1m (Reference Shepherd, Wingham, Mansley and CorrShepherd and others, 2001), and surface velocity has increased by about 15% during the last decade (Reference Rignot, Vaughan, Schmeltz, Dupont and MacAyealRignot and others, 2002; Reference Rabus and LangRabus and Lang, 2003). Internal forcing appears to cause these current changes of PIG.
Observations for TG differ from those for PIG. Landsat (T. A. Scambos andJ. Bohlander, http://nsidc.org/data/velmap/pine__getz/thwaites/thwaites.html) and synthetic aperture radar (SAR) sensors (Reference Rosanova, Lucchitta and FerrignoRosanova and others, 1998) were used to measure the surface velocity of the floating TG Tongue with feature tracking. Comparison of the two studies suggested an increase in flow velocity since the 1980s, but the comparison is problematic due to differing sensor viewing geometries and coordinate reference systems. Measuring velocity two-dimensionally with SAR interferometry, Reference Rignot, Vaughan, Schmeltz, Dupont and MacAyealRignot and others (2002) found acceleration on the periphery of the lower TG for the period 1996–2000. The flow of the main glacier trunk, however, appeared to be stable during this period. In an approach complementary to that of Reference Rignot, Vaughan, Schmeltz, Dupont and MacAyealRignot and others (2002), we use time series of feature-tracking velocity measurements along longitudinal profiles (Fig. 1) to analyze the flow of the main trunk of TG during the last decade. To infer the forcing behind the velocity changes we find for the floating TG Tongue, we look for correlation with time series of grounding-line position and European Centre for Medium-RangeWeather Forecasts (ECMWF) meteorological data.
Methods
As in the related study on PIG (Reference Rabus and LangRabus and Lang, 2003) we use feature tracking on geocoded European Remote-sensing Satellite (ERS) SAR amplitude geocoded ellipsoid corrected (GEC) pairs for measuring ice velocities. Further, we use repeat mapping in differential SAR interferograms to monitor the position of the grounding line. Both methods, feature tracking and repeat mapping, require accurate geo-registration of SAR images. An error analysis for both methods including relevant details of image geo-registration has been presented in Reference Rabus and LangRabus and Lang (2003). The geo-registration does not use ground-control points.
Feature-tracking velocity measurements
Feature tracking on interannual time-scales uses surface features such as crevasses that are passively advected with glacier flow. In contrast to interferometric velocity measurements, the feature-tracking method represents a longer time interval (months vs days) and gives absolute velocities without requiring reference points of known velocity. Also, no corrections due to tidal motion or topography are necessary. Disadvantages of the feature-tracking method are the lower spatial resolution as well as the presence of high random scatter in the results. The resulting accuracy for velocity averages along longitudinal profiles of about 100 measurement points and a minimum time separation of 105 days is 25 ma−1 (Reference Rabus and LangRabus and Lang, 2003).
The use of a constant reference elevation h0 = 0 during projection of the GECs introduces an additional velocity bias in the feature tracking.This bias depends on the deviationΔ h of terrain elevationwith respect to h0 aswell as the perpendicular baseline and time separation Δt of the feature-tracking pair (see Reference Rabus and LangRabus and Lang, 2003, equation (1)). Table 1 lists this velocity bias for all feature-tracking pairs used in this study. Due to the flat topography of TG Tongue the bias is smaller than the method-inherent randomerror of 25ma-1 even for unfavorable combinations of > Δh and Δt. ForTG the accuracy of feature-tracking results was checked at two locations, a large nunatakon the west side of TG and a rock island seawardofTGTongue, both of which should have no surface motion (marked with cross-symbols in Fig. 1). For all GEC pairs in Table 1, these points come out stationary to better than half a pixel (6.25m), in accordance with the expected errors listed in Table 1.
Table 1. Velocity biases due to terrain elevation differences Δ z with respect to GEC reference elevation zref = 0 m

Mapping of grounding-line location
For mapping the grounding-line location of TG, there is insufficient repeat coverage of differential interferometric data for the grounding line of the main glacier tongue. Instead we monitor the grounding line of a small ice shelf (50×50 km2) at the eastern side of the main glacier tongue (subsequently called Thwaites East Glacier, or TG-East), which has good data coverage and is fed by the only tributary of the TG drainage basin that fails to join the main glacier trunk before the latter reaches the sea (O. Lang and others, unpublished information). ERS single look complex (SLC) data used to form the differential interferograms are compiled in Table 2.
Table 2. SLCs grouped according to differential interferograms used for the repeat mapping of the grounding line

TG-East shares the same oceanographic regime as the main tongue, and is equally sensitive, or more so, to changes of ice thickness or sea level. Consequently, grounding-line changes will likely reflect changes of oceanographic conditions but possibly not the ice dynamics of the main glacier trunk. Velocities at the grounding line are 1km a−1 at TG-East compared to 3.5 km a−1 on the main glacier tongue.
Misplacement errors due to ephemeral migration of the grounding line with tide level were found to be similar for PIG and TG-East (Reference Rabus and LangRabus and Lang, 2002). Consequently, we use the value of 400m estimated for PIG by Reference Rabus and LangRabus and Lang (2003) as the accuracy for locating the grounding line of TG-East.
Results
Velocity magnitude measured with the feature-tracking method along profiles TG1,2,3,4 is shown in Figure 2a. Temporal coverage is March 1992–October 2000. According to these measurements, the floating portion of TG undergoes temporal velocity variations on the order of 10% of the mean velocity (Fig. 2b). Velocity differences diminish up-glacier and become insignificant 520 km above the grounding line. Figure 2b shows that the TG velocity decreased up to 1997 and has been increasing since.

Fig. 2. Velocity magnitude along longitudinal feature-tracking profiles; labels refer to Figure 1. (a) Spatio-temporal distribution of velocity magnitude; (b) velocity magnitude as a function of time averaged over profileTG4 (on the floating part of TG).
The described spatio-temporal distribution of velocity variations of TG is markedly different from that found for PIG (Reference Rabus and LangRabus and Lang, 2003). PIG showed constant acceleration extending 480km up-glacier of the grounding line, which suggested internal forcing of the velocity variations (Reference Rabus and LangRabus and Lang, 2003). The velocity variations of TG are similar in magnitude but cyclical and largely restricted to the floating part of the glacier. From Figure 2a it seems unlikely that the velocity variations of TG are caused by glacier dynamics inland of the grounding line.The observed velocity variations along TG3 and TG4 on the floating glacier tongue are weakly reflected in the TG2 velocity variations above the grounding line, but this effect is seen to dampen out completely <30km inland of the grounding line.
Grounding-line position of TG-East
Changes of the grounding-line position of TG-East (Fig. 3) appear uncorrelated with the velocity variations of TG Tongue. The grounding line of TG-East was stagnant from 1994 to 1996, but by 2000 it had retreated by about1km.Most likely, the latter retreat took place from 1999 to 2000, when significant disintegration was observed onTG-East shelf. In 1999 the configuration of TG-East was still very similar to that in Figure 1, while in 2000 it had already changed to the configuration visible in Figure 8a and b. Partial disintegration and grounding-line retreat of TG-East would be consistent with the acceleration observed by Reference Rignot, Vaughan, Schmeltz, Dupont and MacAyealRignot and others (2002) for this region. As with the main trunk of PIG (Reference Rabus and LangRabus and Lang, 2003), it is difficult to decide whether the acceleration of TG-East causes the shelf disintegration (internal forcing) or, alternatively, is caused by reduction of ice-shelf back pressure (external forcing).

Fig. 3. Fluctuations of grounding-line position of TG derived from differential interferometric measurements. (a) Sketch maps showing reference grounding-line position (solid line) plus grounding-line position at other times along a common sub-segment; (b) mean grounding-line position with respect to the reference along the chosen sub-segment.
To some extent, the changes onTG-East may have influenced the timing of the later calving of TG Tongue, but they are probably unrelated to the observed velocity variations of the mainTG trunk (Fig. 2).The likely source of these velocity variations is external forces exerted by oceancurrents, and/or wind on the free-floating tongue and its seasonal apron of land-fast sea ice. Vulnerability to external forcing is great because most of the 50 km wide TG Tongue is separated from the grounded ice sheet by a “grounding-line crevasse” only the eastern 15km section shows tidal flexure because floating and grounded ice are continuously linked.
Rotation of TG Tongue
A rotational degree of freedom of TG Tongue was first noticed in differential interferograms (Reference Rabus and HoffmannRabus and Hoffmann, 1998). Besides the belt of dense parallel phase fringes that represents tidal flexure near the grounding line, the main TG Tongue shows a pattern of near-equidistant fringes that are approximately parallel to the satellite look direction for both ascending and descending orbit geometry. This fringe pattern, which is typically seen on free-floating icebergs or sea-ice floes, must be interpreted as a change of rotation rate of TG Tongue.The change of rotation rate cannot be simply related to tidal motion as is concluded by Reference RignotRignot (2001).This is seen by comparing differential tidal amplitudes (as represented by the number of fringes in the belt of tidal flexure) with the number of look-parallel rotational fringes on the tongue. Reference Rabus and HoffmannRabus and Hoffmann (1998) found several examples where small differential tidal amplitudes occur together with large changes of the rotation rate and vice versa. Other than excluding a tidal origin, the analysis of differential interferograms is of limited use for studying the externally forced motion of TG Tongue because all steady motion (including a constant rotation) has been cancelled. Instead, unrepresentative short-term motion changes within the acquisition periods of the single interferograms (1 or 3 days) dominate the differential interferogram.
To investigate whether longer-term changes of rotation rate not visible with differential interferometry cause the observed interannual variations of velocity magnitude, we use the feature-tracking technique. We compare variations of the velocity vector along TG4 with variations along two additional profiles, TG4-west and TG4-east, located about 10 km west and east of TG4 (Fig. 1). In Figure 4 we show the deviations of the velocity vectors of eight successive feature-tracking periods with respect to the 10 November 1999 to 23 February 2000 period. This result immediately reveals that TG Tongue is affected by external forcing that varies on interannual time-scales. The forcing must be roughly coast-parallel (i.e. approximately perpendicular to the flow direction on the tongue), and its “period” seems to be on the order of about 3–4 years. The main contribution to the velocity vector difference seems to be a rigid-body rotation, but signs of deformational contributions are also visible in Figure 4.

Fig. 4. Temporal changes of the horizontal velocity vector along profiles TG4, TG4-east andTG4-west relative to the 31 October 1995 to 19 March 1996 feature-tracking pair. Note that rotation sense is clockwise for all panels, despite the fact that relative velocity vectors are pointing counter clockwise.This is due to the reference feature-tracking pair having the strongest clockwise rotation rate of all pairs. Also shown for each panel is shear plane orientation and center of rotation (including 95% confidence ellipse) calculated from the parameters in Figure 8.
Vector analysis of the motion of TG Tongue
In the following, we carry out a quantitative separation of the velocity vector field of TG Tongue along TG4-west, TG4,TG4-east according to rigid-body rotation ω , uniform divergence δ, and unilateral shear σ along a shear plane perpendicular to the xy-plane and at an angle ’ σ to the x axis.
We consequently hypothesize that the non-translational part of the velocity vector v can be written as

with (cσ, sσ) = (co s ’σ, s in ’σ) being the directional vector of unilateral shear, and (xω; yω ), (xδ; yδ ), (x δ; yδ) being the center of rotation and divergence, and the pin point of the shear plane, respectively. One of the parameters xδ, yδ is arbitrary and we can choose, for example, xσ = xω, i.e. describe the location of the shear plane relative to the rotation center. We now use the relations

with curl(vx, vy ) = vxy-vyxto calculate the invariants r 1–r4 from two parallel velocity profiles using the Stokes theorem

with

on a cell of four data points arranged according to Figure 5. a denotes the area between the four data points. The equation system (2) can be inverted according to
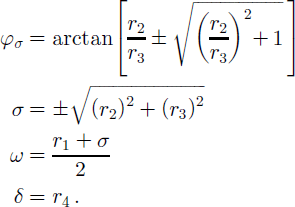

Fig. 5. calculation scheme for invariants r1to r4 starting with point 1 on the first profile, point 2 is constructed as nearest neighbor on the second profile. then point 3 on profile 2 is found at a distance similar to that between points 1 and 2, and finally point 4 is found as nearest neighbor to point 3 on the first profile. a denotes the area between points 1,2,3,4.
The inversion is carried out for all data points of profile TG4, and the mean of all results is subsequently taken. Two separate calculations are carried out, with TG4-west and TG4-east as partner profiles to TG4, respectively. After the parameters ω , σ, ’ σ and δ have been calculated they can be input to Equation (1), and all the remaining parameters theoretically can be found by carrying out a least-squares fit to the data. I n reality, only the rotation center (xω,yω) can be determined accurately because the fit is almost completely insensitive to variations of xδ, yδ, yσ (for simplicity we set xδ = xω, yδ = y ω, yσ = yω). Results from the inversion (4) are shown in Figure 6; the shear plane orientation is also shown in Figure 4 together with the fitted rotation centers. Random errors, obtained by propagating errors estimated before for the feature-tracking data through Equations (3) and (4) are 0.1° a−1, 2 × 10⁻³ a−1, 5° and 2 × 10⁻³ a−1 for ω , σ, ’ σ and δ, respectively. For clarity, the vertical error bars are not shown in Figure 6. Comparison of the values for TG4-east and TG4-west calculations for ω , σ, ’ σ and δ allows separate judgment of the validity of the assumptions in Equation (1), i.e. to what extent the rotation is rigid, the shear is unilateral and the divergence is uniform. Differences between the two calculations that exceed the respective random errors indicate spatial variations transverse to the profile direction.

Fig. 6. Calculated time series of angular velocity (a), shear strength (b), shear angle (c) and divergence (d).
In Figure 6a, transverse differences of the angular velocity ω are usually ≤ 0.1°a−1, consistent with the calculated error. This suggests that a main component of the externally induced motion of the glacier tongue is a rigidbody rotation. The sign is (+) for clockwise and (–) for counterclockwise rotation. The angular velocity decreases from + 0.5° a−1 in 1996 to –0.25° a−1 in fall 1997 and then abruptly increases again, reaching values around +0.85° a– in 2000. This corresponds to a clockwise net rotation of ∼ 0 . 9 ° during 1996–2000, which caused a ∼1.6 km eastward displacement of the ice front (assuming an approximate distance of 100 km from the rotation center near the grounding line). Note that the velocity fields of Figure 4 all show counterclockwise rotation because they are evaluated relative to feature-tracking pair 9 in Figure 6, which has the largest positive (clockwise) rotation rate.
For the shear and divergence parameters in Figure 6b–d, considerably larger differences between TG4-east and TG4-west calculations occur. Individual differences are, however, largely within the higher random-error bands of these parameters. This also explains apparent inconsistencies for feature-tracking pairs whose periods are contained in a pair with a longer period. Results for pairs 2 and 4 sometimes do not bracket the result for 3, and similarly those for 7 and 9 do not always bracket that for 8, but the observed inconsistencies do not exceed the calculated random error.
Figure 6b and c show that the shear parameters a and φp have extrema that correspond with the late-1997 minimum of the angular velocity. Shear was strongest and oriented steepest with respect to the coastline during this minimum. As a consequence, extension (due to shear), which is oriented at «45° to the shear plane, also was strongest and most closely aligned with flow direction during that time. Increased extension in the flow direction is of particular interest because it eases the formation of transverse rifts that could lead to calving of the tongue. Figure 6b and c further show that the assumption of unilateral shear is not valid. There is a weak trend of a being more negative on the east side of the glacier and a more significant trend that φσ was consistently about 15° lower (i.e. shear is more shallow with respect to the coastline) there for the later part of the observation period. Before 1997 the φσ on the east side seems, however, to have been slightly higher than that on the west side. The observed turning of the shear plane through the tongue from west to east describes a clockwise deformational rotation during the later part of the observation period. The larger shear angles for the west side place the shear plane at approximately 45° with respect to the flow direction there. The resulting extension in flow direction is consistent with the more dissected visual appearance of the western margin of the tongue (Figs 1 and 4) and also with the higher flow velocities observed there (see two-dimensional velocity field corrected for rigid rotation in Reference Rabus and LangRabus and Lang, 2003). Figure 6d shows that there is a significant trend towards increasing divergence throughout the observation interval. As the western section of TG Tongue appears more susceptible to divergence and disintegration, somewhat larger values of 6 should be expected there. If present, such a transverse variation must be insignificant against the corresponding random error.
External forcing of TG Tongue
In summary, the time-variable part of the motion of TG Tongue is well described as a rigid body rotation plus a weaker deformational contribution from shear/divergence. The changes in ocean currents and wind fields suspected to provide the external forcing for the time-variable motion can be of either local or regional/synoptic-scale origin. To check for the latter case, we investigate a time series of synoptic-scale meteorological model data available through ECMWF Wind speed, wind direction, and air pressure at sea level are first spatially averaged over a 3° by 7° latitude–longitude matrix (spacing 0.5°) and then temporally averaged with a Gaussian window of width 1year. We expect that changes of synoptic-scale wind and ocean currents will be significantly correlated for such a long temporal averaging window. The resulting time series are shown in Figure 7. Wind direction shows a significant linear trend and a remarkably regular oscillation with a period of about 4 years. Over the 12 year period shown, the west-southwesterly wind direction turned from about 35° to 5 20° with respect to the east–west axis (in the figure the angle is given relative to the x axis of Figures 1 and 5 instead of the east–west axis). Wind speed shows a corresponding linear trend, with values of 8 and 4 ms – 1 in 1988 and 2000, respectively. Short-term oscillations are less regular than those of the wind direction. A i r pressure, finally, does not show a significant trend or oscillation. Both wind direction and wind speed show a pronounced minimum around 1998 in correspondence with the rotation and shear parameters in Figure 6. While this is a very interesting coincidence, the record in Figure 6 is really not long enough to positively identify synoptic-scale changes of the wind field in the Amundsen Sea as the original source of the velocity variations of TG Tongue. The record of the actual variations of velocity magnitude in Figure 2b is longer than the sub-period in Figure 6, but, due to gross undersampling, the period 1992–96 unfortunately does little to contradict or corroborate such an interpretation. From velocity data obtained by T. A. Scambos and J. Bohlander (http://nsidc.org/data/velmap/pine__getz/thwaites/thwaites.html) through feature tracking on Landsat data, one can construct for Figure 4 one additional data point for 1989 (representing the period 1988– 90) with 2.9±0.1kma−1. Whether this considerably lower velocity reflects the observed linear trends in the synoptic-scale wind data, or alternatively is just an effect of the changing geometry of the tongue, is again uncertain. The tongue was 430km shorter at this time and therefore could have reacted very differently to oceancurrents and wind fields.

Fig. 7. time series of wind direction, wind magnitude, and air pressure at mean sea level calculated from ecmwf 6 hour data over a 3° by 7° latitude–longitude ocean area that includes tg tongue.
2002 calving event of TG Tongue
Figure 8 shows the calving of a 40×80 km2 iceberg fromTG Tongue in early 2002. Prior to calving, the tongue had a length of about 120 km. Calving of TG Tongue is a quasi-periodic event. The last large calving occurred in the 1940s (Reference Ferrigno, Lucchitta, Mullins, Allison, Allen and GouldFerrigno and others, 1993). The length of the tongue had exceeded 140 km prior to this earlier event, judged from the extent of the iceberg produced in Landsat imagery. The iceberg (denominated B-10A) stayed loosely attached to TG for several decades before moving north. Remnants of B10-A still drift in the South Polar Sea. Several smaller calving events were recorded (Reference Swithinbank, Ferrigno, Seekins, Lucchitta and RosanovaSwithinbank and others, 1997) while the formation of a new tongue was still disturbed by the presence of the older tongue. From 1988 onwards, the length of TG Tongue had increased continuously.

Fig. 8. Calving of TG Tongue. (a,b) Situation on 18 January 2002 (a) and 7 March 2002 (b).The orientation and migration of the crack that led to the calving event is consistent with the observed continued clockwise rotation of TG Tongue around a mean rotation center at the east side of the tongue. The calving crack started at the west side of the tongue and headed towards a zone of scars, which first appeared about 7 years earlier (see Fig. 1 representing the situation on 31 October 1995). (c) Lower right is a blow-up of the 31 October 1995 amplitude image that shows details of the scars. Upper left is a corresponding differential phase image, 8/9 February 1996 to 14/15 March 1996, that shows the grounding line of the ice rise on the east side of TG Tongue.
Figure 8a and b show the situation on 18 January and 7 March 2002, respectively. Unfortunately, the ERS acquisition campaign did not acquire data prior to 14 January 2002.The earliest image from 14 January (not shown) has poor data quality due to a receiver problem, but visual inspection revealed that the crack was already present and only a few km shorter than on the18 January image. Nevertheless, the typical exponential growth pattern of calving cracks (e.g. R. A. Bindschadler, http://nsidc.org/iceshelves/ pine__island) suggests that crack initiation in late 2001 is most probable. The orientation and propagation of the crack is consistent with the observed continued clockwise rotation of TG Tongue around a mean rotation center at the east side of the tongue. The calving crack started at the west side of the tongue and headed towards a zone of scars, which first appeared about 7 years earlier (see Fig. 1 representing the situation on 31 October 1995). Figure 8c, lower right, is a blow-up of the 31 October 1995 amplitude image that shows details of the scars. Figure 8c, upper left, is a corresponding differential phase image, 8/9 February 1996 to 14/15 March 1996, that shows the grounding line of the ice rise on the east side of TG Tongue. Coincidence of location suggests that the formation of the “scar” was caused by interaction with the ice rise around 1995.
Conclusion
Using a simple feature-tracking technique on ERS amplitude images, we have shown that the lower part of TG shows interannual surface velocity variations with a period of 2–4 years. The amplitude of the variations is 10–15% on the floating TG Tongue but dampens out completely 520km up-glacier of the grounding line. The flow of the grounded part of the main TG trunk seems to be currently stable. At the accuracy level of the method (∼25 m a−1), there is also no indication of seasonal variations there.
The velocity variations of TG Tongue can be explained as a rigid-body rotation plus a non-negligible spatially inhomogeneous shear/divergence contribution. The net rotation direction is clockwise; the center of rotation is situated at the east side of the tongue, not far from a small ice rise situated about 20 km from the grounding line. The recent calving event of TG Tongue (January 2002) is consistent with the continued clockwise rotation of TG Tongue. Calving was initiated by a crack propagating from west to east into a structurally weak zone of crevasse scars that likely had formed by interaction of TG Tongue with the ice rise about 7 years earlier.
The external forcing for the extra motion superimposed on the steady translational flow of TG Tongue is most likely provided by changes of ocean currents and/or wind fields. An ECMWF time series of wind direction shows a regular oscillation with an amplitude of 10° and a period of 4 years. The time series appears to be in phase with the velocity oscillations of TG Tongue, and this may suggest a synoptic-scale origin of the external forcing. More data are needed to corroborate this result. I f it is confirmed, glacier tongues elsewhere in Antarctica are expected to show similar behavior.
Acknowledgements
We are grateful for continued support by the German Remote Sensing Center (DFD-DLR). Particular thanks go to S. Dech for stimulating discussions on the nature of the velocity variations of Thwaites Glacier, to K. Reiniger and his team for processing the ERS SAR data and to M. Eineder and his team for providing support on the interferometric processing system GENESIS. Some of the material presented in this study was prepared by M. Mueller as part of his master thesis; we want to thank him very much for his enthusiasm and the good collaboration.


