


Breast cancer accounts for 25 % of all cancers among women worldwide, ranking first in incidence and fifth in mortality among women in 2012( Reference Ferlay, Soerjomataram and Dikshit 1 ). The 5-year relative survival rate in developed countries is over 80 % (88·9 % in the USA, 87·7 % in Canada and 87·3 % in Japan)( 2 ). In Korea, the age-standardised incidence of breast cancer has increased continuously over time, becoming the second most common cancer in women (44·7 cases/100 000 women in 2012). The 5-year relative survival rate was 91·3 % from 1993 to 2011 in Korea( Reference Jung, Won and Kong 3 ), which was higher than that in the USA, Canada and Japan( 2 ). Although improvements in the diagnosis and treatment of breast cancer can prolong survival, there is still a relatively high recurrence rate of breast cancer after the 5-year survival period compared with the rates for cancers of the stomach, colorectum and prostate( Reference Siegel, Naishadham and Jemal 4 ), emphasising the importance of care for breast cancer survivors.
Dietary factors as preventive or risk factors for breast cancer development( Reference Michels, Mohllajee and Roset‐Bahmanyar 5 ) have long been studied, including dietary lipids, red and processed meat, grains, fibre, fruits, vegetables, and several vitamins and minerals. An expert panel of the Continuous Update Project of the World Cancer Research Fund recommended that breast cancer patients should follow cancer prevention recommendations, and more and better scientific research is needed( 6 ). Although the evidence from studies of diet and food choices for breast cancer survivors is limited, several observational and intervention studies have suggested a potential link between diet and breast cancer survivorship. A healthy dietary pattern( Reference Hirko, Willett and Hankinson 7 ), circulating vitamin D levels( Reference Rose, Elser and Ennis 8 ) and the intake of saturated or trans-fats( Reference Makarem, Chandran and Bandera 9 ), soya products( Reference Nechuta, Caan and Chen 10 ) and phytochemical compounds( Reference Ingram 11 ) have been reported to have associations with breast cancer recurrence or survival.
As breast cancer survivors have an increasing need for supportive care guidelines in Korea, understanding the role of diet in the quality of life and survival of breast cancer survivors is important. This can only be accomplished with an appropriate tool to assess the diets of breast cancer survivors. FFQ are the most frequently used assessment tools in large epidemiological studies of diet and chronic disease, because they provide dietary information over a long time in a relatively cost-effective manner( Reference Willett 12 , Reference Subar 13 ). As a FFQ can be used to assess the dietary habits of a designated population and the diet of breast cancer survivors might differ from that of the general population( Reference Park, Hwang and Moon 14 ), the development of a FFQ specific to this group is needed to examine dietary factors in relation to breast cancer survivorship. Therefore, we aimed to develop a FFQ for breast cancer survivors, particularly for individuals who have a stable status following their recovery, in Korea, using contribution and variability analyses.
Methods
Study participants
A total of 219 women aged 21–79 years were recruited between September 2012 and July 2014. These women had been diagnosed at the University Hospital in Seoul, had stages I–III breast cancer according to the American Joint Committee on Cancer, and had undergone breast cancer surgery at least 6 months before the baseline. All procedures of this study involving human subjects were approved by the Institutional Review Board of Seoul National University School of Medicine. Written informed consent was obtained from all the participants.
To determine the portion size for each food or dish item, we analysed data from 90 862 women aged 19 years or older in the Korean National Health and Nutrition Examination Survey (KNHANES) 2013–2014 and checked the distribution of their intakes of food and dish items.
Dietary assessment
To develop a FFQ for breast cancer survivors, we collected information on the foods and amounts consumed using 3-d dietary records for each participant. The participants were asked to write down every food and dish they consumed during 3 non-consecutive days, including 2 weekdays and 1 weekend day. To minimise portion size errors, the participants were asked to record the intake amount with household tableware. On the basis of the protocol, trained dietitian interviewers collected the dietary record; reviewed unclear descriptions, errors, omissions or questionable entries; and asked the participants to clarify entries as necessary. All completed records were checked by a research dietitian for accuracy.
After excluding women with missing survey data (n 22) and those who recorded food items more than two times in one meal (n 5), the final analytic sample included 192 women.
Development of the FFQ
Selection of foods and dishes
We used the dietary record data obtained from the participants to develop a FFQ for breast cancer survivors. Major foods and dishes were selected by nutritional contribution and between-person variability on the basis of the cumulative r 2 for energy and six nutrients (carbohydrate, protein, fat, Ca, Fe and folate). The process involved in selecting the food and dish items for the development of the FFQ is shown in Fig. 1.

Fig. 1 Selection process of food and dish items for the FFQ.
Dietary factors that have been shown to be associated with breast cancer risk in the scientific literature, including energy, macronutrients, folate, Ca, Fe and vitamin D, were selected for analysis in this study. However, of the suggested factors, vitamin D was not included in the present study because it was unavailable in the Korean food composition database.
We identified a total of 1254 food items that were consumed by our study population. We grouped these items according to similar food ingredients and cooking methods and reduced the number to 1097 dishes. Items that appeared less than two times were removed from the dish list. First, we selected dishes that had a cumulative nutritional composition >90 %. Second, variability analyses were performed with a multiple regression model that used a stepwise method and included all 1097 dishes as independent variables in the model. Finally, we re-grouped the foods by the similarity of main ingredients and/or serving unit, resulting in the final 123 food items. For example, dishes such as ‘sandwich’, ‘sandwich, ham and cheese’, ‘sandwich, ham’, ‘sandwich, chicken’, ‘sandwich, vegetable’, ‘sandwich, beef’ and ‘sandwich, tuna’ were grouped into one dish item – ‘sandwich’.
Determination of frequency response and portion size
Participants reported the frequency of consumption of foods and dishes on an incremental scale with nine levels (never or almost never, once per month, two to three times per month, once per week, two to four times per week, five to six times per week, once per day, two times per day and three times per day). Portion size was determined on the basis of the reported amount consumed among women aged 19 years or older from the KNHANES and supplemented by dietary record data from the breast cancer survivors included in this study.
Development of a nutrient database of the dish items
For each of the 123 dish items in the FFQ, a database of nutrients for a medium portion and recipes was created from the 24-h recall database of the 2013 and 2014 KNHANES or from the 3-d dietary records obtained from our population of breast cancer survivors. For the nutrient database of 3-d dietary records, we used CAN-Pro 4.0 (Computer Aided Nutritional Analysis Program 4.0; The Korean Nutrition Society). In the KNHANES, nutrient intake was calculated on the basis of the 7th edition of the Food Composition Table from the Korean National Academy of Agricultural Science( 15 ). A weighted value was calculated for each recipe by dividing the item frequency by the sum of all item frequencies, and this weight was considered when we determined portion sizes. The weighted energy and nutrient contents were calculated by multiplying the item’s frequency weight by the nutritional value.
Results
The total number of food items consumed by all participants over 3 d was 1254. Food and dish items were re-grouped according to similar food ingredients and cooking methods, resulting in 1097 items.
The number of food items with over 90 % coverage of total nutrients and energy intake was as follows (Table 1): 232 for energy, 198 for carbohydrate, 212 for protein, 186 for fat, 228 for Ca, 248 for Fe and 217 for folate. Thus, the contribution analysis resulted in 344 food and dish items. The variability analyses were also used to select foods and dishes that explained between-person variations in the intakes of energy (134 items), carbohydrate (125 items), protein (128 items), fat (132 items), Ca (132 items), Fe (111 items) and folate (125 items). Through contribution analysis and variability analysis, 423 foods and dishes with r 2>0·90 for each nutrient and energy intake were selected. After we grouped the foods and dishes, a total of 123 food and dish items were finally selected.
Table 1 Number of dishes selected for composition of the FFQ

* The number of dishes accounting for 90 % of the cumulative contribution rate for energy and six nutrient intakes.
† The number of dishes explaining over 90 % of between-person variability based on the R 2 for energy and six nutrient intakes.
‡ The number of dishes accounting for 90 % of the cumulative contribution rate or explanation of between-person variability based on the R 2 for energy and six nutrients.
§ The resulting 123 dishes were re-grouped by the similarity of main ingredients.
We selected food and dish items that made large contributions to energy, carbohydrate, protein, fat, Ca, Fe and folate intakes in our study population. Table 2 presents the top twenty items that contributed the most to energy intake. Of the food items, multigrain rice accounted for 19·44 % of the energy intake. The energy contributions of brown rice, rice mixed with beans and white rice were 13·32, 9·68 and 9·35 %, respectively.
Table 2 Percentage contribution and rate of percentage contribution to total percentage contribution of the top twenty foods for energy
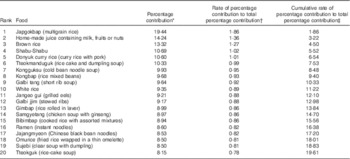
* Percentage contribution=mean of (energy intake from each food or dish/total energy intake).
† Rate of percentage contribution to total percentage contribution=(percentage contribution of each food or dish/total percentage contribution)×100.
‡ Cumulative rate of percentage contribution to total percentage contribution=sum of rate of percentage contribution to total percentage contribution up to that category.
The selected 123 dish items comprised six major groups of foods, including thirteen rice and noodle items, seven rice cake and bread items, eleven soup and stew items, fifty side-dish items, eleven beverage items and twelve fruit items. The portion size of each item was determined on the basis of the intake distribution from the KNHANES 2013 and 2014, such that a small portion size corresponded to the 25th percentile, a medium portion size corresponded to the 50th percentile and a large portion size corresponded to the 75th percentile. A few exceptions were made for dishes with no or little variation in serving size among the population, such as steamed rice and rice with mixed grains; for these dishes, the 10th, 50th and 90th percentiles corresponded to small, medium and large portion sizes, respectively. In addition, the portion sizes in the 109-item FFQ of the KNHANES( Reference Yun, Shim and Kweon 16 ) were reviewed and applied when appropriate.
We created a recipe database using the reported consumption frequency of each dish from the KNHANES or that of our study population of breast cancer survivors. Table 3 presents the frequency weights and energy content for all items assigned to the group ‘sandwich’. The sandwich item that had the lowest energy content was ‘sandwich, chicken’, which had an energy content of 876·5 kJ (209·5 kcal)/158·0 g (median portion size). The items that had the highest energy content were ‘sandwich’ and ‘sandwich, beef’, which had an energy content of 1939·7 kJ (463·6 kcal)/158·0 g (median portion size). After considering the frequency weight of each item, the total weighted energy content of a medium portion-sized ‘sandwich’ became 1939·7 kJ (463·6 kcal).
Table 3 Example of the development process (sandwich item and energy)

* Small, medium and large portion sizes represent 25th, 50th and 75th percentiles, respectively, of the weighted portion size of each dish consumed by the participants.
† Nutrient composition of the dish item=Σ(frequency weight×nutrient composition)/number of variation.
Discussion
We developed a FFQ to evaluate the food and nutrient intakes of Korean breast cancer survivors. There is increasing incidence and mortality due to breast cancer in Korean women, and breast cancer survivors tend to consume a different diet from the general population( Reference Velentzis, Keshtgar and Woodside 17 ); thus, there is an urgent need to develop an instrument to evaluate their long-term diet and identify the dietary factors related to breast cancer prognosis. In the present study, we collected information on the foods and amounts consumed by breast cancer survivors by using 3-d dietary records, and we evaluated the frequency of consumption for each food in our study population and KNHANES. A total of 123 dishes and foods were selected using contribution analyses for six nutrients and energy intake, and variability analyses were used to detect between-person variation for nutrients. The present study is the first attempt to develop a Korean breast cancer survivor-specific FFQ, which might help us understand the role of diet in breast cancer prognosis.
A number of dietary assessment methods such as dietary recalls, food records, diet histories and FFQ have been proposed for dietary intake assessment. Each dietary assessment method has its own strengths and weaknesses( Reference Fernandez-Ballart, Pinol and Chang 18 , Reference Hammond 19 ). Food records and 24-h recalls are accurate methods for measuring an individual’s intake. However, 1-d dietary records and 24-h recalls cannot capture a participant’s usual consumption habits( Reference Hammond 19 – Reference Russel-Bridfel, Caggiula and Kuller 22 ). FFQs measure long-term dietary factors; are less time consuming, more cost-effective and easier to administer; and have a lower burden on participants than other dietary assessment methods( Reference Willett 12 , Reference Holmes, Hunter and Colditz 23 ).
Several studies have explored the possible influence of diet on breast cancer survival, and the majority of studies have focused on dietary patterns and specific nutrients( Reference Hirko, Willett and Hankinson 7 , Reference Rose, Elser and Ennis 8 , Reference Farvid, Cho and Chen 24 ). Intakes of fruits and vegetables, or the nutrients found in fruits and vegetables, have been related to better survival( Reference Rose, Elser and Ennis 8 , Reference Makarem, Chandran and Bandera 9 , Reference Farvid, Cho and Chen 25 ), whereas the association between fat intake and survival has been mixed( Reference Nechuta, Caan and Chen 10 , Reference Ingram 11 , Reference Park, Hwang and Moon 14 , Reference Velentzis, Keshtgar and Woodside 17 , Reference Farvid, Cho and Chen 25 , Reference Cho, Jung and Lee 26 ). To develop a FFQ for a specific population, one must first obtain an appropriate food list( Reference Willett 12 , Reference Shahar, Fraser and Shai 27 ). The foods selected must be frequently eaten and contain a significant amount of the nutrients of interest( Reference Willett 12 , Reference Cade, Thompson and Burley 28 , Reference Stark 29 ). In the Poland arm of the Prospective Urban and Rural Epidemiological study, a 24-h recall was collected from the participants based on the most frequently consumed food items and portion size, and then a food list was developed from these data( Reference Dehgan, Ilow and Zatonska 30 ). In the Shanghai Women’s Health Study FFQ, a total of seventy-seven food items and food groups were included in the questionnaire, which encompassed approximately 90 % of the commonly consumed foods in urban Shanghai( Reference Park, Kim and Kim 31 ). During the baseline survey, participants were randomly selected in each season, and their dietary information was obtained and analysed in a regression analysis that considered the age, educational level and income of the subgroup of study participants.
In this study, we collected data derived from multiple dietary records instead of a 1-d dietary record. The use of these dietary records was an important step in obtaining an accurate list of commonly consumed foods relevant to the population of interest, which is considered the most crucial step in FFQ development( Reference Stark 29 , Reference Cade, Thompson and Burley 32 ). Stark( Reference Stark 29 ) recommended that the food grouping should fit within respondents’ ‘conceptual framework’. The food item list cannot be endless, and for realistic reasons some food grouping is required. Grouping foods by the similarity of ingredients, rather than listing or enumerating the ingredients, better facilitates probing by the interviewers and simplifies the food item recall needed by respondents.
In our database approach, the dish items of this developed FFQ were identified using the KNHANES 24-h recall and FFQ data – a large-scale, nationally representative data set. This approach might be similar to the development of the Block 2005 FFQ that used dietary data from the National Health and Nutrition Examination Survey 1999–2002( Reference Block 32 ) and a FFQ for Korean diet and cancer research that used cancer-related dietary factors and dietary intake data from the KNHANES( Reference Block 33 ). A database approach improves a FFQ because it takes advantage of large-scale, national survey data of the representative population( Reference Cade, Thompson and Burley 32 ). This study is a significant attempt to develop a FFQ for breast cancer research using a database approach based on breast cancer research survey data. Several previous studies in Korea( Reference Ji, Kim and Choi 34 – Reference Yim, Lee and Park 38 ) formulated nutrient databases using various recipes instead of generalising to a particular food or dish, but we created a nutrient composition database for each dish item using its recipe obtained from the participants in the KNHANES – a representative population of Korea.
There were 123 food items selected from the analyses for energy and nutrients. Our questionnaire represents a compromise between length and ease of use. A short FFQ has the advantage of clarity and ease of completion, but might not provide the same quality of data as a more lengthy questionnaire( Reference Subar, Ziegler and Thompson 39 ). However, completing a long FFQ can lead to fatigue and burden among respondents, resulting in impaired accuracy( Reference Ranka, Gee and Biro 40 ). When formulating our FFQ, we wanted to achieve an adequate number of food items with a choice of frequency options ranging from ‘never’ to consumption several times per day. Defining the options in this way increases clarity and reduces error compared with open-ended responses in which subjects self-report their frequency of food intake( Reference Subar, Thompson and Smith 41 ).
Our study had several limitations. First, our sample size was small, and we recruited participants from one hospital and only collected 3-d dietary records. To overcome this weakness, we used a nutrient composition database for each dish from the KNHANES to produce general Korean food recipes. When we compared the recipe database obtained from breast cancer survivors with that of KNHANES, they were similar. The KNHANES data were considered to be a suitable source for recipes because they are from a large sample that represents the population of Korea( Reference Park, Kim and Kim 31 ). Second, the sampling for this study was not random, which limits our ability to generalise our results to all breast cancer survivors in Korea. However, the hospital in our study is one of the largest hospitals in Korea, and it attracts patients from all over the country. The reproducibility and validity of the FFQ have not yet been evaluated. These are assessed by administering the questionnaire at two (or more) time points, separated by at least 6 months or up to several years, to the same group. We plan to conduct validation and reproducibility studies in other hospitals.
Our study has some strengths. This study is the first step to examining the importance of diet among breast cancer survivors in Korea. The FFQ we developed will help identify new dietary habits and trends among breast cancer survivors. The data set had multiple dietary record collections, which enabled us to estimate the intake habits after a diagnosis of breast cancer. The results of this study might be helpful for evaluating the nutrient intake and dietary patterns of breast cancer survivors and will provide significant information for the future assessment of dietary factors after breast cancer diagnosis.
In conclusion, we developed a FFQ specific to Korean breast cancer survivors, and believe that this FFQ can be used in epidemiological studies of breast cancer in Korea.
Acknowledgements
This research was supported by the Basic Science Research Program through the National Research Foundation of Korea (NRF) funded by the Ministry of Science, ICT & Future Planning (NRF-2014R1A2A2A01007794).
Designed the study: H.-G. M., D.-Y. N., J. E. L.; collected the data: S. S., E. H., H.-G. M., D.-Y. N., J. E. L.; performed the analysis: W.-k. S., S. S.; wrote the draft: W.-k. S., J. E. L.; contributed to the writing of the manuscript and approved the final version: W.-k. S., S. S., E. H., H.-G. M., D.-Y. N., J. E. L.
All the authors declare that there are no conflicts of interest.


