


Introduction
The leopard Panthera pardus is a generalist predator that is consistently found outside protected areas (Athreya et al., Reference Athreya, Odden, Linnell and Karanth2011; Swanepoel et al., Reference Swanepoel, Lindsey, Somers, van Hoven and Dalerum2013; Odden et al., Reference Odden, Athreya, Rattan and Linnell2014). However, the ability of leopards to occupy landscapes affected by humans does not exempt them from threats associated with increasing anthropogenic pressure (Jacobson et al., Reference Jacobson, Gerngross, Lemeris, Schoonover, Anco and Breitenmoser-Würsten2016), and negative anthropogenic effects on leopard populations in sub-Saharan Africa have been reported (Balme et al., Reference Balme, Slotow and Hunter2010; Henschel et al., Reference Henschel, Hunter, Coad, Abernethy and Mühlenberg2011; Rosenblatt et al., Reference Rosenblatt, Creel, Becker, Merkle, Mwape, Schuette and Simpamba2016; Stein et al., Reference Stein, Athreya, Gerngross, Balme, Henschel and Karanth2020; Naude et al., Reference Naude, Balme, Riain, Hunter, Fattebert, Dickerson and Bishop2020). The strength of such anthropogenic effects is not well known, largely because it is difficult to obtain precise data on population density and survival (Durant et al., Reference Durant, Bashir, Maddox and Laurenson2007). Like other African carnivores, the leopard is in decline, and many subspecies and regional populations are highly threatened (Ripple et al., Reference Ripple, Estes, Beschta, Wilmers, Ritchie and Hebblewhite2014; Jacobson et al., Reference Jacobson, Gerngross, Lemeris, Schoonover, Anco and Breitenmoser-Würsten2016). The species’ broad geographical distribution, generalist ecology, and cryptic nature has led to a misconception that this might not be the case (Jacobson et al., Reference Jacobson, Gerngross, Lemeris, Schoonover, Anco and Breitenmoser-Würsten2016; Stein et al., Reference Stein, Athreya, Gerngross, Balme, Henschel and Karanth2020), and much research on leopards has consequently focused on issues other than conservation (Balme et al., Reference Balme, Lindsey, Swanepoel and Hunter2014).
The causes of leopard population decline are habitat loss and fragmentation, conflict with people, unsustainable trophy hunting, poaching for body parts, indiscriminate killing, and prey depletion (Athreya et al., Reference Athreya, Odden, Linnell and Karanth2011; Packer et al., Reference Packer, Brink, Kissui, Maliti, Kushnir and Caro2011; Nijman et al., Reference Nijman, Morcatty, Smith, Atoussi, Shepherd and Siriwat2019; Stein et al., Reference Stein, Athreya, Gerngross, Balme, Henschel and Karanth2020). The latter in particular has been identified as a major issue for leopards in Central Africa (Henschel et al., Reference Henschel, Hunter, Coad, Abernethy and Mühlenberg2011), but little work has evaluated leopard population density and survival in other African protected areas affected by prey depletion.
Prey depletion is apparent in many ecosystems affected by illegal offtake (Bolger et al., Reference Bolger, Newmark, Morrison and Doak2008; Fa & Brown, Reference Fa and Brown2009; Western et al., Reference Western, Russell and Cuthil2009; Ripple et al., Reference Ripple, Newsome, Wolf, Dirzo, Everatt and Galetti2015). Because this type of offtake is unregulated, it is often unsustainable, driving extensive wildlife population declines and disproportionately affecting larger-bodied herbivores (Wilkie & Carpenter, Reference Wilkie and Carpenter1999; Fa et al., Reference Fa, Yuste and Castelo2000; Creel et al., Reference Creel, Matandiko, Schuette, Rosenblatt, Sanguinetti and Banda2018; Vinks et al., Reference Vinks, Creel, Schuette, Rosenblatt, Matandiko and Sanguinetti2020). Herbivore declines, in turn, are widely thought to be a strong driver of carnivore declines in sub-Saharan Africa (Midlane et al., Reference Midlane, O'Riain, Balme, Robinson and Hunter2014; Rosenblatt et al., Reference Rosenblatt, Creel, Becker, Merkle, Mwape, Schuette and Simpamba2016, Reference Rosenblatt, Creel, Schuette, Becker, Christianson and Dröge2019; Creel et al., Reference Creel, Matandiko, Schuette, Rosenblatt, Sanguinetti and Banda2018; Vinks et al., Reference Vinks, Creel, Schuette, Becker, Rosenblatt and Sanguinetti2021).
Western Zambia's Greater Kafue Ecosystem, comprising Kafue National Park and surrounding Game Management Areas, has been identified as a potential leopard stronghold, on the basis of historical data (Purchase et al., Reference Purchase, Mateke and Purchase2007). Little is known about the current status of leopards in the Greater Kafue Ecosystem, although this system now faces extensive anthropogenic pressures from encroachment (Watson et al., Reference Watson, Becker, Milanzi and Nyirenda2014) and illegal offtake (Overton et al., Reference Overton, Davies, Nguluka, Chibeya, Sompa, Simukonda and Lindsey2017), with effects on the large herbivore and carnivore guilds (Creel et al., Reference Creel, Matandiko, Schuette, Rosenblatt, Sanguinetti and Banda2018; Vinks et al., Reference Vinks, Creel, Schuette, Rosenblatt, Matandiko and Sanguinetti2020; Vinks et al., Reference Vinks, Creel, Schuette, Becker, Rosenblatt and Sanguinetti2021). Specifically, the long-term decline of large-bodied prey species has led to prey base homogenization, niche compression, and increased niche overlap within the large carnivore guild, including of leopards and lions Panthera leo (Creel et al., Reference Creel, Matandiko, Schuette, Rosenblatt, Sanguinetti and Banda2018). The consequences of these changes for the conservation of subordinate competitors such as leopards cannot be evaluated without data on density and demography. More broadly, reliable and precise estimates of population size and vital rates (survival and reproductive parameters) are needed to design and evaluate actions for the conservation and management of leopard populations, especially in protected areas facing anthropogenic pressures suspected of causing declines (Jacobson et al., Reference Jacobson, Gerngross, Lemeris, Schoonover, Anco and Breitenmoser-Würsten2016; Rosenblatt et al., Reference Rosenblatt, Creel, Becker, Merkle, Mwape, Schuette and Simpamba2016).
Individual leopards are identifiable through their unique markings (Plate 1; Miththapala et al., Reference Miththapala, Seidensticker, Phillips, Fernando and Smallwood1989), facilitating effective monitoring with passive camera trap arrays (Balme et al., Reference Balme, Hunter and Slotow2009a,Reference Balme, Slotow and Hunterb; Goldberg et al., Reference Goldberg, Tempa, Norbu, Hebblewhite, Mills, Wangchuk and Lukacs2015; Rosenblatt et al., Reference Rosenblatt, Creel, Becker, Merkle, Mwape, Schuette and Simpamba2016; Balme et al., Reference Balme, Rogan, Thomas, Pitman, Mann and Whittington-Jones2019). Camera-trap data have been used to estimate population densities in many parts of the species' range (Balme et al., Reference Balme, Rogan, Thomas, Pitman, Mann and Whittington-Jones2019). However, substantial gaps still exist in our understanding of the drivers of leopard population dynamics (Balme et al., Reference Balme, Lindsey, Swanepoel and Hunter2014; Jacobson et al., Reference Jacobson, Gerngross, Lemeris, Schoonover, Anco and Breitenmoser-Würsten2016; Stein et al., Reference Stein, Athreya, Gerngross, Balme, Henschel and Karanth2020), particularly with regard to the consequences of prey depletion. Although the loss of prey is generally expected to cause carnivore declines, the densities of dominant competitors (especially lions) are more strongly correlated with prey density than the densities of subordinate competitors (Van Orsdol et al., Reference Van Orsdol, Hanby and Bygott1985; Laurenson, Reference Laurenson, Sinclair and Arcese1995; Creel & Creel, Reference Creel and Creel2002). Because a decrease in prey density is likely to reduce the density of dominant competitors, its net effect on the survival and population density of leopards is difficult to predict. Prediction of this effect is further complicated by studies suggesting that competitive limitation of leopards by dominant competitors is weaker (Rosenblatt et al., Reference Rosenblatt, Creel, Becker, Merkle, Mwape, Schuette and Simpamba2016; Balme et al., Reference Balme, Pitman, Robinson, Miller, Funston and Hunter2017; Miller et al., Reference Miller, Pitman, Mann, Fuller and Balme2018) than for other competitive subordinates such as the African wild dog Lycaon pictus (Creel & Creel, Reference Creel and Creel2002; Swanson et al., Reference Swanson, Caro, Davies-Mostert, Mills, Macdonald and Borner2014).

Plate 1 A camera trap captures a male leopard Panthera pardus travelling in the early morning in Kafue National Park, Zambia.
Here, we use data from a 7-year camera-trap study of leopards in north-central Kafue National Park to fit capture–recapture models to provide unbiased estimates of population density and sex-specific apparent survival rates, accounting for imperfect detection. By comparing our estimates of density and apparent survival to data from other leopard populations, we evaluate the consequences of prey depletion in the Greater Kafue Ecosystem.
Study area
We established a camera-trap grid in north-central Kafue National Park west of the Kafue river, and along the Lufupa river (Fig. 1). Kafue lies in western Zambia, and is the country's largest protected area at 22,319 km2. Kafue and the surrounding Game Management Areas comprise the 66,000 km2 Greater Kafue Ecosystem, which is dominated by miombo woodland (Brachystegia and Julbernardia spp.) with a mosaic of savannah grassland, riverine woodland, mixed acacia woodland, termitaria woodland, and seasonally inundated grasslands. The region experiences a rainy season with extensive flooding during December–April and a dry season during May–November. Carnivore prey are depleted in Kafue, and densities of larger-bodied herbivores are depressed relative to smaller species. To evaluate the impacts of both prey depletion and interspecific competition with lions, we focused on the central portion of Kafue, for which there are well-described lion and herbivore densities and dynamics from long-term studies (Vinks et al., Reference Vinks, Creel, Schuette, Rosenblatt, Matandiko and Sanguinetti2020, Reference Vinks, Creel, Schuette, Becker, Rosenblatt and Sanguinetti2021).

Fig. 1 Study area in Kafue National Park, Zambia. Buffer zones identify the areas effectively sampled based on the mean maximum distance moved (MMDM; 538 km2) and half of the mean maximum distance moved (HMMDM; 228 km2).
Methods
Study design
We used a grid of camera traps to photograph individual leopards and used a combination of open and closed capture–recapture models to estimate population size, population density, and sex-specific annual survival rates. Cameras were placed within a square grid that was random in its origin and orientation, following Rosenblatt et al. (Reference Rosenblatt, Creel, Becker, Merkle, Mwape, Schuette and Simpamba2016). Grid spacing followed established procedures for large felids to meet the assumptions of closed capture–recapture models (Otis et al., Reference Otis, Burnham, White and Anderson1978; Karanth & Nichols, Reference Karanth and Nichols1998; Balme et al., Reference Balme, Hunter and Slotow2009a,Reference Balme, Slotow and Hunterb). We based grid cell size on the smallest home range estimate (14 km2) for an adult female leopard in Zambia's Luambe National Park (Ray, Reference Ray2011), and spaced camera-trap sites 2.5 km apart (Fig. 1). This spacing ensured several sites within the home range of each individual (Karanth & Nichols, Reference Karanth and Nichols1998), to increase the probability of detection.
We established 15 unbaited camera-trap sites (Fig. 1), selecting sites by searching for leopard tracks within 100 m of each (uniformly distributed) grid point (Silver et al., Reference Silver, Ostro, Marsh, Maffei, Noss and Kelly2004). If we encountered no tracks, we selected the most active game trail within 100 m of the point (Rosenblatt et al., Reference Rosenblatt, Creel, Becker, Merkle, Mwape, Schuette and Simpamba2016). Although vegetation varied between sites, we expected leopards to use all vegetation types (Balme et al., Reference Balme, Hunter and Slotow2007).
At each site we placed two Reconyx Hyperfire PC800 cameras (Reconyx, Inc., Holmen, USA) opposite one another, to photograph both sides of passing leopards, and attached each camera to a tree at a height and angle selected to maximize the likelihood of being triggered by leopards (Rosenblatt et al., Reference Rosenblatt, Creel, Becker, Merkle, Mwape, Schuette and Simpamba2016). To download images, we visited sites on foot in small groups to minimize our potential effect on subsequent detections. Individuals were identified by spot patterns, and sex was determined based on genitalia and sexually dimorphic traits such as body size, head size, and the prominence of the neck dewlap (Balme et al., Reference Balme, Hunter and Braczkowski2012). We did not assign ages because of the limitations of image quality and the difficulty of aging leopards accurately (Balme et al., Reference Balme, Hunter and Braczkowski2012).
Modelling abundance and survival
Our sampling was restricted to 6 months (June–November) annually, when conditions allowed for consistent monitoring across the entire study site. We deployed cameras in a random rotation across three sections within the study area (Karanth, Reference Karanth1995). Each section consisted of 5 sites and was sampled for 20 days on two occasions (40 days total) in each 6-month period. To estimate survival rates, we created encounter histories for each individual by pooling detections across sections for each 20-day period (see below). To estimate abundance, we divided each 20-day primary occasion into two 10-day secondary occasions (see below). To avoid double-counting individual leopards, we created encounter histories using only right-side photographs (Rosenblatt et al., Reference Rosenblatt, Creel, Becker, Merkle, Mwape, Schuette and Simpamba2016).
Our study was designed to estimate population size, annual survival, detection and redetection probabilities, and rates of temporary emigration, using an extended robust design model (Pollock, Reference Pollock1982; Kendall et al., Reference Kendall, Pollock and Brownie1995), which was used for data from the same sampling design in another Zambian leopard population (Rosenblatt et al., Reference Rosenblatt, Creel, Becker, Merkle, Mwape, Schuette and Simpamba2016). Because we obtained far fewer detections, this model could not be fit, and therefore we modelled annual survival and abundance using open and closed capture–recapture models, respectively.
Survival
We used 7 years (2013–2019) of detection records for 26 unique leopards and fitted Cormack–Jolly–Seber models to estimate sex-specific annual survival rates (φ), and detection probability (P), that allowed for individual heterogeneity in detection (Pledger et al., Reference Pledger, Pollock and Norris2010). Detections were recorded for two 20-day occasions per year, so that the detection (1) or non-detection (0) of each individual in each 20-day period yielded a 14-occasion encounter history for each individual over the 7-year study, with staggered entry. We constructed an a priori set of Cormack–Jolly–Seber models that allowed survival and detection rates to vary by sex and year, and used RMark (Laake, Reference Laake2013) and MARK (White & Burnam, Reference White and Burnam1999) to identify which of these 72 models were best-supported, using Akaike's information criteria corrected for small sample size (AICc). We then used model averaging to estimate sex-specific apparent survival, using all models with ΔAICc < 2.
Abundance
We used annual detection histories for individual leopards and fitted Huggins closed population models to estimate the probability of initial detection, subsequent detection, and population size in each year using RMark and MARK (Huggins, Reference Huggins1989). We did not incorporate an effect of individual heterogeneity on detection because AICc scores provided little evidence for heterogeneity in detection from the top Cormack–Jolly–Seber survival models. To further mimic the parameterization of the detection process from the top Cormack–Jolly–Seber survival models, we constrained detection by assuming no difference between the likelihood of initial detection and subsequent detection (P = c). This constraint kept our estimates of abundance consistent with our Cormack–Jolly–Seber estimates of survival, in which the probability of detection is conditional on the first detection (Mweetwa et al., Reference Mweetwa, Christianson, Becker, Creel, Rosenblatt and Merkle2018).
For each 6-month period we constructed a detection history of four 10-day occasions, recording whether each leopard was detected (1) or not (0) within each 10-day window. We also used the model of detection selected using AICc scores for the Cormack–Jolly–Seber models to model population size (Mweetwa et al., Reference Mweetwa, Christianson, Becker, Creel, Rosenblatt and Merkle2018). We focused our inferences about population density on results for 2016, because it was the only year with sufficient data to provide a precise estimate. We estimated an initial sampling area by calculating the mean maximum distance moved (MMDM; Stickel, Reference Stickel1954; Wilson & Anderson, Reference Wilson and Anderson1985) for all individuals across the entire study and buffered each camera-trap site by half of the mean maximum distance moved distance (HMMDM; Balme et al., Reference Balme, Hunter and Slotow2009a,Reference Balme, Slotow and Hunterb; Gray & Prum, Reference Gray and Prum2012; Rosenblatt et al., Reference Rosenblatt, Creel, Becker, Merkle, Mwape, Schuette and Simpamba2016). However, there are concerns that HMMDM may overestimate density estimates by underestimating space use of individuals (Tobler & Powell, Reference Tobler and Powell2013), an important consideration given our predominantly linear camera-trap configuration, relatively few cameras, and block sampling design (Tobler & Powell, Reference Tobler and Powell2013). We therefore also report an alternative sampling area derived from the mean maximum distance moved (Wilson & Anderson, Reference Wilson and Anderson1985). We did not use alternative spatially explicit models, for reasons explained in the Discussion. Despite these limitations, a simple closed capture–recapture model yielded a relatively precise baseline estimate of leopard density for 2016. We then compared our estimate of population density to estimates from other protected areas across Africa to assess the status of leopards in this portion of Kafue National Park.
Preferred leopard prey density
We have previously identified (Creel et al., Reference Creel, Matandiko, Schuette, Rosenblatt, Sanguinetti and Banda2018) the prey species preferred by leopards in northern Kafue: puku Kobus vardonii, impala Aepyceros melampus and warthog Phacochoerus africanus. We have previously described the distribution and abundance of these prey species using distance sampling models fitted to data from a line-transect network that includes the camera-trap grid used here, sampled 15 times over the same time period as this study (Vinks et al., Reference Vinks, Creel, Schuette, Rosenblatt, Matandiko and Sanguinetti2020). Here, we used these models to map the density of the prey species preferred by Kafue leopards across the sampling area for leopards (Fig. 2). Predicted prey densities for our camera-trap grid were then compared with leopard detections.
Results
Leopard population structure
From 4,200 camera-trap days we recorded 101 leopard detections and identified 29 individuals (17 females, 9 males and 3 unknown) during 2013–2019. The number of leopard detections at each site was 1–24 (mean 6.7, median 4) and leopards were detected at all 15 sites (Figs 2 & 3). Each site detected 1–9 (mean 3.3) individuals, with the majority of individuals at the northern-most site (Figs 2 & 3). Throughout the course of the study we detected a mean of 9 (range 7–12) leopards annually (Table 1). The sex ratio for 26 individuals incorporated in the survival analysis was 1 male:1.89 females.
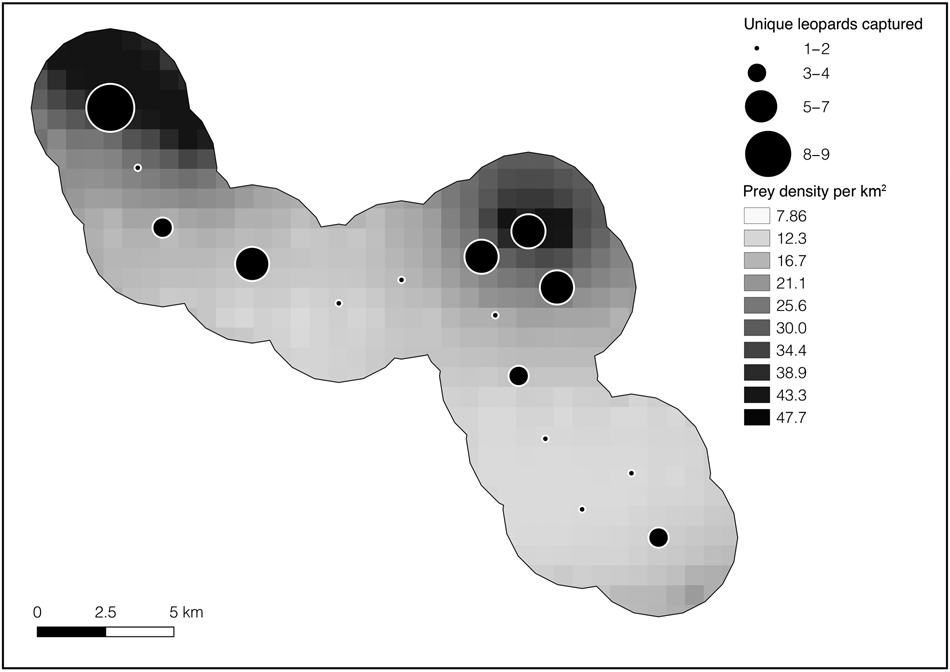
Fig. 2 Total number of leopards Panthera pardus captured at each camera-trap site in Kafue National Park (Fig. 1) overlain on the gradient of preferred leopard prey density (puku Kobus vardonii, impala Aepyceros melampus, warthog Phacochoerus africanus). Although leopards were detected at each site, the majority of individuals were detected at sites with a higher density of preferred prey.
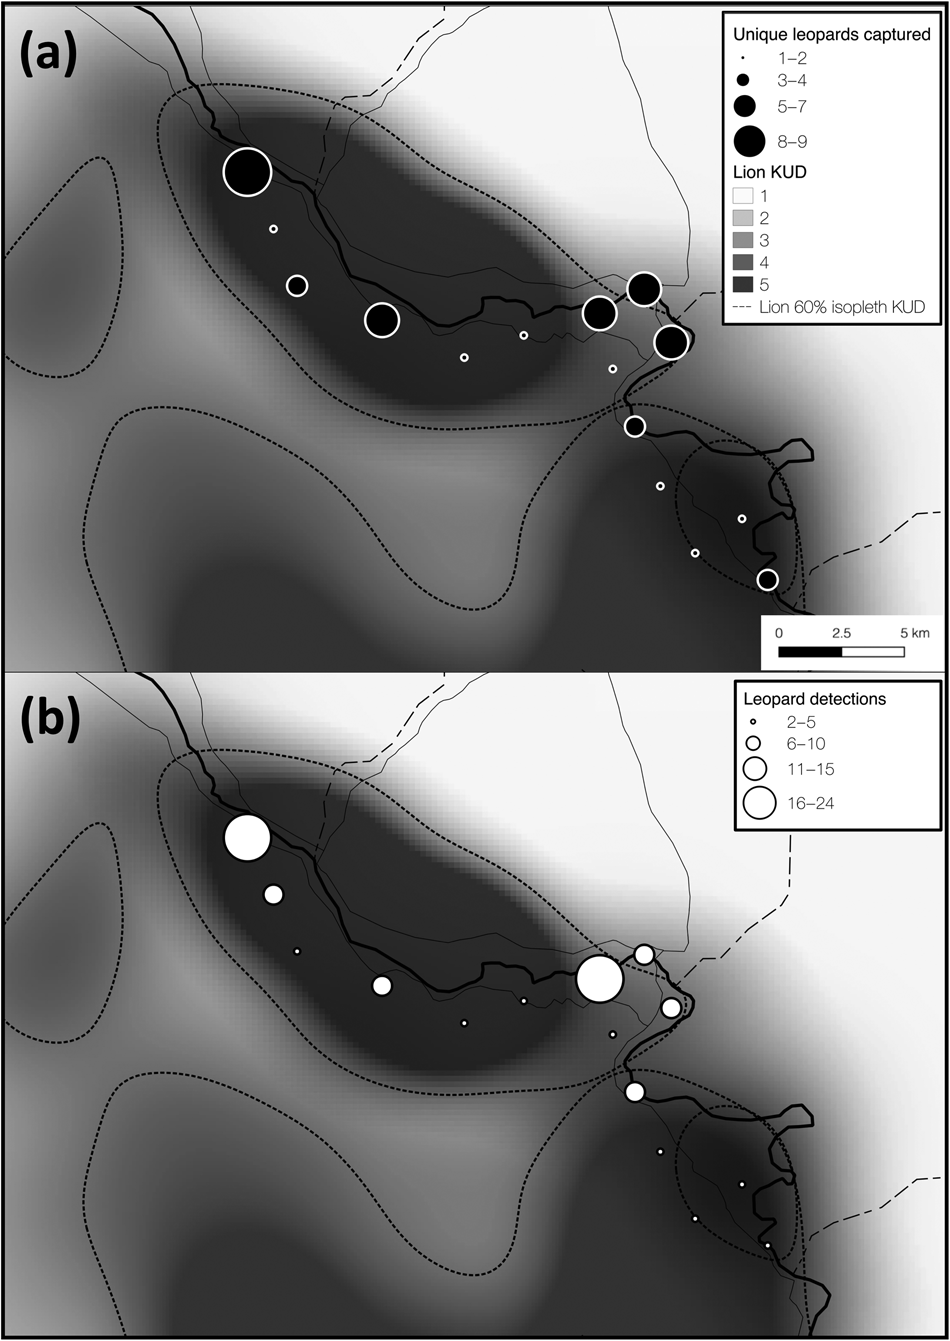
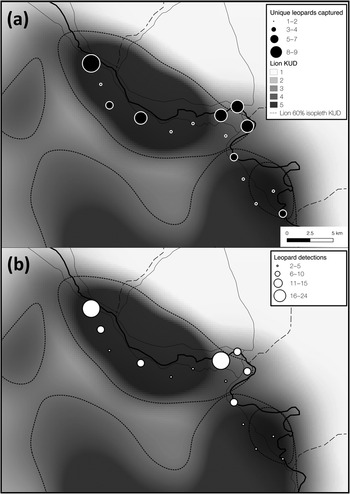
Fig. 3 Total number of (a) unique leopards captured, and (b) all leopard detections at each camera-trap site overlain on the gradient of space use (kernel utilization distribution, KUD) for two locally resident (and closely monitored) African lion Panthera leo prides (data from Vinks et al., Reference Vinks, Creel, Schuette, Becker, Rosenblatt and Sanguinetti2021). Lion kernel utilization distribution values of 1–5 represent low–high space use and the 60% isopleth was derived from this gradient. Leopard space use appeared to overlap lion space use, suggesting that leopards are not strongly limited by interspecific competition.
Table 1 Leopard Panthera pardus camera-trap detections during 2013–2019. We considered leopards new in this study if they had not been previously documented on the study site in 2013–2019 (through either opportunistic observations or camera traps).

Survival rates and detection probabilities
Three Cormack–Jolly–Seber models were identified as the best-supported models of leopard survival (Table 2), and these models suggested that both detection (P) and apparent survival (φ) varied by sex. However, the model-averaged estimate of apparent survival for females (0.73, 95% CI 0.56–0.85) was similar to that of males (0.74, 95% CI 0.56–0.87). The probability of detection was relatively low, with model-averaged estimates of 0.35 (95% CI 0.24–0.48) for females and 0.33 (95% CI 0.22–0.47) for males.
Table 2 The best-supported Cormack–Jolly–Seber models of leopard survival, as determined by Akaike's information criteria corrected for small sample size (AICc).

1 φ, apparent survival rate; P, detection probability; π, mixture parameter.
2 K, number of parameters.
3 ΔAICc, difference in AICc to the best performing model.
Population density
We detected 12 individual leopards in 20 total detections in 2016, nine of which (69%) were known previous to the study. In addition, we detected one dependent cub, which we excluded from the abundance estimate. The estimated population size in 2016 was 18 (95% CI 12–33). The HMMDM and MMDM between detections for 11 leopards recaptured at multiple sites (2013–2019) were 2.69 km (range: 1.2–5.7 km) and 5.38 (range: 2.4–11.4 km), respectively. Applying these buffers to the camera-trap locations yields a sampling area of 228 km2 and 538 km2 centred along the Lufupa river (Fig. 1). These estimates of population size and sampling area yield a density of 7.89 leopards per 100 km2 (95% CI 6.14–14.47 leopards per 100 km2) and 3.34 leopards per 100 km2 (95% CI 2.23–6.13 leopards per 100 km2), respectively.
Discussion
Leopard population density or demography are rarely evaluated in large African protected areas of high conservation concern (Balme et al., Reference Balme, Lindsey, Swanepoel and Hunter2014). Improving our understanding of the effects of anthropogenic pressures on leopard populations is a critical first step for leopard conservation. In the Greater Kafue Ecosystem, recent research has shown that ungulate prey density is considerably lower than expected for an ecosystem with its vegetation type and rainfall (Vinks et al., Reference Vinks, Creel, Schuette, Rosenblatt, Matandiko and Sanguinetti2020), and low prey density leads to a logical expectation of low carnivore density, and, if severe, lower adult survival (Van Orsdol et al., Reference Van Orsdol, Hanby and Bygott1985; Stander et al., Reference Stander, Haden, Kaqece and Ghau1997; Eberhardt, Reference Eberhardt2002). Moreover, reductions in density have been particularly great for large prey species that were previously preferred by lions, squeezing the entire carnivore guild into a narrow dietary niche centred on the species preferred by leopards (Creel et al., Reference Creel, Matandiko, Schuette, Rosenblatt, Sanguinetti and Banda2018). Consequently, we would expect that increased interspecific competition within the carnivore guild could exacerbate the effects of prey depletion. On the other hand, the densities of dominant competitors within this guild (lions and spotted hyenas Crocuta crocuta) correlate with the density of prey, both within and between ecosystems (Schaller, Reference Schaller1972; Van Orsdol et al., Reference Van Orsdol, Hanby and Bygott1985; Hofer & East, Reference Hofer, East, Sinclair and Arcese1995). Thus, the direct effect of prey depletion on leopards could be partially offset by a decrease in the limiting effect of competition, if any exists (Rosenblatt et al., Reference Rosenblatt, Creel, Becker, Merkle, Mwape, Schuette and Simpamba2016; Balme et al., Reference Balme, Pitman, Robinson, Miller, Funston and Hunter2017; Miller et al., Reference Miller, Pitman, Mann, Fuller and Balme2018).
This study provided baseline estimates of sex-specific annual survival rates and population density for leopards in north-central Kafue, and is one of few studies to provide such results for leopards in miombo woodland, which constitutes a large portion of the species' range across Zambia and Tanzania (Balme et al., Reference Balme, Hunter and Slotow2007; Rosenblatt et al., Reference Rosenblatt, Creel, Becker, Merkle, Mwape, Schuette and Simpamba2016). Contrary to our predictions, density estimates were comparable to those in ecosystems with relatively greater protection, where ecological conditions (notably preferred prey abundance) remain favourable for leopards (Ray, Reference Ray2011; Du Preez et al., Reference Du Preez, Loveridge and Macdonald2014; Swanepoel et al., Reference Swanepoel, Somers and Dalerum2015a,Reference Swanepoel, Somers, van Hoven, Schiess-Meier, Owen and Snymanb; Rosenblatt et al., Reference Rosenblatt, Creel, Becker, Merkle, Mwape, Schuette and Simpamba2016, Reference Rosenblatt, Creel, Schuette, Becker, Christianson and Dröge2019). Although leopard density in our study site was not precariously low, this site is located in the heart of northern Kafue, with relatively high densities of preferred leopard prey, along a major perennial river, and mostly removed from negative anthropogenic edge effects typical outside the core of the Park. Densities of preferred leopard prey are substantially reduced in other parts of the Park and adjacent Game Management Areas (Creel et al., Reference Creel, Matandiko, Schuette, Rosenblatt, Sanguinetti and Banda2018; Schuette et al., Reference Schuette, Namukonde, Becker, Watson, Creel and Chifunte2018; Vinks et al., Reference Vinks, Creel, Schuette, Rosenblatt, Matandiko and Sanguinetti2020), and there is evidence of wire snare poaching bycatch in addition to targeted poaching in areas of the Greater Kafue Ecosystem with less protection (Overton et al., Reference Overton, Davies, Nguluka, Chibeya, Sompa, Simukonda and Lindsey2017). Thus, extrapolating our density estimate across other portions of the Park or Game Management Areas, where ecological conditions are less favourable and human pressures are known to be stronger (Watson et al., Reference Watson, Becker, Milanzi and Nyirenda2014; Overton et al., Reference Overton, Davies, Nguluka, Chibeya, Sompa, Simukonda and Lindsey2017; Schuette et al., Reference Schuette, Namukonde, Becker, Watson, Creel and Chifunte2018), would not be valid (Trouwborst et al., Reference Trouwborst, Loveridge and Macdonald2019).
We did not fit spatial capture–recapture models, which are widely used in conjunction with leopard camera-trap data (Du Preez et al., Reference Du Preez, Loveridge and Macdonald2014; Goldberg et al., Reference Goldberg, Tempa, Norbu, Hebblewhite, Mills, Wangchuk and Lukacs2015; Balme et al., Reference Balme, Rogan, Thomas, Pitman, Mann and Whittington-Jones2019; Devens et al., Reference Devens, Hayward, Tshabalala, Dickman, McManus, Smuts and Somers2019). When the number of redetections is low, the data do not allow good estimates of spatial capture–recapture model parameters, yielding a biased and imprecise density estimate (Efford et al., Reference Efford, Dawson and Robbins2004; Du Preez et al., Reference Du Preez, Loveridge and Macdonald2014; Paterson et al., Reference Paterson, Proffitt, Jimenez, Rotella and Garrott2019). Instead, we used a randomized grid with a spacing tailored to leopard movements to produce a representative estimate of density for the sampled area.
As with other large carnivores, leopard density is generally expected to be positively correlated with preferred prey biomass at a system-wide scale (Stander et al., Reference Stander, Haden, Kaqece and Ghau1997; Marker & Dickman, Reference Marker and Dickman2005). This logic leads to an expectation that Kafue leopard density should be low (Henschel et al., Reference Henschel, Hunter, Coad, Abernethy and Mühlenberg2011; Balme et al., Reference Balme, Batchelor, de Woronin Britz, Seymour, Grover and Hes2013; Rosenblatt et al., Reference Rosenblatt, Creel, Becker, Merkle, Mwape, Schuette and Simpamba2016), but it was not. The relatively higher localized densities of preferred leopard prey (Table 3) remaining within our 228 km2 camera-trap area, compared to the rest of the Park, could explain the relatively high observed leopard density. This explanation is supported by the observation that we obtained more leopard detections at sites with higher localized densities of preferred prey (Fig. 2). These results also suggest that leopards may maintain higher densities where preferred prey remains abundant at small spatial scales within larger areas with lower prey density overall, such as Kafue. Leopards may kill smaller prey in other parts of the ecosystem, including the common duiker Sylvicapra grimmia, which remain relatively abundant throughout Kafue (Schuette et al., Reference Schuette, Namukonde, Becker, Watson, Creel and Chifunte2018; Vinks et al., Reference Vinks, Creel, Schuette, Rosenblatt, Matandiko and Sanguinetti2020). However, dependency on such small prey is also expected to reduce population density (Henschel et al., Reference Henschel, Hunter, Coad, Abernethy and Mühlenberg2011). Although the Greater Kafue Ecosystem as a whole is affected by prey depletion, pockets of higher relative prey abundance could affect large carnivore dynamics across the Greater Kafue Ecosystem, and appear to favour leopards in small areas that maintain relatively higher densities of their favoured prey (Fig. 2). Nonetheless, average leopard density across the entire Greater Kafue Ecosystem would still be expected to reflect low preferred prey abundance as a whole (Stander et al., Reference Stander, Haden, Kaqece and Ghau1997). A direct examination of these issues near the Park border and within the Game Management Areas would be of value.
Table 3 Densities of primary leopard prey in north-central Kafue National Park, and the proportion of the Kafue leopard diet comprised of each species, from Vinks et al. (Reference Vinks, Creel, Schuette, Rosenblatt, Matandiko and Sanguinetti2020) and Creel et al. (Reference Creel, Matandiko, Schuette, Rosenblatt, Sanguinetti and Banda2018).

Lions can limit the distribution and abundance of leopards (Stander et al., Reference Stander, Haden, Kaqece and Ghau1997; Balme et al., Reference Balme, Batchelor, de Woronin Britz, Seymour, Grover and Hes2013), although recent findings suggest that interference competition with lions may be weaker than previously thought, particularly in secured protected areas with intact prey populations (Rosenblatt et al., Reference Rosenblatt, Creel, Becker, Merkle, Mwape, Schuette and Simpamba2016; Balme et al., Reference Balme, Pitman, Robinson, Miller, Funston and Hunter2017; Miller et al., Reference Miller, Pitman, Mann, Fuller and Balme2018). The effects of intraguild competition might be stronger in prey-depleted ecosystems, particularly when large-bodied prey densities are disproportionally reduced (Balme et al., Reference Balme, Pitman, Robinson, Miller, Funston and Hunter2017; Creel et al., Reference Creel, Matandiko, Schuette, Rosenblatt, Sanguinetti and Banda2018). The diets of leopards and lions overlap extensively within our study area (Creel et al., Reference Creel, Matandiko, Schuette, Rosenblatt, Sanguinetti and Banda2018) because the larger-bodied prey preferred by lions have become rare (Vinks et al., Reference Vinks, Creel, Schuette, Rosenblatt, Matandiko and Sanguinetti2020). This niche compression reduces the scope for dietary niche partitioning, and thus could strengthen the limiting effect of competition on subordinate competitors (Creel et al., Reference Creel, Matandiko, Schuette, Rosenblatt, Sanguinetti and Banda2018). However, we did not find evidence for this effect in Kafue. The distribution of leopard detections across space paralleled the core utilization distribution (60% isopleth of a kernel utilization distribution) for two resident lion prides in our study area (Fig. 3), suggesting that leopards did not avoid areas heavily used by lions throughout the dry season. However, lion density in Kafue is low (3.43 individuals per 100 km2, 95% CI 2.79–4.23) and pride size is small, with an average of 2.89 adult females per pride (Vinks et al., Reference Vinks, Creel, Schuette, Becker, Rosenblatt and Sanguinetti2021). Accordingly, the ratio of leopards to lions per 100 km2 in this part of Kafue is 2.3:1 (HMMDM) and 0.97:1 (MMDM), compared to 0.82:1 (HMMDM) and 0.47:1 (MMDM) in a part of Zambia's South Luangwa National Park with favourable ecological conditions, where leopard and lion densities are both high (Rosenblatt et al., Reference Rosenblatt, Becker, Creel, Droge, Mweetwa and Schuette2014, Reference Rosenblatt, Creel, Becker, Merkle, Mwape, Schuette and Simpamba2016). Such a substantial reduction in lion density could partially offset the anticipated effects of low prey densities on leopards in this part of the Park and could help explain a lack of evidence for intraguild competition.
Survival rates in our core study area were similar to estimates from another Zambian leopard population with better protection (Rosenblatt et al., Reference Rosenblatt, Creel, Becker, Merkle, Mwape, Schuette and Simpamba2016) and thus do not appear to be reduced by low prey density. Prior research with lions in this system also found that survival for resident individuals was high, but that lion density and cub recruitment were both low (Vinks et al., Reference Vinks, Creel, Schuette, Becker, Rosenblatt and Sanguinetti2021). Thus measurements of adult survival may not be a good tool to evaluate the effects of prey depletion on large carnivore populations.
Our results have several important limitations. We were unable to monitor leopard recruitment effectively, and recruitment could be affected by low prey density (Balme et al., Reference Balme, Batchelor, de Woronin Britz, Seymour, Grover and Hes2013). Our survival estimates were not partitioned across age classes (because we could not reliably age leopards using camera-trap photographs), which could have obscured variation in survival among age–sex classes. We note that survival rates for leopards outside our core study area, where human pressures are stronger (Watson et al., Reference Watson, Becker, Milanzi and Nyirenda2014; Overton et al., Reference Overton, Davies, Nguluka, Chibeya, Sompa, Simukonda and Lindsey2017), could be lower given lower overall leopard survival in human dominated landscapes (Swanepoel et al., Reference Swanepoel, Somers and Dalerum2015a,Reference Swanepoel, Somers, van Hoven, Schiess-Meier, Owen and Snymanb). Wire-snare poaching could also be a source of mortality for leopards (Becker et al., Reference Becker, McRobb, Watson, Droge, Kanyembo, Murdoch and Kakumbi2013; Rosenblatt et al., Reference Rosenblatt, Becker, Creel, Droge, Mweetwa and Schuette2014; Schuette et al., Reference Schuette, Namukonde, Becker, Watson, Creel and Chifunte2018), although we did not detect any snared leopards on our study site during the course of the study and snared leopards are rarely detected in Kafue, in contrast to snared wild dogs, spotted hyenas, and lions (Zambian Carnivore Programme, unpubl. data). Limited observations of snared leopards could be due in part to individuals succumbing to snares without ever breaking loose (Loveridge et al., Reference Loveridge, Sousa, Seymour-Smith, Hunt, Coals and Donnell2020), as well as their cryptic nature.
Another limitation of our study was the inability to estimate abundance in multiple years, because of insufficient recapture rates. As a consequence, we were unable to evaluate potential annual trends in abundance, limiting our inferences about density to a single year. With that caveat, we did not observe substantial fluctuations in the number of leopards detected throughout the course of the study, and known individuals were consistently detected across multiple years (Table 1). Sample sizes were small, which may lead to unreliable abundance estimates (White et al., Reference White, Anderson, Burnham and Otis1982), although precision was comparable to other published studies (Henschel et al., Reference Henschel, Hunter, Coad, Abernethy and Mühlenberg2011; Stein et al., Reference Stein, Fuller, Destefano and Marker2011; Maputla et al., Reference Maputla, Chimimba and Ferreira2013; Swanepoel et al., Reference Swanepoel, Somers and Dalerum2015a,Reference Swanepoel, Somers, van Hoven, Schiess-Meier, Owen and Snymanb). Nonetheless, given that estimates of population size for leopards in miombo woodland are limited (Balme et al., Reference Balme, Hunter and Slotow2007; Rosenblatt et al., Reference Rosenblatt, Creel, Becker, Merkle, Mwape, Schuette and Simpamba2016), especially where prey densities are disproportionately reduced, our density estimates are of high value from a conservation and management perspective.
Although legal trophy hunting of adult male leopards occurred in Game Management Areas adjacent to the Park, except during a moratorium from January 2013 to April 2015 (Rosenblatt et al., Reference Rosenblatt, Creel, Becker, Merkle, Mwape, Schuette and Simpamba2016), trophy hunting was not a known direct cause of leopard mortality in this study. However, the effects of trophy hunting on leopard population dynamics (Balme et al., Reference Balme, Hunter and Slotow2009a,Reference Balme, Slotow and Hunterb, Reference Balme, Slotow and Hunter2010; Packer et al., Reference Packer, Brink, Kissui, Maliti, Kushnir and Caro2011) are an important consideration closer to the edge of the Park and within the Game Management Areas. We recommend that legal harvest quotas reflect lower leopard densities expected in Game Management Areas (Rosenblatt et al., Reference Rosenblatt, Creel, Becker, Merkle, Mwape, Schuette and Simpamba2016) and account for the compounding effects of growing human pressures in the Game Management Areas on both leopards and their prey (Watson et al., Reference Watson, Becker, Milanzi and Nyirenda2014; Rosenblatt et al., Reference Rosenblatt, Creel, Becker, Merkle, Mwape, Schuette and Simpamba2016, Reference Rosenblatt, Creel, Schuette, Becker, Christianson and Dröge2019; Overton et al., Reference Overton, Davies, Nguluka, Chibeya, Sompa, Simukonda and Lindsey2017).
Overall, we observed moderate leopard density, good survival rates for both males and females, and consistent detections of individuals between years, strongly suggesting that the leopard population was relatively stable within our core study area. Research providing reliable and precise estimates of critical population parameters must continue throughout the Greater Kafue Ecosystem, to evaluate the effectiveness of management decisions and to allow a comparison of our findings with data from less-protected portions of the ecosystem. More broadly, similar research to describe the distribution and dynamics of intact carnivore guilds in response to prey depletion is essential across sub-Saharan Africa.
Acknowledgements
We thank the Zambia Department of National Parks and Wildlife for permission to conduct this research, and for collaborative efforts to help monitor, manage and conserve these herbivore and carnivore populations. This research was supported by the National Science Foundation (IOS1145749), National Geographic Society Big Cats Initiative, Gemfields Inc., WWF Netherlands and Zambia, The Bennink Foundation, The Rufford Foundation, Wilderness Wildlife Trust, Painted Dog Conservation, Panthera, Ntengu Safaris, Elephant Charge, and IUCN Save Our Species/EU. Our findings and conclusions do not necessarily represent the views of the U.S. Fish & Wildlife Service. This publication was produced with the financial support of the EU through IUCN Save Our Species, and is the sole responsibility of the Zambian Carnivore Programme and does not necessarily reflect the views of IUCN or the EU.
Author contributions
Analysis, writing: MAV, SC; study design: SC, ER; field work: MAV, ER, CS, BG, KB; funding acquisition: MSB, ER, SC; project administration: MSB, CC, CS; revision, editing: MAV, SC, ER, PS, MSB, CS, BG, KB, CC, CS.
Conflicts of interest
None.
Ethical standards
This research abided by the Oryx guidelines on ethical standards.


 Open access