


Introduction
Negative interactions between people and wildlife, often referred to as human–wildlife conflict, are one of the primary challenges to large carnivore conservation (Treves & Karanth, Reference Treves and Karanth2003), particularly in Europe where human populations and activities often overlap with the ranges of large carnivores. Such negative interactions are often related to wild animals’ use of biological resources that are produced (e.g. crops, livestock, beehives) or exploited (e.g. game) by humans (Kruuk, Reference Kruuk2002). The evaluation of such damage, the underlying drivers and the efficacy of damage prevention and compensation frameworks is crucial for large carnivore conservation (Schwerdtner & Gruber, Reference Schwerdtner and Gruber2007; Rigg et al., Reference Rigg, Finďo, Wechselberger, Gorman, Sillero-Zubiri and Macdonald2011). This is particularly important for species such as the brown bear Ursus arctos because damage caused by bears tends to attract less public attention than that caused by wolves or large felids. As a result, public institutions focus less on assessing the impact of such damage on rural populations, which limits the efficiency of mitigation measures (Can et al., Reference Can, D'Cruze, Garshelis, Beecham and Macdonald2014). In this analysis we use the term conflict to refer broadly to incidents caused by brown bears and the term damage to refer specifically to economic losses.
Brown bears were present historically throughout continental Europe (Zedrosser et al., Reference Zedrosser, Dahle, Swenson and Gerstl2000; Trouwborst, Reference Trouwborst2010), but were nearly extirpated from western and southern Europe and from many areas in eastern and northern Europe before World War II, primarily as a result of deforestation and human persecution (Zedrosser et al., Reference Zedrosser, Dahle, Swenson and Gerstl2000; Huber et al., Reference Huber, Kusak, Majić-Skrbinšek, Majnarić and Sindičić2008a; Trouwborst, Reference Trouwborst2010). However, bear behaviour is plastic and bears can adapt to certain levels of disturbance. This, along with increasing conservation efforts, rural abandonment and rewilding of many European regions, has allowed bears to gradually reoccupy former habitats (Huber et al., Reference Huber, Kusak, Majić-Skrbinšek, Majnarić and Sindičić2008a).
In Croatia brown bears occur in the Dinaric Mountains, from Slovenia to Bosnia and Herzegovina and further south-east (Servheen et al., Reference Servheen, Herrero and Peyton1999; Zedrosser et al., Reference Zedrosser, Dahle, Swenson and Gerstl2000), with an estimated population of c. 1,000 (Kocijan & Huber, Reference Kocijan and Huber2008; Majić et al., Reference Majić, Marino Taussig de Bodonia, Huber and Bunnefeld2011; Knott et al., Reference Knott, Bunnefeld, Huber, Reljić, Kereži and Milner-Gulland2014). Brown bear management is challenging because of the species’ biological and ecological characteristics (large body, long gestation period and opportunistic feeding strategy) and its history of conflicts with people. In Croatia the majority of human–bear conflicts result from livestock depredation and crop use (Nyhus et al., Reference Nyhus, Osofsky, Ferraro, Fischer, Madden, Woodroffe, Thirgood and Rabinowitz2005; Majić et al., Reference Majić, Marino Taussig de Bodonia, Huber and Bunnefeld2011; Bautista et al., Reference Bautista, Naves, Revilla, Fernández, Albrecht and Scharf2017). The most common strategies to minimize these conflicts include prevention tools and compensation schemes (Treves & Karanth, Reference Treves and Karanth2003). In Croatia the latter have been the focal approach, aiming to distribute damage costs between the conservation beneficiary (government or hunting organizations) and the person or institution suffering the damage (Fourli, Reference Fourli1999; Nyhus et al., Reference Nyhus, Fischer, Madden and Osofsky2003). There are two types of compensation schemes: ex-post compensation, which is paid after damage occurs, and compensation in advance, which is paid prior to any damage occurring and based on an estimation of expected losses (Schwerdtner & Gruber, Reference Schwerdtner and Gruber2007). Regardless of the type of scheme being used, the priority should be to prevent damage from occurring or to minimize its impact. This requires an understanding of the types and cost of damage events, their frequency, and the spatial distribution and patterns of such incidents. (Gunther et al., Reference Gunther, Haroldson, Frey, Cain, Copeland and Schwartz2004; Wilson et al., Reference Wilson, Graham, Mattson and Madel2006; Can et al., Reference Can, D'Cruze, Garshelis, Beecham and Macdonald2014).
In Croatia mitigation of human–bear conflict is based primarily on the ex-post compensatory approach, although bear hunting is also allowed as a strategy to minimize conflicts. Ex-post compensation is managed and paid by local hunting organizations, which have an allocated quota for bear hunting (Huber et al., Reference Huber, Kusak, Majić-Skrbinšek, Majnarić and Sindičić2008a; Majić et al., Reference Majić, Marino Taussig de Bodonia, Huber and Bunnefeld2011; Bišćan et al., Reference Bišćan, Budor, Domazetović, Fontana Pudić, Francetić and Gospočić2016). However, when damage occurs in national parks, the government is responsible for paying compensation (Huber et al., Reference Huber, Kusak, Majić-Skrbinšek, Majnarić and Sindičić2008a). Damage will usually be fully compensated only if the person or institution suffering it has previously implemented protection measures (e.g. proper fencing) and behaves responsibly (e.g. by guarding livestock and not planting crops that entice bears near the forest edge; Huber et al., Reference Huber, Kusak, Majić-Skrbinšek, Majnarić and Sindičić2008a,Reference Huber, Jakšić, Frković, Štahan, Kusak and Majnarićb); but occasionally hunting organizations compensate for damage in the absence of protection measures by providing the farmer with an amount of crops equivalent to the damage caused by bears. To apply compensation strategies efficiently, it is crucial to review available data, so that damage patterns can be detected and research needs identified (Bruggers et al., Reference Bruggers, Owens and Hoffman2002). No such analysis has previously been carried out in Croatia, and we aim to contribute new insights for a better understanding of human–bear conflicts. Specifically, our objectives are to (1) analyse brown bear damage in Croatia during 2004–2014, including the type of damage, associated costs, and the factors determining damage patterns, (2) determine if preventative tools reduce brown bear damage and associated costs, and (3) identify bear damage hotspots.
Methods
Damage claims and costs
We analysed all damage reports for 2004–2014 that were systematically collected and provided annually by hunting organizations to the Croatian Ministry of Agriculture. When damage occurs and is reported, the hunting organization responsible for managing the area fills out a report and sends it to the Croatian Ministry of Agriculture, where the information about the type and amount of damage, date and location of the incident, name of the injured party, and presence of any preventative measures are compiled. We included in our analysis all reported claims that were confirmed as damage caused by bears, including claims that were and were not subsequently compensated for.
We analysed the number of damage claims, the cost associated with the damage and the frequency of incidents by damage type. Damage type was categorized as losses associated with crops, orchards/vineyards (including domestic gardens), beehives, and wildlife/game feeders. Corn feeders are widely used in Croatia to provide extra food for game species such as red deer Cervus elaphus, wild boar Sus scrofa and bears. Additionally, we analysed incidents involving damage to property such as barn doors, vehicles, shooting posts or silage depots, and losses of livestock and domestic animals. For the latter category, we assessed the number of bear attacks per type of livestock and domestic animal (poultry, cattle, red deer, dogs, donkeys, goats, horses, ostriches, pigs, rabbits and sheep). To test whether there was a positive or negative trend in the total number of damage events per year we used a linear regression model (Zar, Reference Zar2010), and χ 2 tests (Zar, Reference Zar2010) to assess if the number of damage events (observed values) differed between damage types. We gathered data on the intensity of livestock depredation by bears across Europe using the estimations of the annual per capita loss presented by Kazcensky (Reference Kaczensky1999), i.e. the number of livestock lost per year and per bear. For Croatia, we used the methodology described by Kazcensky (Reference Kaczensky1999) to estimate this metric, allowing us to compare livestock depredation across all European countries where brown bears occur. The number of bears used for this calculation was the annual estimate of the total bear population in Croatia, as provided by the hunting organizations. To identify damage types that have the biggest impact in terms of cost, we defined the following damage categories: Wildlife feeder, Beehive, Orchards, Crops, Livestock and domestic animals, and Other. We used partial least square regressions (Roy & Roy, Reference Roy and Roy2008; Carrascal et al., Reference Carrascal, Galván and Gordo2009) to determine the influence of these damage categories (all binary variables), together with the presence of protective measures on the damage compensation paid. Model significance was assessed by a Stone–Geisser Q2 test, which evaluates the accuracy of models and their parameters compared to observed values through a cross-validation process (Götz et al., Reference Götz, Liehr-Gobbers, Krafft, Vinzi, Chin, Henseler and Wang2010). We used Q2 ≥ 0.0975 (Cao et al., Reference Cao, Rossow, Robert-Granié and Besse2008) to assign significance to the contribution of the predictors, and R 2 to assess the proportion of the total variance that was explained by the model (Zar, Reference Zar2010).
We evaluated whether the frequency of damage to domestic animals decreased when protective measures were used, by testing whether the number of damage claims differed between properties using protection measures (Cat1) and those without them (Cat2), using a χ 2 test. All analyses were performed using R 3.2.3 (R Development Core Team, 2015), and partial least square regression models were built using the package plsdepot (Sanchez, Reference Sanchez2012).
Damage hotspots
We analysed the spatial distribution of damage claims using a geographical information system. Hotspot areas were delineated using the Optimized Hot Spot Analysis tool in ArcMap 10.4.1 (Esri, Redlands, USA). Each damage location, defined by its latitude and longitude coordinates, was assigned to a 10 × 10 km2 grid cell on a map of Croatia. For each grid cell, we tallied the number of damage events and calculated the Getis–Ord Gi* statistic (Songchitruksa & Zeng, Reference Songchitruksa and Zeng2010) by scoring it with a z-score and probability. The resulting z-score was based on the distance between cells and the number of damage events within them. Thus, cells with high numbers of damage events that were in close proximity to each other produced high z-scores. To be characterized as a statistically significant hotspot, a cell had to be surrounded by cells with high z-scores and probabilities (Ord & Getis, Reference Ord and Getis1995). These statistics allowed us to compare the number of damage events in each cell and its neighbouring cells to the mean number of damage events per grid cell across the entire study area. Where any observed difference is larger than expected by chance, a statistically significant z-score is achieved. We used the Getis–Ord Gi* statistic to identify patterns in positive spatial clustering. This allowed us to discriminate between cells of high and low spatial association (Songchitruksa & Zeng, Reference Songchitruksa and Zeng2010), and to generate a density surface raster layer.
Factors influencing bear damage frequency
To evaluate which factors influence damage frequency (the number of damage claims per area) in each hunting reserve (the damage compensation management unit in Croatia), we used generalized linear models (Zuur et al., Reference Zuur, Ieno and Smith2007), with a Gaussian distribution. We defined four hypotheses that could potentially explain differences in damage frequency between different areas.
The land cover hypothesis (H1) assumes that herbaceous vegetation is a habitat used by bears (Posillico et al., Reference Posillico, Meriggi, Pagnin, Lovari and Russo2004) and examines whether damage occurred more frequently in such areas. Land cover variables were extracted from Corine 2012 land cover maps (CLC, 2012): per cent of forests, scrub and/or herbaceous vegetation, artificial surfaces or houses, arable land and permanent crops, heterogeneous agricultural areas (a surrogate for the presence of human activities) and wetlands, water bodies, and the number of villages within each hunting reserve (see CLC, 2012, for definitions of these categories).
The landscape protection status hypothesis (H2) tests whether areas where bears were not hunted acted as source environments (Hansen, Reference Hansen, Liu, Hull, Morzillo and Wiens2011) and were therefore subject to more frequent damage events. The landscape protection status is the distance in km between the edge of a hunting reserve and the nearest edge of a protected area.
The bear population characteristic hypothesis (H3) examines whether more stable populations and constant presence of bears lead to more frequent damage events. Bear occurrence was based on the Croatian Bear Management Plan and the LIFE DinAlp Bear project report (i.e. constant vs sporadic presence; Huber et al., Reference Huber, Jakšić, Frković, Štahan, Kusak and Majnarić2008b; Skrbinšek et al., Reference Skrbinšek, Bragalanti, Calderolla, Groff, Huber and Kaczensky2015) and the number of bears ≥ 8 years old that were hunted and killed in hunting reserves was used as a surrogate for population stability.
The hybrid hypothesis (H4) used variables included in the best-fit models from each of the previous hypotheses where the 95% confidence interval of their coefficients did not include zero. This allowed us to detect a positive or negative influence on the damage frequency.
We first tested for data multicollinearity using Spearman's correlation coefficient (ρ; Zar, Reference Zar2010), and identified outliers by using a χ 2 test (Komsta, Reference Komsta2011). Variables were considered highly correlated if ρ > 0.7. When two covariates were correlated we excluded those less correlated with the dependent variable.
We built models using all possible combinations of the covariates for each hypothesis and based our model selection on the Akaike Information Criterion corrected for small samples (AICc; Burnham & Anderson, Reference Burnham and Anderson2002). Models with ΔAICc < 2 were considered the most parsimonious (Burnham & Anderson, Reference Burnham and Anderson2002).
We compared the AICc of the best models in each hypothesis and that of the hybrid hypothesis (H4) using R (R Development Core Team, 2015) together with the MuMIn package (Barton, Reference Barton2015). Model evaluation was performed using the pseudo R2 and the likelihood ratio test comparing the deviance of the null best model (Dobson, Reference Dobson2002).
Results
Damage claims and costs
During 2004–2014 a total of 343 claims for damage caused by bears were reported to the Croatian Ministry of Agriculture, a mean of c. 31 per year. A total of EUR 71,477 was paid in compensation during this period, with a mean of EUR 6,498 per year. There was no trend in the annual number of claims over this period (Spearman correlation coefficient = −0.451, P = 0.164). There was a significantly higher proportion of claims associated with crop damage to corn, oat and hay fields compared to the other types of damage (31% of all damage claims; χ 2 = 32.318; P < 0.05; Fig. 1).

Fig. 1 Proportion (%) of different types of asset damaged by brown bears Ursus arctos of the total number of bear-related damage claims and associated costs in Croatia (2004–2014).
A different pattern was evident when we analysed the amount of damage costs. The majority of the total compensation was paid for damage to beehives, crops and domestic animals, including livestock (21% each; Fig. 1). The number of damage claims and associated costs from beehives, crops and domestic animals was significantly higher (χ 2 = 23.838; P < 0.05) where protective measures were absent. Most livestock damage claims were associated with sheep (34%, 92 sheep killed in 22 attacks, mean 4.2 per attack) and chickens (28%; 169 chickens killed in 18 attacks, mean 9.4 per attack), with multiple individuals usually killed in an incident. Attacks on individual animals involved mostly large mammals such as donkeys, horses and red deer (which are also raised as farm animals in Croatia), but also ostriches and dogs (Supplementary Table 1). The number of animals killed per attack was typically greater where protective measures had been implemented compared to those where protective measures had not been implemented (Supplementary Table 1).
The reports showed that 240 beehives, 170 of which were unprotected, were damaged in 47 events. The mean number of beehives damaged per attack was 5.1 (5.4 without and 4.4 with protection) and the mean monetary value per damaged beehive was EUR 100.
The mean intensity of livestock depredation (annual per capita loss) during 2004–2014 was 0.05 livestock per bear per year. For beehives, the intensity of depredation was 0.03 hives per bear per year. These calculations are based on the estimated annual bear population in the country, which ranged from 850 in 2004 to 1,000 in 2014.
Partial least squares regression analysis showed that c. 19% of damage cost variability was explained by the type of damage and whether protective measurements were present. The Stone–Geisser Q2 test value was 0.159, indicating that model estimates were accurate (i.e. > 0.0975). The amount of compensation was most influenced by the type of damage, with higher values primarily associated with beehives (load = 0.408, weight = 0.406; Table 1) and wildlife feeders (load = 0.448, weight = 0.482; Table 1). Conversely, orchard damage contributed less to damage costs, with a negative correlation with the total cost of damage (load = −0.780, weight = −0.750; Table 1).
Table 1 Influence of assessed variables on compensation paid for damage caused by brown bears Ursus arctos in Croatia during 2004–2014, with their loads and weights on the first component of partial least squares regression. A variable's weight is its contribution to the first component of partial least squares regression.

Damage hotspots
We identified a hotspot where most damage claims were clustered, in the north-west of the brown bear range in Croatia, near the border with Slovenia (Fig. 2).
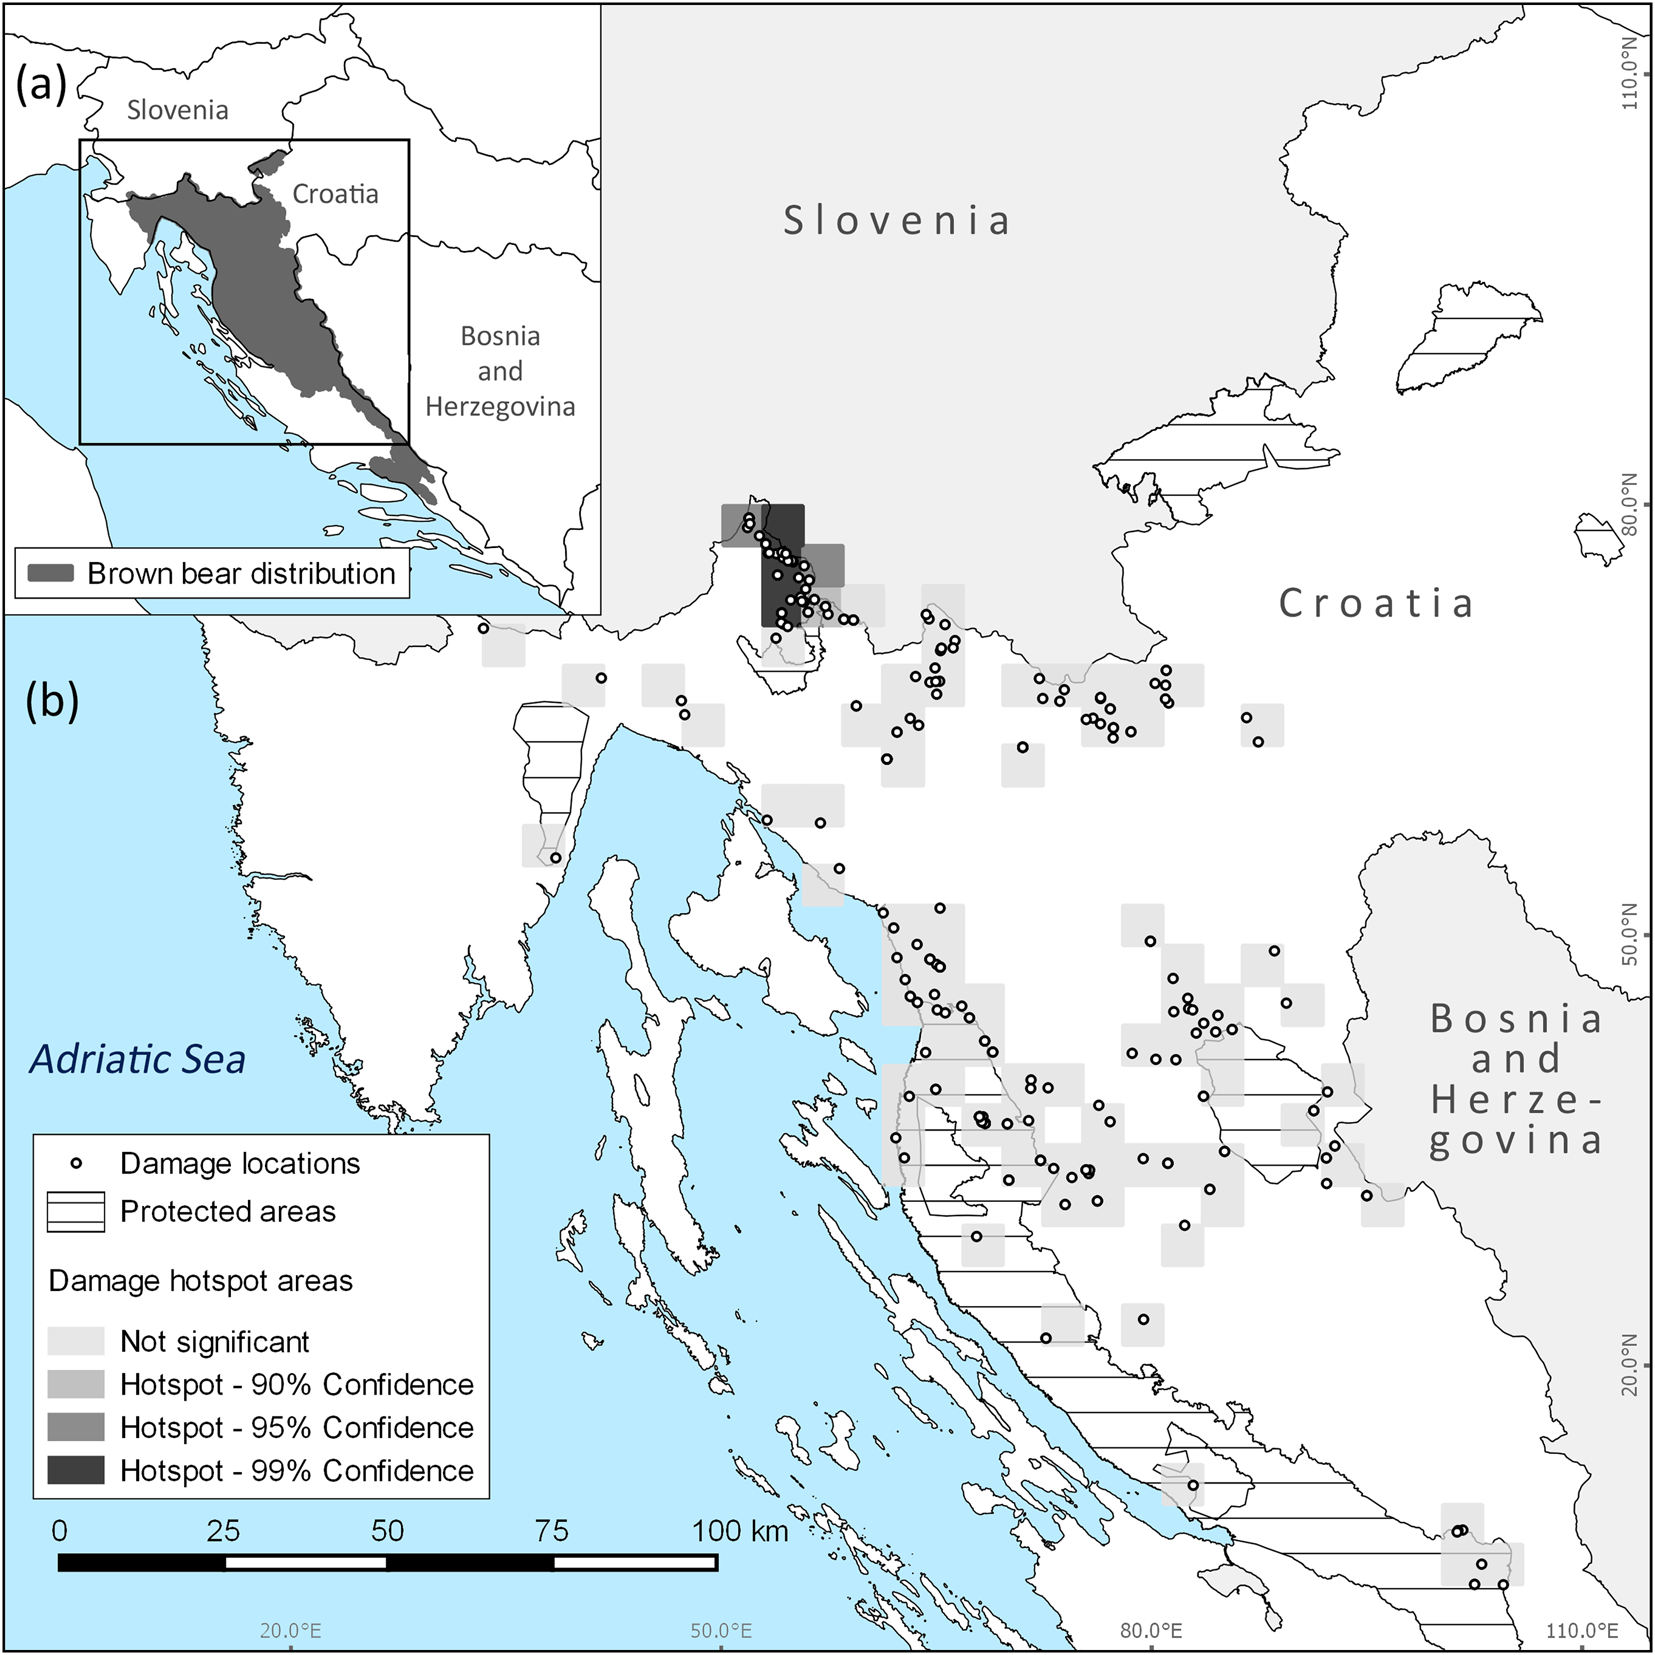
Fig. 2 Brown bear distribution (a) and damage claim locations and hotspots (b) in Croatia for 2004–2014.
Factors influencing bear damage frequency
The values for per cent cover of forests and scrub and/or herbaceous vegetation were highly correlated (r = −0.701, P < 0.001) and therefore we excluded the latter from the generalized linear model analysis, as it was less correlated than the former with the dependent variable. We identified three outliers, which were also excluded. Five, one and three models were identified as the best models for the land cover, landscape protection status and bear population characteristics hypotheses, respectively (Table 2; Supplementary Material 1). The hybrid hypothesis models had lower AICc values (1276.9–1278.9), with a minimum ΔAICc of 4.7 for the lowest model for the other hypotheses, and thus had the highest support. Of the models built for this hypothesis, two were the most parsimonious, having ΔAICc < 2 (Table 2). However, the ΔAICc values of the second-best model were close to the threshold of 2: the difference is because the best model has one variable less (see AICc formula in Burnham & Anderson, Reference Burnham and Anderson2002). Model averaging is less appropriate in such situations and the most parsimonious model should be selected (Banner & Higgs, Reference Banner and Higgs2017). For the three variables included in the best models of the hybrid hypothesis, the 95% confidence interval did not include zero, so it is possible to determine whether their effect on the dependent value is positive or negative. Distance to the nearest protected area had a negative effect on the number of bear damage events per km2, whereas the number of villages and the per cent of forest cover within the hunting reserves had a positive effect (Table 3). The best model's pseudo R2 was 0.097 (Table 3) and was better fitted than the null model (χ 2 = 1377.4; P < 0.001; Table 3).
Table 2 Best generalized linear regression models (ΔAICc < 2) for each hypothesis formulated to explain variation in bear damage frequency, ranked by the ΔAICc values. Overall best models are in bold.

1 Akaike Information Criterion, adjusted for small sample size.
2 Difference from best ranking (lowest AIC) model for the same hypothesis.
3 Difference from best ranking (lowest AIC) model across all hypotheses.
4 Best model.
5 Second-best model.
Table 3 Variables included in overall best model (hybrid hypothesis), and their coefficients (standardized using the partial standard deviations), standard errors, z-values, significance and 95% CI. Variables for which the 95% CI does not include zero are in bold.

Discussion
To address human–bear conflicts effectively it is imperative to identify the types of damage and the geographical distribution of damage events. This is critical for effective wildlife management, conservation planning and for targeting conflict mitigation measures in areas where negative impacts on people and bears can be minimized.
The majority (60%) of compensation claims related to bears in Croatia were made for damage to crops and orchards. In contrast, Bautista et al. (Reference Bautista, Naves, Revilla, Fernández, Albrecht and Scharf2017) found that > 50% of bear damage events in western Europe involved livestock losses and destruction of apiaries. This difference is probably a result of higher accessibility and availability of crops and orchards to bears in Croatia, although no systematic data are currently available regarding the availability of such commodities in Croatia. Compensation costs were highest for damage to crops, livestock or domestic animals, and beehives, each accounting for c. 21% of the total compensation payments made (i.e. together, representing 63% of the total payments). There was a high, positive correlation between the compensation paid and the damage associated with beehives and wildlife feeders, with the converse for orchards. Beehives and feeder structures are highly valuable and damage to them often results in complete economic loss. In orchards, bears may feed in a less destructive manner, picking fruit from trees and causing less damage as a result, although they may occasionally destroy trees (Mahmoud et al., Reference Mahmoud, Qashqaei, Marashi and Nejat2017).
There was no trend in the number of damage events per year during 2004–2014, although in 2005 the number of damage claims was particularly high, with 92 recorded events. Local communities reported a sharp decrease in beechnut Fagus sylvatica and wild berry abundance in this year (DH, pers. obs.). This shortage of forest foods may have led bears closer to villages in search of alternative food sources and may have resulted in an increased number of damage events. Although the bear population appears to be increasing in Croatia (Bautista et al., Reference Bautista, Naves, Revilla, Fernández, Albrecht and Scharf2017), the mean number of damage claims per year per bear is one of the lowest in Europe (Bautista et al., Reference Bautista, Naves, Revilla, Fernández, Albrecht and Scharf2017).
The application of effective preventative measures or an increase in habitat productivity may be contributing to the relatively low and stable number of damage claims. However, further research is needed to examine the mechanisms behind this pattern.
A possible factor could be supplementary feeding during hunting periods (March–May and September–December) in Croatia, which, together with abundant wild forest foods, may keep bears away from human settlements because it reduces their need to seek and exploit anthropogenic food sources (Bautista et al., Reference Bautista, Naves, Revilla, Fernández, Albrecht and Scharf2017). However, it is the converse in Slovenia (Jerina et al., Reference Jerina, Jonozovič, Krofel and Skrbinšek2013; Kavčič et al., Reference Kavčič, Adamič, Kaczensky, Krofel and Jerina2013), with an increase in bear densities and bear-related damage events apparently linked to supplementary feeding. Such differences may be linked to specific landscape characteristics and species distribution patterns, but the exact reasons are difficult to determine. The bear population in Slovenia is concentrated in only 19% of the country, reaching mean densities of 13 bears/100 km2 and high natality rates in those areas, which are supported by supplementary feeding sites (Jerina et al., Reference Jerina, Jonozovič, Krofel and Skrbinšek2013; Kavčič et al., Reference Kavčič, Adamič, Kaczensky, Krofel and Jerina2013). In Croatia the bear population is concentrated in 21% of the country and the mean density is lower than in Slovenia (8 bears/100 km2). The higher bear density in Slovenia results in a higher number of bears inhabiting areas near human settlements, and the spatial distribution of forests and settlements allows bears to visit feeding sites in forests and human settlements during the same night (Kavčič et al., Reference Kavčič, Adamič, Kaczensky, Krofel and Jerina2013), increasing the likelihood of damage.
Our data confirm that agricultural or livestock areas without protective measures are more likely to be damaged by bears. Most damage to beehives and livestock is avoidable, considering that effective protection measures exist (Swenson et al., Reference Swenson, Gerstl, Dahle and Zedrosser2000). Electric fences, for example, are effective against bears (Coordination Board for Bear Management in Austria, 2005), but many farmers are still reluctant to use them, probably because of the associated cost. Little research has been done in Croatia to test the efficacy and functionality of damage protection measures, but farmers should be involved in developing and implementing preventative measures that could reduce damage claims. Crop protection can be more costly than the protection of livestock and beehives, particularly for large fields, but alternative approaches can be implemented. For example, it is common practice in Croatia for hunting ground managers to compensate the owners of damaged cereal crop fields by providing an amount of replacement cereals equal to the crop loss caused by bears rather than through financial compensation.
Although the number of damage events affecting livestock or domestic animals was lower when protective measures were in place, there is a tendency for a greater number of animals to be killed per attack. This could be because confined domestic animals become more vulnerable when bears destroy or overcome the protective measures, as their ability to escape is limited by the barriers put in place to prevent access.
Although Croatia has intermediate levels of livestock density within the European Union (EU; Eurostat, 2016) and bears do cause damage to livestock or domestic animals, the country's annual per capita loss of livestock to bears (0.05) is the lowest among European countries. For example, in Sweden, which has one of the lowest EU livestock densities (Eurostat, 2016), the annual per capita loss value is twice that in Croatia (Kaczensky, Reference Kaczensky1999). However, annual per capita loss estimates are dependent on the robustness of bear population estimates. We used the official estimates published by the Croatia government, but these may not be accurate because hunting organizations often deal with compensation claims without reporting them to government institutions; our results should therefore be interpreted cautiously. This situation could be related to the compensation method used in Croatia. Because a majority (> 75%) of hunters are also farmers, and as a hunting right, land owners are responsible for damage management in Croatia, they may be more protective of their livestock or domestic animals compared to their counterparts elsewhere in Europe, for example by keeping their animals in shelters during the night when bears are more active. Most of the damage associated with livestock is a result of predation on sheep, one of the preferred prey of brown bears in the area, which is consistent with data collected in other European countries (e.g. Slovenia; Kavčič et al., Reference Kavčič, Adamič, Kaczensky, Krofel and Jerina2013). Farmers in Croatia traditionally manage sheep flocks in open areas, making them easier prey for bears (Fourli, Reference Fourli1999; Dečak et al., Reference Dečak, Frković, Grubešić, Huber, Iviček and Kulić2005; Huber et al., Reference Huber, Jakšić, Frković, Štahan, Kusak and Majnarić2008b). Similarly, the high number of chickens killed per attack is a result of the management practice of keeping large numbers of chickens in henhouses.
Beehive annual per capita loss in Croatia (0.03) is lower than in other European countries, e.g. Greece (1.0; Karamanlidis et al., Reference Karamanlidis, Sanopoulos, Georgiadis and Zedrosser2011). This may be a result of the higher numbers of beehives available per location in the brown bear range in Greece compared to Croatia and probably explains a higher number of beehives being damaged in an attack when unprotected (Svečnjak et al., Reference Svečnjak, Hegić, Kezić, Turšić, Dražić, Bubalo and Kezić2008).
Preventative measures are an important tool for mitigating brown bear damage, but some stakeholders do not apply them. We recommend that compensation should be linked to the implementation of damage prevention measures (Coordination Board for Bear Management in Austria, 2005) to encourage their use and ensure a low level of damage (and consequently of cost and conflict). Hunter-farmers are more likely to implement preventative measures because they are involved with the institutions that pay for bear damage. The amount of damage and number of claims may decrease when protective measures are implemented, with a consequent amelioration of human–bear conflict.
We detected a damage hotspot in the north of Croatia near Risnjak National Park. This protected area (63.5 km2) is relatively small compared to the size of a typical brown bear home range (224 and 147 km2 for males and females, respectively; Huber & Roth, Reference Huber and Roth1993). However, the Park is a refuge for wildlife because of its undisturbed habitat and it is probably important for bears because it provides dens where they can hibernate more safely than in agricultural areas (Petram et al., Reference Petram, Knauer and Kaczensky2004).
The conflict in this area could be a result of the bears’ population dynamics in the adjacent protected area. Our model results indicated that hunting reserves close to protected areas had a higher damage frequency, and that areas with higher forest cover and a higher concentration of villages were more likely to suffer damage. This may indicate a synergistic effect of forests as a protective environment where bears can move freely without being detected (Posillico et al., Reference Posillico, Meriggi, Pagnin, Lovari and Russo2004), and the presence of human activity, which may provide easily accessible food for bears, resulting in an increased number of damage events (Northrup et al., Reference Northrup, Stenhouse and Boyce2012). Mitigation efforts should therefore be focused on agricultural landscapes near protected areas and forests.
The robustness of our analysis depends on the quality of the data on damage reports, and not all damage claims may be reported to the national authorities. However, given that compensation is paid only if damage is reported, we are confident that the hotspot we identified is based on a real pattern of damage clustering in this area.
Although our analysis has the potential to improve human–wildlife coexistence in Croatia, our results also show that only a small fraction of the data variability is explained by our models. Other factors that were not considered may influence patterns of damage, indicating the need for a broader analysis of the determinants of damage in Croatia. The close relation between those making claims (i.e. farmer-hunters) and the organizations responsible for compensation payments presents an opportunity to reduce conflict further through prevention. Such an approach would help maintain economic sustainability and cultural traditions in Croatia while also protecting the brown bear population.
Acknowledgements
This study was supported by the LIFE DINALP BEAR project, EURONATUR and Bernd Thies Foundation, and the Ministry of Agriculture of Croatia. DH, LMR and CF were supported financially by the University of Aveiro (Department of Biology), CESAM (UID/AMB/50017), and FCT/MEC through national funds, and co-funding by the FEDER within the PT2020 Partnership Agreement and Compete 2020.
Author contributions
Data collection: DH and SR; data analysis: DH, SR and LMR; writing and revisions: DH, LMR, CF, ĐH and SMW; project coordination: ĐH.
Conflicts of interest
None.
Ethical standards
This research complies with the Oryx Code of Conduct for authors.


