


Depressive disorders are a leading cause of disability-adjusted life years that occur throughout the world( Reference Ferrari, Charlson and Norman 1 ). Depressive disorders commence in childhood. A meta-analysis of predominantly Western studies found a prevalence of major depressive disorder of 2·8 % in those aged less than 13 years and of 5·6 % in those aged 13–18 years( Reference Costello, Erkanli and Angold 2 ). A Taiwanese study reported a prevalence of 12·3 % in adolescents aged 13–18 years, demonstrating the importance of this issue in Taiwan( Reference Lin, Tang and Yen 3 ).
Diet is one of the many factors associated with depression( Reference Lopresti, Hood and Drummond 4 ) and the dietary habits of children and adolescents have changed over time( Reference Moreno, Rodriguez and Fleta 5 ). In the USA both the proportion of sweetened drinks and the amount of beverages consumed by 6–11-year-olds have increased significantly between 1989 and 2008. Additionally, the consumption of caloric nutritional beverages has decreased( Reference Lasater, Piernas and Popkin 6 ). In China between 1991 and 2009, the prevalence of snack foods, the frequency of daily snack food consumption and the percentage of total daily energy intake from snacks have also all demonstrated significant annual increases, particularly in children( Reference Wang, Zhai and Zhang 7 ). Although snack foods in China include low-energy-density fruits and grains, the proportion of snacks that are sweetened drinks or fast foods has continued to increase. In Taiwan, the 2001–2002 Nutrition and Health Survey of 6–12-year-olds found that intakes of protein-rich foods, salts/sauces and fats/oils were higher than Taiwanese daily recommended intakes whereas intakes of fruit, vegetables, cereals/grains and dairy products were lower than recommended( Reference Wu, Pan and Yeh 8 ).
A large body of research has already examined the relationship between unhealthy eating behaviours and depression( Reference Akbaraly, Sabia and Shipley 9 – Reference Weng, Hao and Qian 17 ). In such research, unhealthy eating behaviours refer to the behaviour that results in high intakes of energy, refined sugar, animal protein, saturated fat and salt, and low intake of fibre. Such diets tend to be energy dense or full of empty energy. The majority of studies have found a positive relationship between unhealthy eating behaviours and depression( Reference Akbaraly, Sabia and Shipley 9 – Reference Kim, Choi and Lee 14 , Reference Weng, Hao and Qian 17 , Reference Hoare, Millar and Fuller-Tyszkiewicz 18 ), with only a small number finding no support for this relationship( Reference Sugawara, Yasui-Furukori and Tsuchimine 16 ). In cross-sectional studies of Australian adult women( Reference Jacka, Pasco and Mykletun 13 ) or adolescents aged 10–14 years( Reference Jacka, Kremer and Leslie 11 ), Jacka et al. found that a higher Western diet score was associated with greater depressive symptoms. A cross-sectional survey of adults in Norway found that a healthy diet (a dietary pattern characterized by vegetables, fruit, meat, fish and whole grains) was associated with fewer depressive symptoms and an unhealthy diet (i.e. a Western diet) was associated with more anxiety symptoms( Reference Jacka, Mykletun and Berk 12 ). Asian cross-sectional research on adolescents in China( Reference Weng, Hao and Qian 17 ) and Korea( Reference Kim, Choi and Lee 14 ) has found a significant positive association between depression and consumption of fast foods and processed foods. However, longitudinal research on this association is limited. In longitudinal research by Jacka et al., in those aged 60–64 years at baseline a lower healthy diet score and a higher unhealthy diet score were both predictive of depressive symptoms. However, this relationship was not observed in the younger age groups( Reference Jacka, Cherbuin and Anstey 10 ).
Unhealthy eating could lead to depressive symptoms through a number of potential physiological mechanisms. Depressive emotions are associated with the dysregulation of neurotransmitter (e.g. serotonin) production and the synthesis of adequate amounts of neurotransmitters is associated with the availability of the nutrient tryptophan from dietary sources( Reference Wallin and Rissanen 19 , Reference Wurtman and Wurtman 20 ). Tryptophan, an essential amino acid, is a precursor of serotonin and can be found in protein-rich foods( Reference Otsuka, Goda and Iwamoto 21 ). In addition, several types of dietary lipid are important for brain membrane function and could be related to the aetiology of depression-related symptoms. This could explain why a diet low in n-3 PUFA may induce depression/anxiety-related behaviour through the role of n-3 on cell membrane fluidity or membrane lipid composition in the brain( Reference Muller, Reichel and Muhle 22 ). A high-fat, high-refined-sugar diet could also impair levels of brain-derived neurotrophic factor in the hippocampus, which could be another indirect underlying mechanism( Reference Durany, Michel and Zochling 23 , Reference Molteni, Barnard and Ying 24 ). Having a behaviour of taking unhealthy food frequently might lead to high intakes of fat and refined sugar and reduce the intakes of other nutrients.
In contrast to the perspective that poor diet leads to depression, research also points to the potential for depressive symptoms to lead to unhealthy eating. Empirical research has shown that middle-aged women with depressive symptoms consume more fast foods( Reference Crawford, Khedkar and Flaws 25 ), saturated fat and total sugars( Reference Whitaker, Sharpe and Wilcox 26 ). Adolescents with depressive symptoms perceive more barriers to eating a healthy diet( Reference Fulkerson, Sherwood and Perry 27 ) and adolescent girls may use snacks and junk food to regulate depressive symptoms( Reference Isasi, Ostrovsky and Wills 28 ). A study of children aged 5–11 years found that children with poorer psychological health were more likely to consume soda/sweetened drinks, French fries/fried potatoes and fast foods( Reference Banta, Khoie-Mayer and Somaiya 29 ). However, a more recent retrospective study in adults found that prior depression history was significantly associated with a better-quality diet at a later time point, while current depressive symptoms were associated with poorer dietary habits( Reference Jacka, Cherbuin and Anstey 30 ). This finding demonstrates that the influence of depression on dietary habits may differ in longitudinal studies and emphasizes the importance of longitudinal research when investigating the relationship between depression and diet.
Depressive symptoms may lead to more unhealthy choices through emotional eating behaviour, where food is used as a way of regulating negative emotions( Reference Whitaker, Sharpe and Wilcox 26 , Reference Dubé, LeBel and Lu 31 , Reference Canetti, Bachar and Berry 32 ). Different foods can result in different emotional responses( Reference Gibson 33 ). Most sweet foods make people feel happy whereas bitter or sour foods have the opposite effect. Sweet and fatty foods make people feel good and alleviate stress via opioidergic and dopaminergic neurotransmitters and enhanced function of the serotonergic system( Reference Gibson 33 ). Therefore, when people suffering from depression perceive stress they prefer to eat sugar- or fat-rich foods( Reference Gibson 33 ). Depression can also lead to decreased motivation to perform healthy behaviours, leading to increased consumption of high-energy foods( Reference Fulkerson, Sherwood and Perry 27 , Reference Adam and Folds 34 ).
The above-mentioned studies suggest that the relationship between depressive symptoms and unhealthy eating behaviours is reciprocal. Although some studies have mentioned the possibility of reciprocal causation( Reference Jacka, Pasco and Mykletun 13 , Reference Macht 35 ), no studies have been able to confirm this. The establishment of a bidirectional relationship would have important implications for the development of educational strategies and health policy aimed at reducing unhealthy eating and preventing depression.
In summary, past studies in this area have the following limitations. (i) They have examined only a unidirectional relationship: either the impact of diet on depression or the impact of depression on diet. (ii) They have been mostly of cross-sectional design. (iii) Research participants have been adolescents or adults rather than children. However, since the relationship between depressive symptoms and unhealthy eating behaviours can develop during childhood( Reference Michels, Sioen and Braet 36 ), from a prevention perspective it is essential to examine this relationship from childhood.
Therefore, the present study aimed to investigate the bidirectional relationship between unhealthy eating behaviours and depressive symptoms from childhood to adolescence. We used longitudinal data from Taiwan that followed students annually from the 2nd grade (8 years old) to the 11th grade (17 years old). We investigated how the frequency of unhealthy eating behaviours in a given year and the change in frequency between that year and the subsequent year influenced the level of depressive symptoms in the subsequent year and vice versa.
Methods
Data for the present study were drawn from the Child and Adolescent Behaviors in Long-Term Evolution (CABLE) study. CABLE commenced in 2001 and has annual follow-up assessments( Reference Chang, Wu and Wu 37 , Reference Yen, Chen and Lee 38 ). CABLE aims to monitor developments in children’s health behaviours and their associated factors on the basis of an ecological model that considers intrapersonal, interpersonal and organizational aspects. The clustered sampling frame comprised all public elementary schools in two areas in Taiwan: Taipei city and Hsinchu County. Nine schools were randomly selected from each area. The 1st graders (cohort 1) and 4th graders (cohort 2) in each school were enrolled as the baseline cohorts. Details about sampling procedure, sample size determination and instrument development of the CABLE study have been published elsewhere( Reference Yen, Chen and Lee 38 ).
Self-administered student-version questionnaires were provided to students. Until the 9th grade, data collection was conducted in classrooms by trained interviewers. From the 10th grade onwards, data collection was conducted by the Fieldwork Operation Center of the Health Survey and Health Promotion Administration, Ministry of Health and Welfare, Taiwan. Participants were interviewed individually by trained interviewers. All parents of participants provided signed informed consent. Parental information, including education level, family income and marital status, were obtained from parental-version questionnaires completed by the primary caregiver from the first wave to the fourth wave of the survey. The project was approved by the Human Research Medical Ethics Committee of the National Health Research Institutes (approval code EC9009003).
The present study analyses data from cohort 1 of CABLE. Because questions about unhealthy eating behaviours were first included in 2002, the study includes the students of cohort 1 who were 2nd graders in 2002 (8 years old) and who were followed until the 11th grade in 2011 (17 years old) and had participated in at least two survey waves. Follow-up rates of cohort 1 ranged from 98·09 % in 2002 to 85·14 % in 2011( Reference Luh, Wu and Wu 39 ). Reasons for loss to follow-up included moving, refusing to participate, poor health and loss of contact. Altogether, 2630 students had complete data for the study variables (Fig. 1).
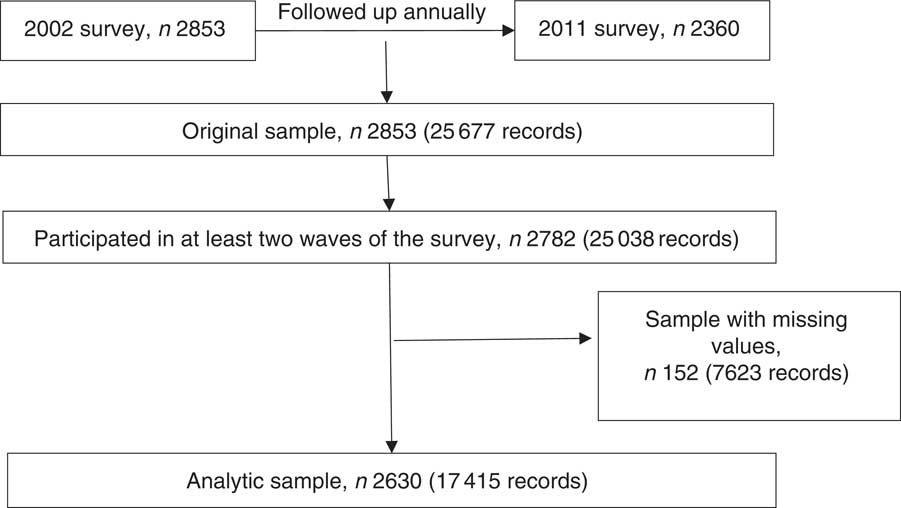
Fig. 1 Flow diagram showing selection of the analytic sample
There were no differences between the analytic sample and the sample with missing data in terms of sex, household monthly income, family activity score, depressive symptoms and unhealthy eating behaviours. However, those with missing data were significantly more likely to have parents who were not married (13·69 % v. 8·39 %) or parents with low education (10·08 % v. 5·54 %; both P<0·05).
Dependent variables
The depressive symptom scale was based on Kovacs’ Children’s Depression Inventory (CDI)( Reference Kovacs 40 , Reference Aluja and Blanch 41 ) and the Center for Epidemiological Studies Depression Scale for Children( Reference Faulstich, Carey and Ruggiero 42 , Reference Shahid, Wilkinson and Marcu 43 ). The scale was reviewed by ten experts in psychology, behavioural science and health education( Reference Yen, Chen and Lee 38 ). The scale contains seven items: (i) loss of appetite; (ii) feeling sad; (iii) crying for no reason; (iv) getting upset over nothing; (v) feeling scared; (vi) difficulty sleeping; and (vii) lack of motivation to do anything in the previous two weeks. Possible responses were never (score=1), once or twice (score=2) or many times (score=3). Scores for each item were summed to provide a depressive symptoms score. Scores ranged from 7 to 21, with a higher score indicating a greater number of depressive symptoms. Cronbach’s α values ranged from 0·66 to 0·81 across the ten waves, indicating an acceptable level of internal consistency. This scale has been used in previous studies( Reference Chang, Wu and Wu 37 , Reference Lue, Wu and Yen 44 , Reference Wu, Kao and Yen 45 ).
Unhealthy eating behaviours were measured with three questions: (i) How often did you eat fast foods (such as hamburgers, French fries, fried chicken, instant noodles and pizza) during the past week? (ii) How often did you eat snacks (such as potato chips, cookies, candy, cakes and chocolate) during the past week? and (iii) How often did you drink sweetened beverages (such as soft drinks, sweetened juice, sweetened tea, ice pop and ice cream) during the past week? A four-point scale was used: never (score=1), once or twice (score=2), many times (score=3) or almost every day (score=4). Scores from each question were added to give a total score for each year that ranged from 3 to 12. Cronbach’s α values ranged from 0·53 to 0·65 across the ten waves. The Spearman correlation coefficients for these three questions showed a significant (P<0·0001) positive association across the ten waves. Factor analysis showed that these three items loaded onto a single factor in each survey year with a cumulative explained variance of 52–59 %.
Potential confounding variables
Potential confounding variables were included as either time-fixed variables or time-varying variables. The conceptual framework is illustrated in Fig. 2. All time-fixed variables (i.e. sex( Reference Parker and Brotchie 46 , Reference Ogden, Kit and Carroll 47 ), parental education level( Reference Patrick and Nicklas 48 , Reference Zarnowiecki, Ball and Parletta 49 ) and monthly household income( Reference Zarnowiecki, Ball and Parletta 49 , Reference Santiago, Wadsworth and Stump 50 )) were based on data collected in 2002. As the nature of these variables was relatively stable, missing values were imputed from available information in the successive year. Parents’ highest education level and monthly household income were obtained from the parent-version questionnaires. Parents’ highest education level (i.e. the highest level of education between the father and mother) was categorized as: (i) low (junior high school or lower); (ii) medium (senior high school or vocational school); or (iii) high (university or above). Monthly household income was divided into the following categories: (i) low (less than 59 999 new Taiwan dollars (NTD; 1 NTD ≈0·03 $US)); (ii) medium (60 000–119 999 NTD); or (iii) high (more than 120 000 NTD).
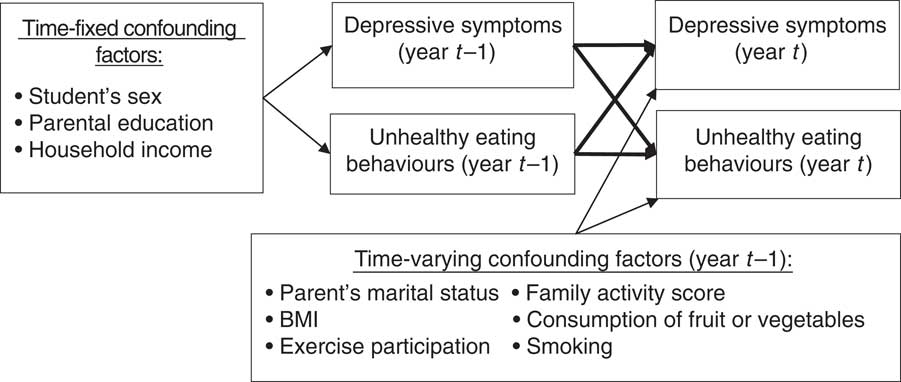
Fig. 2 Conceptual framework (year t=2003–2011)
Time-varying variables included parents’ marital status( Reference Clavarino, Hayatbakhsh and Williams 51 , Reference Mauskopf, O’Leary and Banihashemi 52 ), family activity score( Reference Moreno, Rodriguez and Fleta 5 , Reference Wu, Kao and Yen 45 ), body weight( Reference Berk and Jacka 53 , Reference Braet, Claus and Goossens 54 ), consumption of fruit or vegetables( Reference Jacka, Kremer and Leslie 11 , Reference Bontrager Yoder and Schoeller 55 ), exercise participation( Reference Berk and Jacka 53 , Reference Hopkins, Blundell and King 56 ) and smoking( Reference Berk and Jacka 53 , Reference Radtke, Scholz and Keller 57 ). Parents’ marital status was categorized as married or not married (i.e. separated, widowed or divorced). This variable was obtained from the parent-version questionnaire from 2002 to 2004 and from the student-version questionnaire from 2005 to 2010. Family activity, an aspect of the CABLE Family Interactions Scale( Reference Wu, Kao and Yen 45 ), includes activities that children did with their parents in the previous week. These include talking, eating, doing housework, doing homework and going out somewhere. Responses ranged from 1 to 4 (1=never, 2=one or two days, 3=many days, 4=every day). The sum of these five activities (5 to 20) was used. The Cronbach’s α for this scale was 0·63 in 2002.
Body weight, fruit or vegetable consumption, exercise participation and smoking were included as time-varying variables from 2002 to 2010. Body weight and height were measured between 2002 and 2006. However, from the 7th grade (2007) to the 11th grade (2011), body weight and height were provided by student self-report. We included an indicator variable in the models to control for this difference in measurement approach. There were two years of overlap of these measurement techniques where both approaches were used. This allowed us to evaluate the agreement between the self-reported and measured values. The correlation coefficients were 0·85 for year 2002 and 0·84 for year 2006, indicating good agreement. BMI was calculated as [weight (kg)]/[height (m)]2. Participants were grouped into four categories (underweight, normal, overweight and obese) according to the age- and sex- specific BMI criteria published by the Ministry of Health and Welfare, Taiwan( Reference Chen and Chang 58 ). Fruit or vegetable consumption was defined as eating at least some fruit or vegetables more than three days per week. Participating in exercise was defined as exercising more than three days per week in addition to attending physical education classes. Smoking was defined as any smoking (including one puff) during the past month.
Statistical analysis
Descriptive statistics for categorical variables are given as numbers and percentages. Continuous variables are given as means and standard deviations. The statistical software package SAS version 9·2 was used to generate descriptive statistics.
Hierarchical linear growth modelling in MLwiN 2·27 was used to investigate reciprocal causation between the two variables( Reference Goldstein 59 , Reference Rasbash, Steele and Browne 60 ). The units of the study sample lay at two hierarchical levels: time and individuals. The statistical model was as follows:
 $$\eqalignno{ & Y_{{ij}} {\,\equals\,}\beta _{{0ij}} {\plus}\beta _{{1j}} {\times}Time_{{ij}} \; \cr \beta _{{0ij}} {\,\equals\,}\beta _{0} {\plus}u_{{0j}} {\plus}e_{{0ij}} \cr & \beta _{{1j}} {\,\equals\,}\beta _{1} {\plus}u_{{1j}} \cr \left[ {\matrix{ {u_{{0j}} } \cr {u_{{1j}} } \cr } } \right]\,\sim\,N\left( {0,\Omega _{u} } \right)\,\colon\,\Omega _{u} \left[ {\matrix{ {\sigma _{{u0}}^{2} } & {} \cr {\sigma _{{u01}} } & {\sigma _{{u1}}^{2} } \cr } } \right] \cr & \left[ {e_{{0ij}} } \right]\,\sim\,N\left( {0,\Omega _{e} } \right)\,\colon\,\Omega _{e} \left[ {\sigma _{{e0}}^{2} } \right] $$
where i denotes a time point, j denotes an individual, Y
ij
denotes the level of the variables of individual j at time i, β
0 is the mean score at i=0, and β
1 is the slope of the growth rate. Random effects are represented by u
0j
, u
1j
and e
ij
, and fixed effects by β
0 and β
1. The intercepts have variances $\sigma _{{u0}}^{2} {\,\equals\,}{\mathop{\rm var}} \left( {u_{{0j}} } \right),$
the slopes have variances
$\sigma _{{u0}}^{2} {\,\equals\,}{\mathop{\rm var}} \left( {u_{{0j}} } \right),$
the slopes have variances $\sigma _{{u1}}^{2} {\,\equals\,}{\mathop{\rm var}} \left( {u_{{1j}} } \right)$
and the intercept–slope covariance is
$\sigma _{{u1}}^{2} {\,\equals\,}{\mathop{\rm var}} \left( {u_{{1j}} } \right)$
and the intercept–slope covariance is $\sigma _{{u01}} {\,\equals\,}{\mathop{\rm cov}} \left( {u_{{0j}} ,u_{{1j}} } \right).$
The variation within individuals is represented by e
ij
and has a variance of σ
2.
$\sigma _{{u01}} {\,\equals\,}{\mathop{\rm cov}} \left( {u_{{0j}} ,u_{{1j}} } \right).$
The variation within individuals is represented by e
ij
and has a variance of σ
2.
The time-varying variables and the baseline variables were added to the models:
 $$\eqalignno{ & Y_{{ij}} {\,\equals\,}\beta _{{0ij}} {\plus}\beta _{{1j}} {\times}Time_{{ij}} {\plus}\mathop{\sum}\limits_{k{\,\equals\,}1}^l {\alpha _{k} Z_{{k(i{\minus}1)j}} {\plus}\mathop{\sum}\limits_{m{\,\equals\,}1}^n {\gamma _{m} W_{{mj}} } } \cr & \beta _{{0ij}} {\,\equals\,}\beta _{0} {\plus}u_{{0j}} {\plus}e_{{0ij}} \; \cr \beta _{{1j}} {\,\equals\,}\beta _{1} {\plus}u_{{1j}} \cr \left[ {\matrix{ {u_{{0j}} } \cr {u_{{1j}} } \cr } } \right]\,\sim\,N\left( {0,\Omega _{u} } \right)\,\colon\,\Omega _{u} \left[ {\matrix{ {\sigma _{{u0}}^{2} } & {} \cr {\sigma _{{u01}} } & {\sigma _{{u1}}^{2} } \cr } } \right] \cr \left[ {e_{{0ij}} } \right]\,\sim\,N\left( {0,\Omega _{e} } \right)\,\colon\,\Omega _{e} \left[ {\sigma _{{e0}}^{2} } \right] $$
where
 $$Z_{{k(i{\minus}1)j}} $$
denotes a time-varying independent variable,
$$Z_{{k(i{\minus}1)j}} $$
denotes a time-varying independent variable, $i{\minus}1$
denotes a time-lag effect, α
k
is the coefficient, W
mj
denotes a time-fixed variable and γ
m
is the coefficient. Likelihood ratio tests were used to compare models. Independent variable values from the previous year were used to predict the dependent variable in the subsequent year. Therefore, time=0 for the dependent variable is 2003. Continuous variables included in models were centred at the group mean. Therefore, the initial state in the present study refers to the mean value obtained when continuous variables are centred using the group mean, categorical variables are set at 0 (the referent group) and the year is set at 2003.
$i{\minus}1$
denotes a time-lag effect, α
k
is the coefficient, W
mj
denotes a time-fixed variable and γ
m
is the coefficient. Likelihood ratio tests were used to compare models. Independent variable values from the previous year were used to predict the dependent variable in the subsequent year. Therefore, time=0 for the dependent variable is 2003. Continuous variables included in models were centred at the group mean. Therefore, the initial state in the present study refers to the mean value obtained when continuous variables are centred using the group mean, categorical variables are set at 0 (the referent group) and the year is set at 2003.
Results
The distribution of time-fixed variables is shown in Table 1. There were equal numbers of boys and girls in the study. A medium level of education in parents was the most common. About 40 % of families had a medium level of household monthly income and 35% had a low level.
Table 1 Distribution of time-fixed variables in 2002 (n 2259). Child and Adolescent Behaviors in Long-Term Evolution (CABLE) study
The distribution of time-varying variables is shown in Table 2 and Fig. 3. The mean depressive symptoms score increased over time, as did the mean unhealthy diet score. The family activities score increased annually until the 5th grade, after which it gradually declined. Over 90% of parents were married to each other. About 20% of participants were underweight. The proportion of participants who were overweight was highest in grade 6 and obesity was highest in grade 7. The proportion of participants who ate fruit or vegetables was highest in 2007 (7th grade) and then decreased. The trend for the proportion of participants who exercised demonstrated an inverted U-shaped curve, with a peak in 2007 (7th grade). The proportion of smokers increased over time.
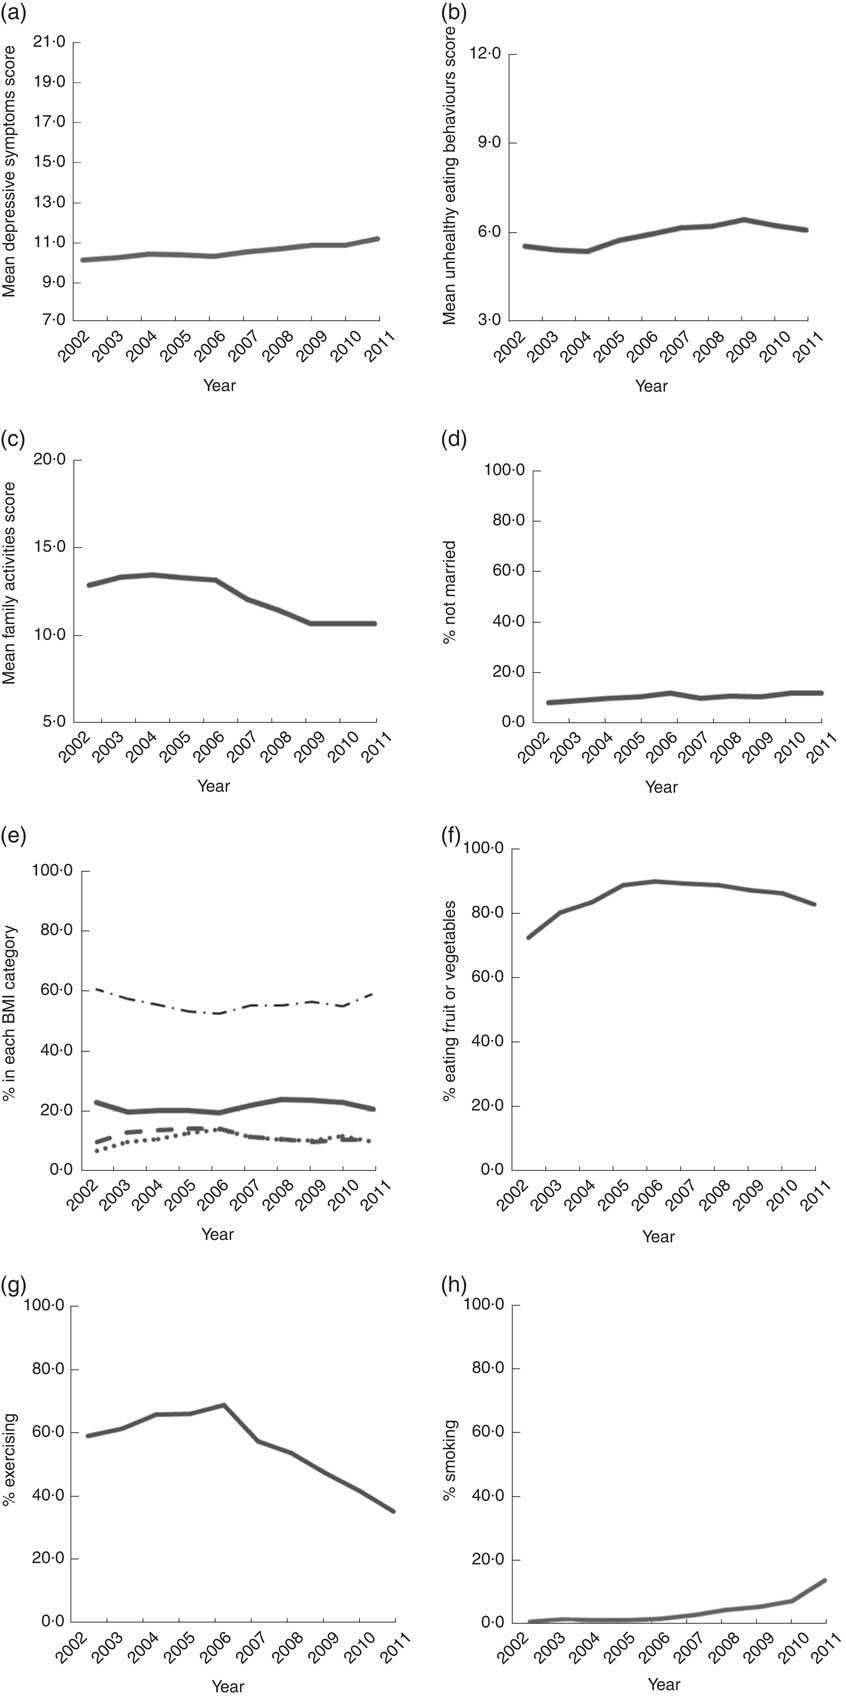
Fig. 3 Trends of time-varying variables, 2002–2011: (a) mean scores of depressive symptoms (score range=7–21); (b) mean scores of unhealthy eating behaviours (score range=3–12); (c) mean scores of family activities (score range=5–20); (d) percentage not married; (e) percentage in each BMI category (———, underweight; – – – – –, overweight; · · · · ·, obese; – · – · –, normal); (f) percentage eating fruit or vegetables; (g) percentage exercising; (h) percentage smoking. Child and Adolescent Behaviors in Long-Term Evolution (CABLE) study
Table 2 Distribution of dependent variables and time-varying covariates. Child and Adolescent Behaviors in Long-Term Evolution (CABLE) study
Score range of depressive symptoms: 7–21. Score range of unhealthy eating: 3–12.
The results of growth curve models are shown in Table 3. In models a1 to a3, depressive symptoms score was the dependent variable; in models b1 to b3, unhealthy eating behaviour was the dependent variable. We carried out modelling in three stages. First, we used model a1 to demonstrate the trajectory of depressive symptoms, including the initial state and growth rate, during a given year (t
i
). Second, we added the frequency of unhealthy eating behaviour in the previous year ( $t_{{i{\minus}1}} $
) and the difference in frequency between the given year and the previous year (
$t_{{i{\minus}1}} $
) and the difference in frequency between the given year and the previous year ( $t_{i} {\minus}t_{{i{\minus}1}} $
) to examine the relationship between unhealthy eating and depressive symptoms (model a2). Third, baseline variables and time-varying variables were added (model a3). Models b1 to b3 were conducted in the same way, except that the dependent variable was unhealthy eating.
$t_{i} {\minus}t_{{i{\minus}1}} $
) to examine the relationship between unhealthy eating and depressive symptoms (model a2). Third, baseline variables and time-varying variables were added (model a3). Models b1 to b3 were conducted in the same way, except that the dependent variable was unhealthy eating.
Table 3 Sequential models for depressive symptoms and unhealthy eating behaviors among 2630 Taiwanese students followed from the 2nd grade (8 years old in 2002) to the 11th grade (17 415 records). Child and Adolescent Behaviors in Long-Term Evolution (CABLE) study
B, estimated parameter.
Significant estimates (P<0·05) are indicated in bold font.
The initial score of depressive symptoms in the sample was 10·250 with a variance of 0·048, and the growth rate was 0·102 per year with a variance of 0·009 (Table 3, model a1). Model a2 demonstrated that unhealthy eating in the previous year (B=0·192, se=0·019) and the change in unhealthy eating between these two years (B=0·141, se=0·013) were positively associated with depressive symptoms in the given year. Model a3 showed that the associations between unhealthy eating in the previous year and depressive symptoms remained significant (B=0·190, se=0·019) after controlling for covariates. Girls had a higher level of depressive symptoms than boys. Participants who had higher scores for family activities (B=–0·019, se=0·007), ate more fruit or vegetables (B=−0·199, se=0·056) and exercised (B=−0·221, se=0·040) more in the previous year were less likely to have depressive symptoms in the given year.
Model b1 showed that unhealthy eating behaviours increased with time. The growth rate was 0·123 with a variance of 0·005. Model b2 showed that depressive symptoms in the previous year (B=0·066, se=0·007) and the change in depressive symptoms between the two years (B=0·053, se=0·005) were positively related to unhealthy eating behaviours in the subsequent year. Model b3 showed that the association between depressive symptoms (B=0·065, se=0·007) in the previous year and unhealthy eating behaviours remained after controlling for other factors. Boys were more likely to have unhealthy eating behaviours than girls (B=–0·199, se=0·041). Participants who were underweight (B=0·122, se=0·035) in the previous year ate more unhealthily in the subsequent year.
Discussion
The present study utilized a cohort to examine the reciprocal relationship between unhealthy eating behaviour and depressive symptoms. After controlling for confounders, we found that depressive symptoms significantly increased unhealthy eating behaviours and unhealthy eating behaviours significantly increased depressive symptoms, demonstrating a longitudinal reciprocal relationship. This is the first study trying to establish the relationship.
Both depressive symptoms and unhealthy eating behaviours increased slightly from childhood to adolescence. The finding that depressive symptoms increased slightly over time is in agreement with the results of a previous prospective longitudinal study( Reference Popkin and Gordon-Larsen 61 ), in which the CDI was used to measure depressive symptoms in children in grade 4 to grade 11 and a small mean annual score increase of 0·031 was observed. This increase over time could be because adolescence is a period in which many new life challenges are confronted, resulting in more conflict and pressure compared with childhood, and leading to psychological problems such as depressive symptoms( Reference Rutter, Graham and Chadwick 62 ).
The increase in unhealthy eating habits over time is also in agreement with previous research. A recent review( Reference Moreno, Rodriguez and Fleta 5 ) reported increased consumption of snacks (including high-salt snacks), sweetened beverages and takeaway foods by children and adolescents in the USA and Europe. This increase in unhealthy food consumption could be related to a nutritional transition influenced by urbanization, economic development and changes in food technology and culture( Reference Popkin and Gordon-Larsen 63 ). The unhealthy eating behaviours measured in our study showed only a slight increase over time, suggesting that these behaviours do not change greatly from childhood to adolescence. This agrees with findings from Kelder et al. in a 7-year longitudinal study of 6th graders that reported early consolidation of food preferences( Reference Kelder, Perry and Klepp 64 ).
Our finding that unhealthy eating behaviours can lead to depressive symptoms from childhood to adolescence is in agreement with previous research in adults( Reference Jacka, Mykletun and Berk 12 , Reference Jacka, Pasco and Mykletun 13 ) and adolescents( Reference Jacka, Kremer and Leslie 11 , Reference Weng, Hao and Qian 17 , Reference Hoare, Millar and Fuller-Tyszkiewicz 18 ). We also found a time-lag effect in the impact of diet on depressive symptoms in that eating habits in the previous year predicted depressive symptoms in the subsequent year. This finding supports that reported by Akbaraly et al. ( Reference Akbaraly, Sabia and Shipley 9 ) and Jacka et al.( Reference Jacka, Cherbuin and Anstey 10 ). Balanced nutritional intake is an important factor in the synthesis of mood-related neurotransmitters. Consumption of junk food, which is energy dense but lacks micronutrients, may result in excess intake of sugar, salt or fat and may cause reduced synthesis of neurotransmitters( Reference Wallin and Rissanen 19 ).
We also found that depressive symptoms influence unhealthy eating behaviours during childhood and adolescence. This could be because of the self-regulatory attempt to relieve depressive symptoms by eating comfort foods, which are usually high in fat and carbohydrates( Reference Dubé, LeBel and Lu 31 , Reference Canetti, Bachar and Berry 32 ). Our findings support past research showing that children can also display emotional eating behaviour when confronting stress and are more likely to choose high-sugar and high-fat foods( Reference Michels, Sioen and Braet 36 ). Although children are not in control of the family finances they can still influence their parents’ food purchases( Reference Wilson and Wood 65 ), which is why food manufacturers target children in their advertising( Reference Cairns, Angus and Hastings 66 ). This also means that when children are facing depressive symptoms, it is possible for them to obtain the comfort foods they want to eat regardless of their lack of financial independence.
We found that depressive symptoms in the previous year were predictive of unhealthy eating behaviours in the subsequent year, thus demonstrating a time-lag effect. This finding differs from that of Jacka et al.( Reference Jacka, Cherbuin and Anstey 30 ) who found that prior depression was associated with better-quality diets at a later time point, while current depressive symptoms were associated with poorer dietary habits. The present study differs from that of Jacka et al. in the timing of measurements. In our study depressive symptoms were measured annually and were used to predict eating habits in the subsequent one year. However, in the study by Jacka et al. any history of depression at a non-specified point in the past was used to predict dietary habits throughout the survey period. In addition, in the present study we began measurements during childhood whereas in Jacka et al. the study participants were aged 20 years and over. These points could explain the difference in findings.
Strengths and limitations
An important strength of the present study is the use of longitudinal data with ten years of follow-up. Moreover, follow-up commenced when participants were children, and unhealthy eating habits and depressive symptoms were measured the same way each year. A further strength is the adjustment for many confounders including time-fixed and time-varying variables. The study extends previous investigations by confirming that the association between unhealthy eating behaviours and depressive symptoms remains after adjustment for several confounders and that there are time-lag effects.
However, our study also has several limitations. (i) The CABLE questionnaire measured the frequency of unhealthy diet behaviours with only three questions. Nevertheless, these three questions were sufficient to measure the consumption of high-fat, high-sugar and high-salt foods and this approach has been used previously in other studies( Reference Akbaraly, Sabia and Shipley 9 , Reference Wurtman and Wurtman 20 ). (ii) Some potential confounders were not adjusted for such as stress, which is associated with both depression and unhealthy diet. Previous research has shown that high-pressure situations are associated with greater intake of unhealthy foods (high-energy or high-fat foods)( Reference Zellner, Loaiza and Gonzalez 67 ) and a greater likelihood of developing depression and experiencing negative emotions( Reference Santiago, Wadsworth and Stump 50 ). Therefore, it is possible that there are residual confounding effects( Reference Jacka, Cherbuin and Anstey 10 ) and we recommend that future research adjusts for such variables. (iii) We found that children with parents who were not married or had low education were more likely to be lost to follow-up and this should be taken into consideration when interpreting the study results. As having parents who are not married or have low education increases the risk of an unhealthy diet or depressive symptoms, it is possible that our study has underestimated the association between unhealthy eating and depressive symptoms. (iv) Finally, as the study was a longitudinal one some data sources changed during follow-up. The two main changes were: the source of parents’ marital status changed from the parent-version to the student-version questionnaire; and the source of height and weight changed from the physical examination to be self-reported in the student-version questionnaire. Although statistical methods were used to control for these changes, it is still possible that this change in data source resulted in bias.
Conclusion
We confirmed that there is a reciprocal relationship between depressive symptoms and unhealthy diet using a set of longitudinal data. The study’s findings are of use in the design of healthy diet and psychological health interventions for children and adolescents. We recommend that future interventions be aimed at both healthy eating habits and depression. Such programmes could emphasize daily eating habits and the impact of diet on emotions particularly during depression, where it is important not to use high-fat, high-salt and high-sugar foods to manage emotions. We also recommend that when designing future school health strategies, children are encouraged to record both their eating habits and emotions to help them understand the relationship between dietary behaviour and emotions. Future longitudinal research should use more detailed dietary measurement approaches such as dietary recall that are consistently used throughout follow-up to explore in more detail the relationship between eating habits and depressive symptoms.
Acknowledgements
Financial support: Part of this work was financially supported by the National Health Research Institutes (grant numbers HP-090-SG-03, HP-091-SG-02, HP-092-PP-07, HP-093-PP-03, HP-094-PP-12, HD-095-PP-03, HD-096-PP-03, HD-097-PP-03, HD-098-PP-03, PH-099-PP-15 and PH-100-PP-15), Ministry of Health and Welfare, and the Ministry of Science and Technology (grant number MOST-103-2314-B-400-003-MY3). Conflict of interest: None. Authorship: W.-C.W., D.-L.L. and H.-Y.C. designed the research, had full access to all the data in the study and take primary responsibility for the integrity of the data, accuracy of the analysis and final content. W.-C.W. performed the statistical analysis and wrote the first draft of the manuscript. D.-L.L. supervised the study and revised the first draft. H.-Y.C. supervised the conceptualization and statistical analysis and revised the second draft. C.-I.L. provided valuable comments about nutrition knowledge. C.-C.W. and B.-S.H. coordinated and supervised the fieldwork. S.W. provided consultation on neurological aspects of unhealthy diet and depression. Y.-C.C., C.-C.H. and Y.-H.C. participated in intensive discussion of the manuscript. L.-L.Y acted as the guarantor of the paper and vouches for its validity. Ethics of human subject participation: The project was approved by the Human Research Medical Ethics Committee of the National Health Research Institutes (approval code EC9009003).


