


Introduction
Knowledge of a species’ habitat can help to understand its ecology and guide management and conservation efforts. Gaps in our understanding of population biology and habitats of birds of prey hinder accurate designation of conservation status as well as formulation and implementation of successful conservation strategies. Evidence-based methods, which take into account biological factors, species’ distribution, and population density (Naveda-Rodriguez, Reference Naveda-Rodriguez2013, Reference Naveda-Rodríguez2015), are required and predictive models, such as species distribution models (SDMs), have become an essential tool for researchers in predicting and assessing the distribution of species by quantifying species-environment relationships (Loiselle et al. Reference Loiselle, Howell, Graham, Goerck, Brooks, Smith and Williams2003, Guisan and Thuiller Reference Guisan and Thuiller2005, Elith and Leathwick Reference Elith and Leathwick2009, Franklin Reference Franklin2010, Morán-Ordóñez et al. Reference Morán-Ordóñez, Lahoz-Monfort, Elith and Wintle2017, Flessner et al. Reference Flessner, Henry and Green2017, Ramesh et al. Reference Ramesh, Gopalakrishna, Barve and Melnick2017). SDMs may be used to identify areas with high conservation value, demarcate future protected areas, initiate conservation measures, and forecast how climate change will affect species’ distribution (Stralberg et al. Reference Stralberg, Jongsomjit, Howell, Snyder, Alexander, Wiens and Root2009, Austin and Van Niel Reference Austin and Van Niel2011, Virkkala et al. Reference Virkkala, Heikkinen, Fronzek and Leikola2013, Rempel and Hornseth Reference Rempel and Hornseth2017). They have been used to show that the combined effects of global environmental change (e.g. through changes in land use) are likely to cause unparalleled rates of environmental change and biodiversity loss (Parmesan Reference Parmesan2006, Riordan and Rundel Reference Riordan and Rundel2014). Much attention has been paid to threats such as direct habitat loss, and range shifts due to climate change in the 21st century (Thuiller et al. Reference Thuiller, Lavorel, Araújo, Sykes and Prentice2005), but habitat conversion and degradation, resulting from overexploitation and agricultural activities, constitute potentially more imminent threat to species persistence (Sala et al. Reference Sala, Chapin, Armesto, Berlow, Bloomfield, Dirzo and Leemans2000, Maxwell et al. Reference Maxwell, Fuller, Brooks and Watson2016). Minimising harm to ecosystems from present activities will help face challenges posed by climate change in the future (Maxwell et al. Reference Maxwell, Fuller, Brooks and Watson2016).
There is also a long history of using SDMs to assess the effectiveness of protected areas (Farashi and Shariati Reference Farashi and Shariati2017) by applying gap analyses, based on species distribution. Historically, protected areas have been designated in areas with low economic value at the expense of regions with ecological and conservation importance which may be insufficiently protected (Rodrigues et al. Reference Rodrigues, Andelman, Bakarr, Boitani, Brooks, Cowling and Long2004). Venter et al. (Reference Venter, Magrach, Outram, Klein, Possingham, Di Marco and Watson2018) showed that neither existing nor new protected areas cover locations with high concentrations of threatened vertebrate species.
The Egyptian Vulture Neophron percnopterus has been listed on the IUCN Red List as ‘Endangered’ since 2007 (IUCN 2017). Multiple factors have contributed to population declines of the species (Nikolaus Reference Nikolaus1984, Reference Nikolaus2006, Cuthbert et al. Reference Cuthbert, Green, Ranade, Saravanan, Pain, Prakash and Cunningham2006, Ogada et al. Reference Ogada, Shaw, Beyers, Buij, Murn, Thiollay and Krüger2016) including electrocution by power lines (Nikolaus Reference Nikolaus1984, Reference Nikolaus2006, Angelov et al. Reference Angelov, Hashim and Oppel2013), wind farms (Ferrer and Penteriani Reference Ferrer and Penteriani2008, Penteriani et al. Reference Penteriani, Ferrer and Delgado2011), direct persecution and changes in food availability (Velevski et al. Reference Velevski, Nikolov, Hallmann, Dobrev, Sidiropoulos, Saravia and Stara2015), and poisoning by drugs (e.g. diclofenac) and lead (from gun-shot) (Thiollay Reference Thiollay2006a,Reference Thiollayb, Hernández and Margalida, Reference Hernández and Margalida2009). Poisoning of wild predators by hunters and livestock farmers that inadvertently kills vultures is one of the leading causes of population decline (Ogada et al. Reference Ogada, Shaw, Beyers, Buij, Murn, Thiollay and Krüger2016). Because the relative importance of threats to the survival of Egyptian Vultures is poorly understood, there is a critical need for research into causes of mortality and potential conservation actions that may halt and reverse population declines. Although the species has a wide range, from the Mediterranean to India, as well as parts of eastern and southern Africa, global estimates of its current population are between 12,000 and 38,000 mature individuals. Egyptian Vulture is also recognized as an endangered species in Iran. The most important factors threatening the species in Iran include loss of habitat due to changes in land cover and land use, and illegal trade and hunting. Current knowledge about this species remains extremely poor. Egyptian Vulture occurs in different regions of Iran as a resident, summer visitor, and winter visitor (Kaboli et al. Reference Kaboli, Aliabadian, Tohidifar, Hashemi and Roselaar2015). Summer visitors are scattered in the north and west of Iran, while residents and winter visitors are scattered in coastal areas of the south.
The aims of this study were: (1) to identify factors affecting the distribution of the Egyptian Vulture during summer and winter in Iran, (2) to identify suitable habitats of the Egyptian Vulture during summer and winter in Iran, and (3) to evaluate whether the current protection network is sufficient to cover the suitable habitats of the Egyptian Vulture during summer and winter in Iran.
Materials and methods
Study area
Iran is located in the Middle East (24°–40°N, 44°–64°E), serving as a bridge between the Indian subcontinent, the Arabian Peninsula, Central Asia, and Europe. Because of high habitat diversity Iran is one of the most important countries in the Middle East for biodiversity conservation. Water scarcity, land degradation and pollution are the three main threats to biodiversity in Iran (Iranian Department of Environment 2015).
Species presence data
Egyptian Vultures inhabit different regions of the country as (1) residents that breed and remain in a specific area all year round, (2) summer visitors that arrive in spring, remain throughout the breeding season, and leave the country in autumn and (3) winter visitors that arrive in autumn, remain throughout the winter, and leave the country in spring. Data on the historical distribution of the summer and winter visitors in Iran were obtained from atlas distribution maps (Kaboli et al. Reference Kaboli, Aliabadian, Tohidifar, Hashemi and Roselaar2015). These maps show the distribution of each species in a point-based format and are the product of data recorded in the last 50 years. New information reported by Iranian and foreign ornithologists was added later. Species distribution data were obtained from observations and signs (e.g. nests, camera traps).
To create maps for this study, the map of Iran was converted into a 1×1 km grid and all reliable information on the species’ presence was transferred to the cells. The records of summer and winter visitors were screened in ArcGIS 10.3 (ESRI 2014). Presence locations of residents, summer visitors and winter visitors covered 6, 136, and 14 cells respectively. Significant spatial autocorrelation of residuals was identified using Moran’s correlograms (‘I’ predicted HSI for the species record; De Marco et al. Reference De Marco, Diniz-Filho and Bini2008) and by Spatial Analysis in Macroecology (SAM; Rangel et al. Reference Rangel, Diniz‐Filho and Bini2006). To determine the significance of Moran’s I, a randomisation test with 9,999 Monte Carlo permutations was used, corrected for multiple testing. In cases of significant spatial autocorrelation, we constrained testing and training data: the first distance lags showing positive spatial autocorrelation were used to establish a distance threshold, and data pairs closer to each other than the threshold were placed in the same data partition (Parolo et al. Reference Parolo, Rossi and Ferrarini2008).
Environmental predictors
The following six eco-geographical variables were selected for the two distribution models according to the species’ time of presence in the area: vegetation, bioclimatic, topographic, and food availability; land cover, and human footprint index (Table 1). Land cover predictors were derived from 30-m Landsat Enhanced Thematic Mapper Plus (ETM+) imagery. Land cover data were obtained from the Iranian Forests, Range and Watershed Management Organization (IFRWO) and Iranian Department of Environment in 2014 (Table 1). Using neighbourhood analysis, the ratio of different land cover types in a 1-km radius from the centre of each cell was calculated. Normalized Difference Vegetation Index (NDVI, calculated as the average of seasonal values in the 2000–2016 period) was compiled based on Moderate Resolution Imaging Spectrometer at 1-km resolution (MODIS, available on: https://lpdaac.usgs.gov). Nineteen bioclimatic predictors were collected from the WorldClim 1.4 database (Hijmans et al. Reference Hijmans, Cameron, Parra, Jones and Jarvis2005) (Table 1) at 1-km resolution and aggregated for October-March for winter and April-August for summer. The four most important topographic factors (mean and standard deviation of elevation, and slope of all raster cells included in a 1-km radius) were calculated based on the Shuttle Radar Topography Mission (SRTM) elevation model (http://srtm.csi.cgiar.org), to describe physiographic properties. To evaluate human impact on the Egyptian Vulture, we calculated the human footprint index using data on settlements, land transformation, accessibility and infrastructure (Sanderson et al. Reference Sanderson, Jaiteh, Levy, Redford, Wannebo and Woolmer2002). Access to food sources is among the primary parameters determining the species’ distribution (Arrondo et al. 2018). This parameter was modelled based on livestock density in rural areas, using data provided by the Iranian Forests, Range and Watershed Management Organization (IFRWO), Iranian Department of Environment, and Statistical Centre of Iran. Correlated predictor pairs (r > 0.7) were excluded through correlation tests for all pairwise combinations of environmental variables for winter and summer visitors (Table 1).
Table 1. Environmental predictors and their relative contributions to MaxEnt model.
The highest values are in bold.
Species distribution model
Using MaxEnt, an SDM for the Egyptian Vulture was developed (Phillips et al. Reference Phillips, Anderson and Schapire2006). MaxEnt is a machine learning statistical tool that matches or exceeds other modelling techniques in terms of performance (e.g. Phillips and Dudik Reference Phillips and Dudík2008, Phillips et al. Reference Phillips, Dudík, Elith, Graham, Lehmann, Leathwick and Ferrier2009). Previous research indicates MaxEnt’s similar performance to regression-based techniques that analyse species’ environmental correlates (e.g. Renner and Warton Reference Renner and Warton2013, Merow and Silander Reference Merow and Silander2014). MaxEnt can answer a host of ecological questions when models are appropriately calibrated and evaluated (Merow et al. Reference Merow, Smith and Silander2013). We selected MaxEnt to develop predictive models for two reasons: (1) MaxEnt has performed robustly for small sample sizes and has outperformed other methods in such cases (Elith et al. Reference Elith, Graham, Anderson, Dudík, Ferrier, Guisan and Li2006, Franklin Reference Franklin2010, Shcheglovitova and Anderson Reference Shcheglovitova and Anderson2013); (2) owing to their lower sensitivity to over-prediction compared to standard GLM models, MaxEnt models are more useful to predict and extrapolate for conservation applications (Jackson et al. Reference Jackson, Gergel and Martin2015, Zlonis et al. Reference Zlonis, Panci, Bednar, Hamady and Niemi2017).
In total, 156 presence points within Iran (residents = 6, summer visitors = 136 and winter visitors = 14) were used to train the model with default settings (regularization multiplier β = 1; auto features; convergence threshold = 0.00001) using the ‘dismo’ package (Hijmans et al. Reference Hijmans, Phillips, Leathwick, Elith and Hijmans2017) in R (R Core Team 2017). The model was run separately for summer and winter visitors. Presence points for residents and winter visitors were used in modelling the winter visitors. A similar process was used for summer visitors using presence points for the summer visitors and residents. Suitable habitats for the residents were determined by overlapping the suitable habitat of winter and summer visitors. One of the underlying assumptions of MaxEnt models is that occurrence data are representative of the species’ distribution. However, this assumption is often inaccurate. To eliminate sample selection bias, uniform background data can be replaced with a random sample of background data drawn from the sampling distribution (Phillips and Dudík Reference Phillips and Dudík2008, Kramer-Schadt et al. Reference Kramer-Schadt, Niedballa, Pilgrim, Schröder, Lindenborn, Reinfelder and Cheyne2013). Following this procedure, background data on the species were obtained from field data, literature review, and information resulting from interviews with wildlife experts, game wardens, hunters and taxidermists in 382 points for summer visitors and 108 points for winter visitors. Predictor contribution for the best fitting model was gauged via the jackknife procedure and permutation importance. MaxEnt provided a continuous map of habitat suitability. Additionally, the continuous map was converted into a binary presence-absence map by applying the probability threshold corresponding to each model’s maximum Kappa value (Gutierrez et al. 2014). Subsequently, to assess the overlap between suitable habitats and protected areas, binary maps of habitat suitability and protected areas were compared in IDRISI Selva. In our study, 10 bootstrap replicates were run and the following two indices of model performance were used to evaluate the models by randomly assigning the presence records as training and test datasets (80% and 20%, respectively): (1) the area under the ROC-plot curve (AUC; Fielding and Bell Reference Fielding and Bell1997) in which 0 and 1 mean the worst and best prediction respectively, with 0.5 corresponding to a random prediction; and (2) the True Skill Statistics (TSS; Allouche et al. Reference Allouche, Tsoar and Kadmon2006) in which -1 and 1 mean the worst and best prediction respectively, with 0 corresponding to a random prediction. AUC and TSS are commonly used as presence-background evaluators (e.g. Descombes et al. Reference Descombes, Petitpierre, Morard, Berthoud, Guisan and Vittoz2016).
Results
AUC and TSS values indicated the good predictive performance of MaxEnt models for summer visitors (AUC: 0.91 ± 0.001, TSS: 0.89 ± 0.001) and winter visitors (AUC: 0.86 ± 0.001, TSS: 0.80 ± 0.002), with the highest AUC and TSS values for summer visitors.
Summer visitors, winter visitors and residents in this study showed a range of occurrence probabilities (Figures 1-3). Suitable habitats of summer visitors are scattered in the north and west of Iran and mainly concentrated along the Zagros and Alborz mountain ranges (Figure 2) which cover a large area of Iran. Suitable habitats of winter visitors and residents are scattered in coastal areas in the south (Figures 1 and 3).

Figure 1. Habitat suitability of winter visitors of Egyptian Vulture in Iran and gaps between suitable habitats and protected areas.
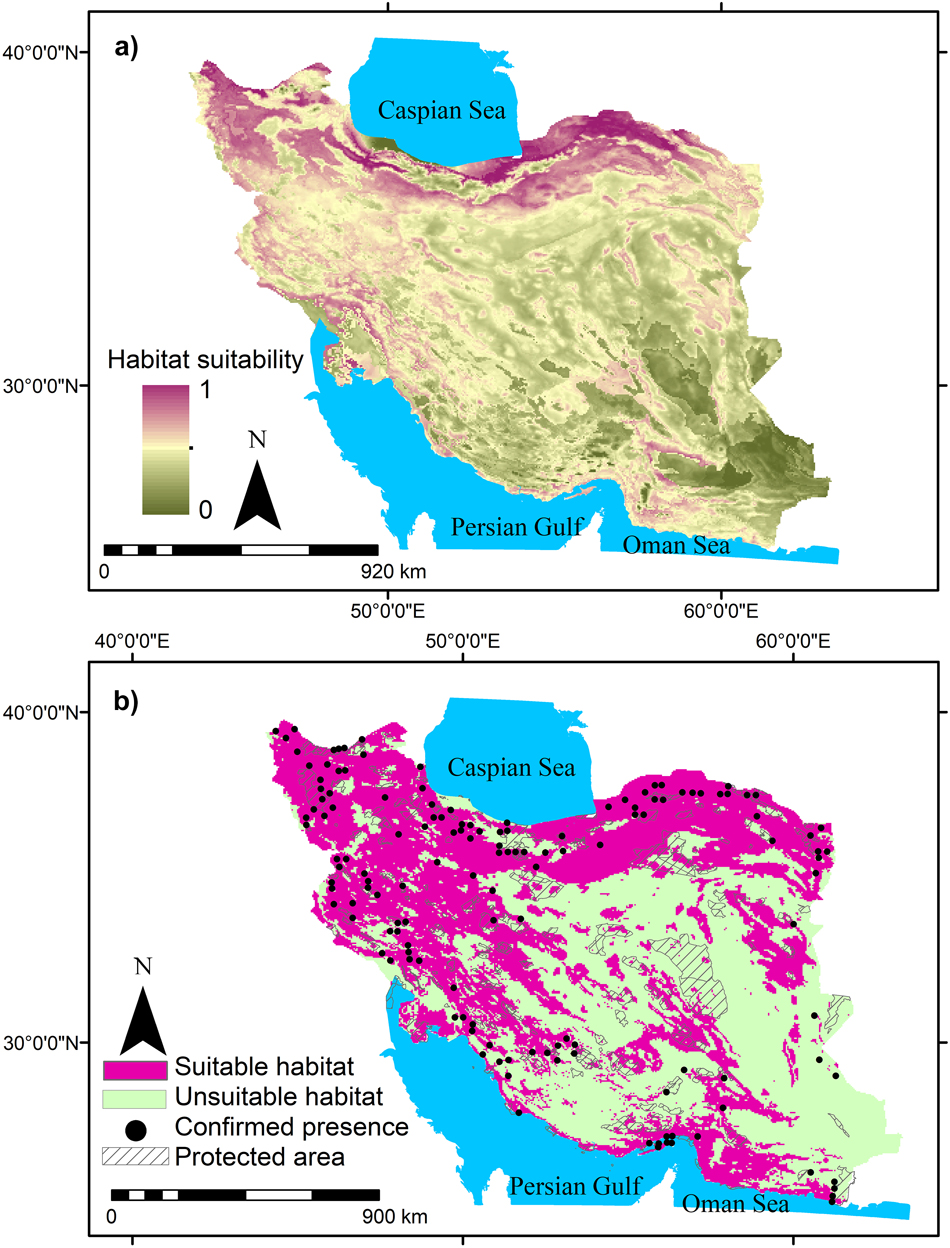
Figure 2. Habitat suitability of summer visitors of Egyptian Vulture in Iran and gaps between suitable habitats and protected areas.
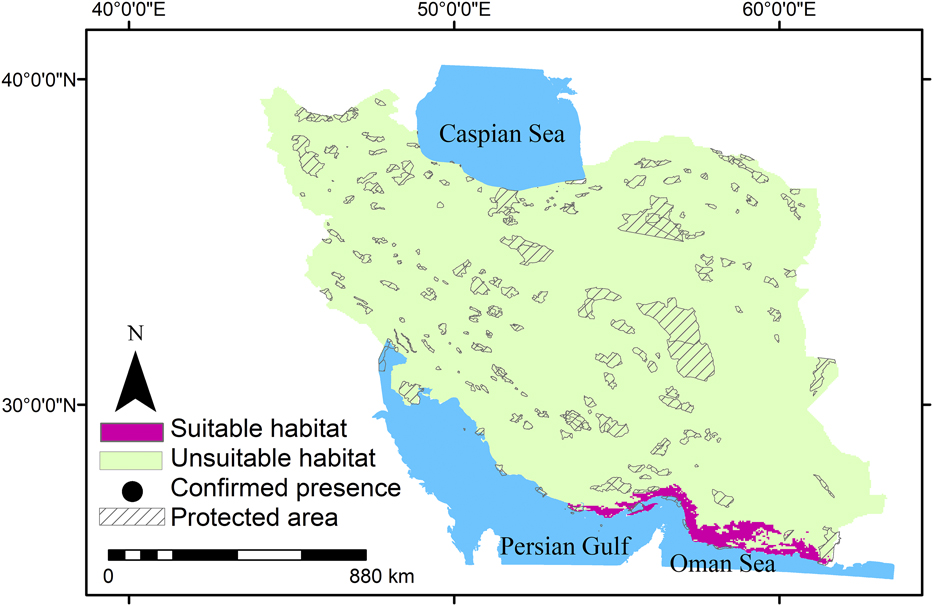
Figure 3. Habitat suitability of residents of Egyptian Vulture in Iran and gaps between suitable habitats and protected areas.
MaxEnt results showed that 2%, 48%, and 3% of Iran can be considered as suitable habitats for residents, summer visitors, and winter visitors, respectively. Furthermore, the suitable habitats for residents, summer visitors, and winter visitors had only 4%, 9%, and 10% overlap with protected areas, respectively. This means that Egyptian Vulture mainly occurs outside protected areas in Iran (Figures 1-3). The results also indicated that large areas in Iran can be considered suitable habitat for summer visitors (Figure 2).
The MaxEnt model calculated the proportional contribution of each environmental variable for the winter and summer distribution and demonstrated various patterns (Table 1). The relative contribution of each variable is demonstrated in Table 1 for winter and summer visitors. Environmental variables that contributed the most to modelling the potential distribution of the Egyptian Vulture during summer and winter were seasonal NDVI, and distance from protected area. In contrast, climatic variables made only small contributions to model development (Table 1). Meanwhile, we found that some model variables have a high contribution to summer or winter visitors only. For example, mean elevation is important to winter visitors and standard deviation of the elevation is important to summer visitors.
Response curves revealed the direction of effect for the most important variables on habitat suitability of the Egyptian Vulture during summer and winter (Figure 4). The results demonstrated that increased seasonal NDVI and increased human footprint index caused a decrease in habitat suitability for Egyptian Vultures in both summer and winter. Also, increased distance from protected areas led to improvements in habitat suitability for winter visitors, while the same factor had the opposite effect for summer visitors. It was also concluded that distribution area of summer visitors was limited to altitudes between 500 and 2800 m, but habitat suitability for winter visitors increased with elevation.

Figure 4. Response curves of Maxent model for Egyptian Vulture.
Discussion
According to the MaxEnt models, environmental variables influencing habitat suitability of the Egyptian Vulture partially change throughout the year. For example, for winter visitors mean elevation was particularly important in explaining habitat suitability while standard deviation of elevation had a more important role for summer visitors, replacing altitude.
Our results revealed that only a small portion of suitable habitats during summer and winter is located in protected areas. In contrast, Mateo-Tomás et al. (Reference Mateo-Tomás, Olea and Fombellida2010) reported that a high percentage (65.7%) of the Egyptian Vultures’ spring and summer territories are located within protected areas in the Cantabrian Mountains of Spain. It seems that protected areas may contain suitable habitats for the Egyptian Vulture (Carrete et al. Reference Carrete, Grande, Tella, Sánchez-Zapata, Donázar, Díaz-Delgado and Romo2007, Reference Carrete, Sánchez-Zapata, Benítez, Lobón and Donázar2009, Zuberogoitia et al. Reference Zuberogoitia, Zabala, Martínez, Martínez and Azkona2008, Mateo-Tomás et al. Reference Mateo-Tomás, Olea and Fombellida2010). There are two possible reasons for the inadequate protection of the species in Iran. Firstly, selection of protected areas is mainly based on the distribution of large mammals, and birds play only a small role. Secondly, birds are very mobile and have broad ecological niches, therefore a significant part of their suitable habitats is located outside protected area.
Our results also showed that increased distance from protected areas led to improvements in habitat suitability for winter visitors, while the same factor had the opposite effect for summer visitors. Zuberogoitia et al. (Reference Zuberogoitia, Zabala, Martínez, González-Oreja and López-López2014) explain that tourist activity in protected areas creates disturbance which leads to lower habitat suitability. In Iran, better security in protected areas (as a result of lower levels of human activity and disturbance and laws banning hunting) explains why summer visitors prefer to spend their breeding season inside protected areas.
As can be seen in our results, summer- and winter-visitor Egyptian Vultures are mainly found in areas with low vegetation cover, similar to findings by Margalida et al. (Reference Margalida, García and Cortés-Avizanda2007), stating that the species is partial to areas with sparse vegetation due to food being more easily obtained in such areas. This result is in agreement with previous studies which have supported the relationship between habitat suitability of the Egyptian Vulture and low vegetation cover (Carrete et al. Reference Carrete, Grande, Tella, Sánchez-Zapata, Donázar, Díaz-Delgado and Romo2007, Margalida et al. Reference Margalida, García and Cortés-Avizanda2007). Despite the fact that this species’ distribution is highly variable in terms of elevation at a global scale (IUCN 2017), Zuberogoita et al. (2014) and Sen et al. (Reference Sen, Tavares and Bilgin2017) said that elevation was one of the most important habitat variables for breeding populations of the Egyptian Vulture. Oppel et al. (Reference Oppel, Dobrev, Arkumarev, Saravia, Bounas, Manolopoulos and Nikolov2017) identified standard deviation of elevation as one of the most decisive environmental parameters influencing territory occupancy and breeding success of Egyptian Vultures in the Balkan Peninsula. We found that mean elevation makes a high contribution only for winter visitors. Egyptian Vultures during summer and winter react differently to mean elevation. Winter visitors show a positive trend with an increase in elevation; while summer visitors show a preference for middle elevations (500–2800 m). Mateo-Tomás and Olea (Reference Mateo-Tomás and Olea2009) account for the general negative trend between elevation and habitat suitability in terms of the extreme climatic conditions at high altitudes.
In step with the growing human disturbance, the spatial and temporal distribution, foraging behaviour and breeding success of wildlife has been changing (Fernández-Juricic and Tellería, Reference Fernández-Juricic and Tellería2000, Gill et al. Reference Gill, Norris and Sutherland2001, Liberatori and Penteriani Reference Liberatori and Penteriani2001, Bautista et al. Reference Bautista, García, Calmaestra, Palacín, Martín, Morales and Viñuela2004). Our findings linked human activity with habitat suitability for summer and winter visitors in Iran, in agreement with previous studies on the Egyptian Vulture (Zuberogoitia et al. Reference Zuberogoitia, Zabala, Martínez, Martínez and Azkona2008) as well as other species such as Bearded Vulture Gypaetus barbatus and Spanish Imperial Eagle Aquila adalberti (Arroyo and Razin Reference Arroyo and Razin2006, González et al. Reference González, Arroyo, Margalida, Sánchez and Oria2006). However, some authors suggest that the Egyptian Vulture is tolerant of human activities (Ceballos and Donázar Reference Ceballos and Donázar1989). Our study showed a negative correlation between human disturbance (e.g. human settlements and land transformation) and habitat suitability for the Egyptian Vulture, i.e. areas far from infrastructure were the most suitable for the species. This observation can be explained by better security in such areas. Hunting and trafficking of birds of prey to other Middle Eastern countries are among the major threats to birds of prey in Iran. Despite the relative security of protected areas, since the majority of suitable Egyptian Vulture habitat is located outside protected areas; further human development can restrict its suitable habitats and drive the species to extinction in the near future.
Current biodiversity policy in the world is focused on halting the loss of biodiversity (IUCN 2017). Therefore, Egyptian Vulture during summer and winter must be protected to avoid regional loss of biodiversity and extinction of the species in Iran. There is no mechanism to coordinate the scientific community and environmental departments in Iran. Accordingly, we recommend that wildlife managers use this study to develop conservation strategies directed toward maintaining or ameliorating the quality of the species’ potential habitat along its migration routes in the region.
Using MaxEnt in conservation-oriented studies has become common practice (Fourcade et al. Reference Fourcade, Besnard and Secondi2018). Nevertheless, MaxEnt models have shortcomings such as: presence-only models underperform in predicting species’ distributions compared to presence-absence models since absence data can help indicate unsuitable habitats for species, a process known as “fixing the floor”. Thus, the importance of absence data is in eliminating low suitability areas that could have been categorised as suitable habitats if presence-only data had been used (Brotons et al. Reference Brotons, Thuiller, Araújo and Hirzel2004, Lahoz-Monfort et al. Reference Lahoz-Monfort, Guillera-Arroita and Wintle2014); and MaxEnt models can take advantage of museum and atlas data, which provide presence-only information. However, there are biases in data provided by museums and atlases towards accessible areas or areas where species are expected to occur (Kadmon et al. Reference Kadmon, Farber and Danin2004, Pearce and Boyce, Reference Pearce and Boyce2006). The data we have used as input face the same challenges. Rather than being collected with strategies such as random or systematic sampling, data in museums and atlases are gathered without particular sampling schemes, and without any particular purpose in mind (Elith et al. Reference Elith, Graham, Anderson, Dudík, Ferrier, Guisan and Li2006). Biases in sampling intensity can therefore arise (Phillips et al. Reference Phillips, Dudík, Elith, Graham, Lehmann, Leathwick and Ferrier2009, Leitão et al. Reference Leitão, Moreira and Osborne2011, Yackulic et al. Reference Yackulic, Chandler, Zipkin, Royle, Nichols, Campbell Grant and Veran2013, Guillera-Arroita et al. Reference Guillera-Arroita, Lahoz-Monfort, Elith, Gordon, Kujala, Lentini and Wintle2015). As opposed to presence-absence models, presence-only models such as MaxEnt are strongly affected by such sampling biases.


