


Regular consumption of sugar-sweetened beverages (SSB) is associated with adverse health outcomes, including obesity, type 2 diabetes, CVD and tooth decay( Reference Malik, Popkin and Bray 1 – Reference Park 4 ). Nevertheless, consumption of SSB in the USA remains high, with higher consumption among those with lower socio-economic status and racial/ethnic minority populations( Reference Park 4 , Reference Miller 5 ). The prevalence of daily SSB intake is higher among Blacks and Hispanics (1·5 and 1·4 times higher, respectively) compared with the prevalence among non-Hispanic Whites( Reference Park 4 ), and these differences contribute to disparities in obesity, diabetes and other obesity-related chronic diseases, particularly among children from low-income and racial/ethnic minority backgrounds( Reference Park 4 – Reference Mayer-Davis, Lawrence and Dabelea 7 ). For example, recent data demonstrated that Hispanic youth had a higher prevalence of obesity (21·9 %) than non-Hispanic Black (19·5 %), non-Hispanic White (14·7 %) and non-Hispanic Asian (8·6 %) youth( Reference Ogden, Carroll and Fryar 6 ). Over half of SSB consumed by children and adults are consumed in the home( Reference Kit, Fakhouri and Park 8 ). Therefore, changing the grocery purchasing habits of families in low-income and racial/ethnic minority communities is an important mechanism for reducing SSB intake and reducing racial/ethnic disparities in health outcomes.
Behaviour change strategies that are informed by psychology and behavioural economics can help promote healthy diet and prevent obesity( Reference Roberto and Kawachi 9 ). In particular, point-of-purchase strategies used in supermarkets, corner stores and worksite cafeterias, such as choice architecture( Reference Skov, Lourenco and Hansen 10 , Reference Thorndike, Bright and Dimond 11 ) and traffic-light labels( Reference Thorndike, Riis and Sonnenberg 12 ), have been shown to be effective for promoting healthier food choices. Previous work in Latino food stores has shown that in-store environmental factors such as placement and promotion strategies are associated with increased fruit and vegetable purchases among Latino shoppers( Reference Thorndike, Bright and Dimond 11 – Reference Sanchez-Flack, Pickrel and Belch 15 ). Low literacy and numeracy exacerbate differences in understanding nutrition facts panels and numeric energy (calorie) labelling( Reference Rothman, Housam and Weiss 16 , Reference Thedford 17 ). Simplified labelling schemes, such as traffic lights, convey complex nutrition information quickly and are effective among low-income and minority groups( Reference Rothman, Housam and Weiss 16 , Reference Thorndike, Sonnenberg and Riis 18 , Reference Levy, Riis and Sonnenberg 19 ). In a large hospital cafeteria, a traffic-light label and choice architecture intervention resulted in healthier purchases over two years, with the effect being strongest for beverage purchases( Reference Thorndike, Riis and Sonnenberg 12 ).
Financial incentives to promote healthy food choices can be effective in grocery settings. Price reductions for healthy items and price increases for unhealthy items are the most commonly tested strategies( Reference Afshin, Penalvo and Del Gobbo 20 ). Incentive programmes among low-income populations have demonstrated that monetary incentives to purchase more fruits and vegetables at either grocery stores or farmers’ markets (e.g. 2-for-1 fruit and vegetable promotions) result in small but significant increases in purchases and consumption of fruits and vegetables( Reference Dimitri, Oberholtzer and Zive 21 – Reference Polacsek, Moran and Thorndike 24 ). There is also a growing body of evidence that sugary drink taxes lead to a decline in purchases and consumption( 25 ). A recent randomized trial of a food assistance programme (similar to the Supplemental Nutrition Assistance Program (SNAP)) tested an intervention that combined a restriction on the purchase of SSB, baked goods and candy (i.e. purchases of these items were not allowed) with a financial incentive for the purchase of fruits and vegetables( Reference Harnack, Oakes and Elbel 23 ). Results of that study demonstrated that the combination of the unhealthy food restrictions with the fruit and vegetable incentives improved dietary intake.
Although monetary incentives to increase healthy food purchases are effective, there is little evidence to determine if monetary incentives are effective to decrease purchases of unhealthy foods, such as SSB. Financial incentives have been successful for reducing other unhealthy behaviours, including smoking and drug use( Reference Volpp, Troxel and Pauly 26 – Reference Higgins, Heil and Dantona 28 ). We hypothesized that financial incentives combined with supermarket traffic-light labels would be more effective than traffic-light labels alone to reduce unhealthy beverage purchases. We conducted a randomized controlled trial in a community supermarket to test the effectiveness of financial incentives and in-store beverage traffic-light shelf labels to reduce the purchase of SSB by families who regularly shopped at the store.
Methods
Setting and participants
The present study was conducted in Chelsea, MA, USA, a city located north of Boston with a population of 37 000 people, of whom 62 % are Hispanic/Latino and 27 % live at or below poverty level. In 2009, school health data showed that 31 % of first graders, 35 % of fourth graders and 59 % of seventh graders were overweight or obese( 29 ). Participants were recruited from a medium-sized Chelsea supermarket of 6000 ft2 (~557 m2) and approximately 30 % of the total store sales were made with SNAP electronic benefit transfer cards. To be included in the study, customers had to be 18 years or older, speak either Spanish or English, have at least one child under the age of 18 years living in the household, and report purchasing at least half of their monthly groceries at the study supermarket. Employees of the store were excluded.
Recruitment and randomization
Study staff fluent in Spanish and English recruited customers after they entered the store during weekdays between 09.00 and 17.00 hours in January 2014. When the customer consented to participate, he or she was informed about the study ‘loyalty card’ that would provide them with a 5 % discount on all store purchases during the entire study period. The loyalty card included the study participant’s name, and each card had a barcode that was scanned at the checkout and linked the participant’s purchases in the supermarket sales database.
After completing a baseline survey, study participants were randomly assigned to the intervention or control group (Fig. 1). The Stata statistical software package was used to randomize participants 1:1 to intervention or control in blocks of 8, to assure that the number of individuals in each arm was roughly equal. Study participants and investigators were blinded to the randomization assignment during the baseline data collection months (February and March 2014) and all participants were notified of their group assignment in April 2014. Study participants’ store purchases were tracked by linking the loyalty card used with their purchases, and store cash register sales data were transferred from the supermarket to the research database during the two-month baseline period (February–March 2014) and the five-month intervention period (April–August 2014).
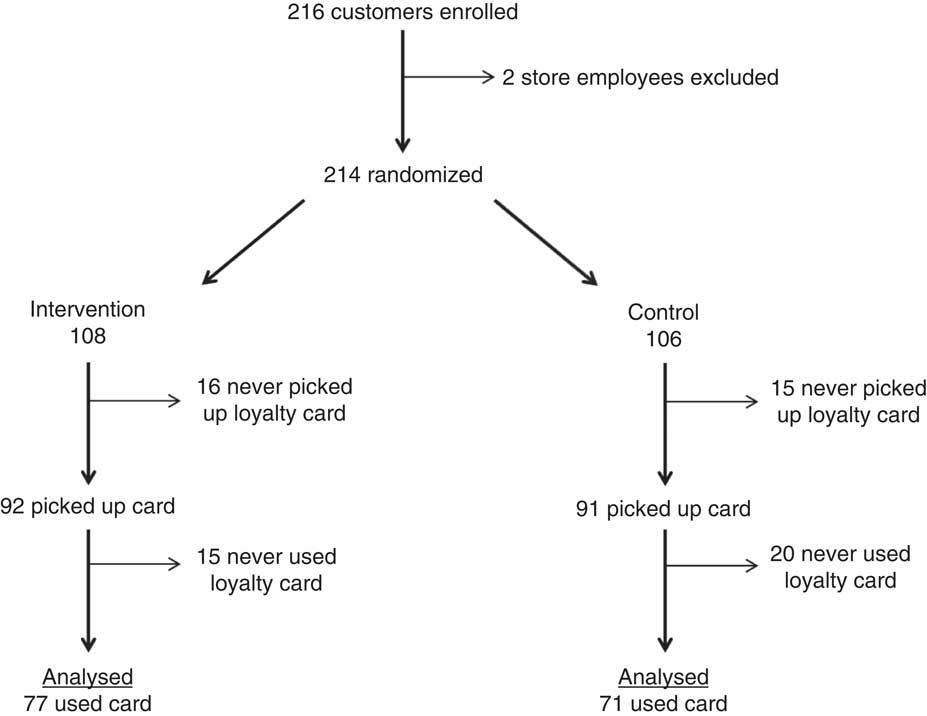
Fig. 1 CONSORT (Consolidated Standards of Reporting Trials) flow diagram of participants enrolled in a randomized controlled trial to test the effectiveness of traffic-light labels and financial incentives to reduce sugar-sweetened beverage purchases by low-income families at a community supermarket, Chelsea, MA, USA (April–August 2014)
Supermarket traffic-light beverage labels
All beverages sold in the store (750 different items), including powder mixes (when prepared as directed), were categorized as red, yellow or green based on similar criteria used for the Boston Public Health Commission’s ‘Rethink your drink’ campaign( 30 ). Beverages were categorized as ‘red’ if they contained >12 g of sugar per 12-ounce (355 ml) serving. Beverages were ‘green’ if they had <6 g sugar per 12-ounce serving and ‘yellow’ if they had between 6 and 12 g of sugar per 12-ounce serving. Additionally, skimmed and 1 % milk were labelled green, 2 % and whole milk were yellow, and artificially sweetened beverages and 100 % juice were yellow.
Following the two-month baseline period, traffic-light shelf labels were posted for each beverage item in the store to indicate if the beverage was a healthy (green), less healthy (yellow) or unhealthy (red) choice. Descriptions of the labels were posted throughout the store and all messages were provided in English and Spanish. The beverage labelling programme was called ‘Choose Well’/‘Elige Bien’ and each coloured label included a family-friendly graphic of a drink with a straw and a face. Depending on the colour of the label, the face had a smile (green=‘choose often’/‘elige siempre’), a neutral expression (yellow=‘choose sometimes’/‘elige a veces’) or a frown (red=‘choose rarely’/‘elige rara vez’; see online supplementary material, Supplement 1).
Intervention group
Intervention group participants received five monthly letters during the intervention period (April–August 2014). The initial monthly letter (April) explained what the red, yellow and green supermarket beverage labels represented and how the participant could earn a $US 25 incentive each month (in the form of a supermarket gift card) by refraining from purchasing any red-labelled beverages at the store. Each subsequent monthly letter (May–August) provided feedback identifying any red-labelled beverage purchases they made in the previous month and notified them if they earned the $US 25 gift card. Each of the monthly letters also included a graphic of the in-store traffic-light labels, brief targeted beverage education and a healthy beverage recipe (e.g. seltzer water with fruit). The beverage education topics for each month were: (i) juice and juice drinks; (ii) sports drinks; (iii) milk and flavoured milk; (iv) coffee and tea; and (v) powdered drinks. These topics were chosen based on findings from previous focus groups with non-participant store customers that demonstrated customers were aware that soda was unhealthy, but they had gaps in knowledge about the healthfulness of other sugary beverages, particularly juice, juice drinks and powdered mixes. Each letter reminded the participant to use their loyalty card to receive the 5 % store discount. The supermarket gift card could be used for all groceries available in the store, except for tobacco products. The store did not sell alcohol.
Control group
The control group participants received monthly letters with general nutrition information in the form of the MyPlate.gov graphic (http://www.choosemyplate.gov/). Each letter also included a healthy eating tip (e.g. fruit and fibre) and a healthy meal recipe (e.g. beans and brown rice). Control letters did not provide any information about beverages or about the in-store traffic-light labels. Each control letter also reminded participants to use their loyalty card to receive the 5 % store discount.
Data collection
Store sales data were downloaded daily during the entire study period (February–August 2014). Surveys were completed by study participants at the time of enrolment (baseline) and at the end of the intervention period (exit). The baseline survey collected information on participant demographics (household size, marital status, gender, age of the primary shopper), frequency and percentage of grocery shopping done at the study supermarket, and participation in SNAP. The survey also included a fifteen-item beverage frequency questionnaire to assess average consumption in the past month( Reference Hedrick, Savla and Comber 31 ).
At the end of the intervention period, participants were contacted by phone to complete the exit survey to assess: (i) shopper behaviour during the study period; (ii) awareness of intervention components (e.g. use of loyalty card, awareness of the store discount, receipt of monthly letters); and (iii) participation in SNAP. Participants again completed the fifteen-item beverage frequency questionnaire.
Statistical analyses
The primary outcome was purchase of red-labelled beverages each month of the study (≥1 red-labelled beverage purchase v. none). Study participants who were randomized but never picked up the loyalty card or never used the loyalty card were excluded from the analyses because there was no purchasing data for these individuals (Fig. 1), A generalized least-squares model with subject-specific random effects was used to assess differences by study arm in trends of the monthly probability of purchasing any red beverages during intervention period, controlling for baseline red beverage purchases and SNAP use. Primary analyses were conducted using the statistical software package Stata version 14.2.
The secondary outcome of interest was self-reported beverage consumption. For this analysis, data were included only for the participants who were randomized, used their study card at least once, and completed the beverage frequency questionnaire for both the baseline and exit surveys. Beverage survey response options were categorized into the appropriate red/yellow/green categories that corresponded to the store labelling system. Response options for frequency of consumption were collapsed into a binary response (less than once weekly v. once weekly or more). Binary beverage outcomes were modelled using generalized estimating equations to account for repeated individual measures. Time (pre/post), intervention arm (intervention/control), an interaction term (time×intervention arm) and SNAP use were included as independent variables. Two participants had missing data for a single beverage type at one time point; so under the conservative assumption of no behaviour change, the consumption value from the opposite time point was imputed (i.e. if diet soda was missing at baseline, the observed value for diet soda consumption at exit was imputed to baseline). Intervention v. control baseline survey and exit survey responses were examined using χ 2 tests or Fisher’s exact test as needed in the case of cell counts less than 5. The baseline survey, exit survey and beverage frequency questionnaires were analysed using the statistical software package SAS version 9.3.
An estimate of the incentive programme cost per household was calculated based on the total cost of monthly incentives, divided by the total number of participants. This estimate did not include other programme costs such as study personnel or the 5 % shopper incentive to participate in the study.
Results
A total of 214 store customers were randomized to the intervention or control group (Fig. 1). There were sixty-six participants who never picked up (n 31) or who never used (n 35) the study loyalty card. Therefore, 148 customers (n 77 in the intervention group and n 71 in the control group) were included in the final analyses.
Baseline characteristics of study participants are summarized in Table 1. The majority were female and identified as White race and Hispanic/Latino ethnicity. Study participants were predominantly Central American, with the most frequently reported countries of origin being El Salvador, Honduras and Guatemala. The vast majority (94 % of the intervention group and 87 % of the control group) reported consuming at least one SSB (that met criteria for a red label in the study traffic-light system, including soda, juice drinks, energy drinks, powdered mixes and sweetened teas) once weekly or more. There were no significant differences in baseline characteristics between the intervention and control group participants, except for self-reported SNAP use at baseline (66 % of the intervention group v. 49 % of the control group, P=0·04). We found no differences in participant characteristics between those who were randomized but never picked up their cards (n 31), those who were randomized and picked up their cards but never used them (n 35), and those who picked up their cards (n 183) and were included in our analyses (results not shown).
Table 1 Baseline characteristics of study participants enrolled in a randomized controlled trial to test the effectiveness of traffic-light labels and financial incentives to reduce sugar-sweetened beverage purchases by low-income families at a community supermarket, Chelsea, MA, USA (April–August 2014)

SNAP, Supplemental Nutrition Assistance Program; n/a, not applicable.
* Denotes significant result (P<0·05).
† n 67 control group participants and n 71 intervention group participants completed the beverage frequency questionnaire at baseline.
‡ Beverages were categorized as ‘red’ if they contained >12 g of sugar per 12-ounce (355 ml) serving, ‘green’ if they had <6 g of sugar per 12-ounce serving and ‘yellow’ if they had between 6 and 12 g of sugar per 12-ounce serving. Skimmed and 1 % milk were labelled green, 2 % and whole milk were yellow, and artificially sweetened beverages and 100 % juice were yellow.
Purchase of red-labelled beverages
Figure 2 shows the proportion of study participants in the intervention group and in the control group who purchased ≥1 red-labelled beverages each month during the baseline and intervention periods. The proportion of intervention participants who purchased any red beverages decreased by 9 percentage points more per month compared with control participants. The trend over the study period in the proportion of participants who purchased any red beverages was significantly different between the intervention and control groups (P=0·002).
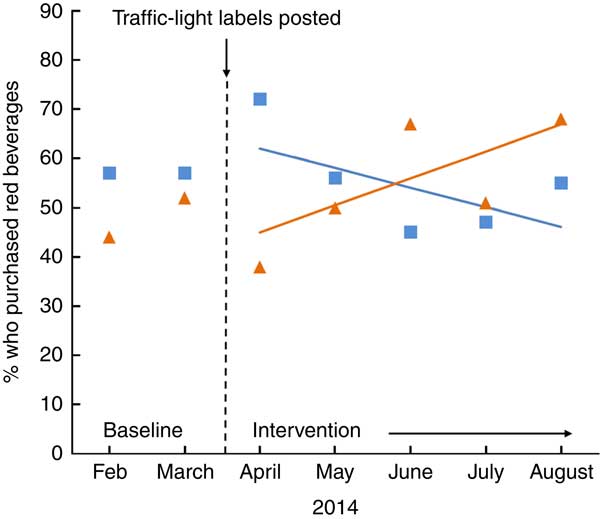
Fig. 2 Proportion of the intervention group (![]() ) who purchased any red beverages decreased by 9 % more per month compared with the control group (
) who purchased any red beverages decreased by 9 % more per month compared with the control group (![]() ) among participants (n 148) enrolled in a randomized controlled trial to test the effectiveness of traffic-light labels and financial incentives to reduce sugar-sweetened beverage purchases by low-income families at a community supermarket, Chelsea, MA, USA (April–August 2014). P=0·002 for difference in trends over time in proportion of participants who purchased any red beverages
) among participants (n 148) enrolled in a randomized controlled trial to test the effectiveness of traffic-light labels and financial incentives to reduce sugar-sweetened beverage purchases by low-income families at a community supermarket, Chelsea, MA, USA (April–August 2014). P=0·002 for difference in trends over time in proportion of participants who purchased any red beverages
Self-reported beverage consumption
Results from participants who completed the beverage frequency questionnaire at both baseline and the end of the study are summarized in Table 2. There was a significant reduction in the proportion of intervention group participants who reported consuming ≥1 red beverage per week compared with control group participants (−23 % v. −2 %, P=0·01 for the time × intervention arm interaction). There were no significant differences between the intervention and control participants in self-reported consumption of yellow or green beverages.
Table 2 Beverage frequency questionnaire results, baseline v. exit surveyFootnote †, among participants enrolled in a randomized controlled trial to test the effectiveness of traffic-light labels and financial incentives to reduce sugar-sweetened beverage purchases by low-income families at a community supermarket, Chelsea, MA, USA (April–August 2014)
n/a, not applicable.
* Denotes significant result (P<0·05).
† Restricted to those who completed exit survey AND used card at least once.
‡ Beverages were categorized as ‘red’ if they contained >12 g of sugar per 12-ounce (355 ml) serving, ‘green’ if they had <6 g of sugar per 12-ounce serving and ‘yellow’ if they had between 6 and 12 g of sugar per 12-ounce serving. Skimmed and 1 % milk were labelled green, 2 % and whole milk were yellow, and artificially sweetened beverages and 100 % juice were yellow.
Participant exit survey
Nearly all exit survey respondents from both the intervention (n 56) and control (n 54) groups reported that they remembered receiving the monthly nutrition letters and found the nutrition information to be helpful (see online supplementary material, Supplement 2). Intervention group respondents were significantly more likely to report noticing changes in the supermarket beverage aisles during the intervention period (58 % v. 30 %, P=0·003) and were less likely to report buying red beverages at other supermarkets during the study period (15 % v. 39 %, P=0·004). Among those respondents who reported receiving a $US 25 gift card during the study period, 78 % correctly reported that they had received it because they had avoided purchasing unhealthy beverages. At the time of the exit survey, 65 % of the intervention group and 54 % of the control group reported using SNAP to pay for groceries (P=0·21). Most participants in the intervention group who reported avoiding red beverages to earn the financial incentive reported using SNAP benefits (25/31, 81 %), whereas only about half of those who reported that they did not avoid buying unhealthy beverages reported using SNAP (9/17, 53 %; P<0·001).
Estimated cost
The estimated cost of the programme based on the cost of the incentives was $US 5·28 per household per month, if standardized by the number of all participants randomized to the intervention (n 108). This estimate was slightly higher, $US 6·20 per household per month, if standardized by the number of participants randomized to the intervention who picked up their loyalty card (n 92).
Discussion
Financial incentives paired with in-store traffic-light labels resulted in a significant decrease in supermarket purchases of SSB by families in a low-income urban Latino community. Consumption of unhealthy beverages also decreased among participants in the intervention group but not among those in the control group. Beverage consumption was based on a self-reported beverage frequency questionnaire for an individual respondent and theoretically should capture beverages obtained from all sources (i.e. not limited to those purchased at the study supermarket), but the store sales data are a better measure of overall household consumption. It is meaningful that the study results demonstrated significant reductions in both household purchases and individual consumption of red beverages.
Although the effects observed in the present study were modest, these results suggest that financial incentives combined with in-store traffic-light labels were effective for reducing the purchase of red-labelled beverages in the supermarket. Given the current disparities in SSB consumption and associated health consequences by race/ethnicity and socio-economic status in the USA, particularly among children, there is a need for new strategies to reduce SSB consumption among low-income Latino families. Although progress has been achieved with school-based interventions, little has been done to change SSB-purchasing habits of families. Since a large proportion of SSB is consumed in the home, interventions to reduce supermarket purchases could have a significant impact on childhood obesity. Previous studies have demonstrated the effectiveness of store-based interventions and environmental factors on increasing fruit and vegetable purchases in Latino food stores( Reference Thorndike, Bright and Dimond 11 , Reference Ayala, Baquero and Laraia 13 , Reference Sanchez-Flack, Pickrel and Belch 15 ), but there are no prior store intervention studies, to our knowledge, that have aimed to reduce SSB purchases by Latino shoppers.
Results from the exit survey provide some insight about what aspects of the intervention were most effective. Even though all participants were exposed to the traffic-light labels in the supermarket aisles, significantly more participants in the intervention group noticed these changes. This likely occurred because the intervention letters provided participants with information about the traffic-light label graphics to help them understand the incentive programme. In addition, the letter provided brief education on healthy beverage choices in the store. Significantly more participants in the control group than in the intervention group indicated that they had purchased SSB in other supermarkets during the study period. These findings from the exit survey suggest that the intervention group letters providing feedback about the incentives and brief education about healthy beverages may have increased intervention participants’ attention to the in-store traffic-light labels and contributed to a reduction in their purchases of SSB at other stores.
Although both the intervention and control group participants shopped at the study supermarket with the same frequency, most control participants reported that they did not notice the traffic-light shelf labels. In a busy supermarket setting with many advertisements and promotional labels, customers may have difficulty noticing or focusing on individual labels. Previous research has shown that several different aspects of grocery stores can motivate shoppers to purchase more healthful foods, including labelling, discounts and availability( Reference Moore, Pinard and Yaroch 32 , Reference Glanz, Bader and Iyer 33 ). However, even with these prompts, identifying healthful choices can be difficult due to factors such as limited options, persuasive marketing and/or convenient placement of unhealthy foods( Reference Chance, Golin and Dhar 34 ). In particular, consumers may be more susceptible to in-store cues for unhealthful purchases due to a trade-off between the immediate benefits of unhealthy options (e.g. taste, price or convenience) compared with the long-term benefits of healthy options (e.g. better health)( Reference Chance, Golin and Dhar 34 ). Others have reported that individuals with less healthful diets are more likely to ignore food label information due to lower perceived benefits of this information( Reference Lin, Lee and Yen 35 ). Our results indicate that the financial incentives and education increased the salience of in-store labels for customers.
Our estimates of the intervention cost per household per month demonstrated a relatively low cost of incentives over the course of the study. These estimates are relevant when considering policies that might reduce the purchase of SSB by participants using SNAP benefits to pay for groceries. In the intervention group, 81 % of those who avoided purchasing unhealthy beverages to earn the incentive were SNAP recipients, suggesting that the financial incentive was particularly salient for those participating in SNAP. Our cost estimate does not include one-time expenses that would be associated with implementing this type of incentive programme elsewhere (e.g. personnel time, training for participants, costs to retailers to modify point-of-sale systems) or the ongoing costs of mailing monthly letters. Our estimated intervention cost is slightly higher than other trials of healthy shopping incentives, such as the calculation of $US 3·65 per household per month during the intervention phase of the US Department of Agriculture’s Healthy Incentives Pilot( Reference Bartlett, Klerman and Olsho 22 ). It remains to be seen whether any type of financial incentive programme to promote healthy food choices will result in lower rates of chronic disease and health-care costs. In general, financial incentive interventions may not promote sustained behaviour change when the incentives are no longer available( Reference Volpp, Troxel and Pauly 26 , Reference Thorndike, Riis and Levy 36 ). This is an important consideration for the design and evaluation of future interventions.
Strengths of the present study include the randomized design and the use of objective sales data. There are several limitations. Consumption of SSB was quantified based on self-report and we were not able to evaluate the effect of the intervention on overall spending or quality of purchases (i.e. using the store gift card to purchase unhealthy foods). In addition, participants could have purchased SSB at other stores during the study. However, 85 % of the intervention group and 61 % of the control group reported that they did not do so on the exit survey. This finding could partially reflect social desirability bias, particularly among the intervention group participants who likely had a greater awareness that SSB were an undesirable choice by the end of the study. Due to the real-world setting, there were logistical challenges that may have influenced study participation. These challenges included a delay in printing of the loyalty card that required study participants to pick up the card at a subsequent visit to the store and the need to create a loyalty card system that was not routinely used in the store. As a result of these issues, 31 % of participants did not pick up or use the loyalty card and therefore could not be included in the study analyses. However, these participants did not differ from those who did pick up and use their cards with respect to baseline demographics. Another logistical challenge was that study participants also had to pick up their reward ($US 25 store gift card) in the store at the end of the month. It is possible that a more immediate reward (i.e. at the time of each purchase) would have yielded a greater effect size. Further work is needed to determine the lowest cost and most effective delivery system of incentives. Finally, the study was conducted in a low-income, urban Latino community, so results may not be generalizable to more rural or higher-income settings.
Conclusions
The present study demonstrated that financial incentives combined with in-store traffic-light labels were effective for helping low-income supermarket customers reduce their purchases and consumption of SSB. Strategies that combine simple point-of-purchase labelling with incentives have the potential to improve motivation and skills for making healthier choices among low-income populations. These findings have implications for federal food assistance programmes, employers, health insurers and others interested in improving dietary intake and health. Next steps will be to test the scalability and long-term effectiveness of these types of strategies.
Acknowledgments
Acknowledgements: The authors would like to thank Mr Alberto Calvo, the owner of Stop and Compare Supermarket (http://www.stopandcompare.net) in Chelsea, MA, for his contributions to this study. They would also like to thank and acknowledge the hard work and collaboration of the entire staff at Stop and Compare during the planning and execution of the project, as well as the contributions of Ms Audrey Schield in assisting with data collection. Financial support: The project was supported by the Harvard Clinical and Translational Science Center, from the National Center for Advancing Translational Science (grant number 8 UL1 TR000170-05); and the National Institutes of Health (R.L.F., grant numbers T32 DK 007703, T32 HL 098048). A.N.T. was supported in part by a grant from the Carney Family Foundation. The funders had no role in the design, analysis or writing of this article. Conflict of interest: None. Authorship: A.N.T. and E.B.R. conceptualized and supervised the study, obtained funding and contributed to analyses. L.M.-N. provided overall programme management. D.E.L. provided data management and completed analyses. R.L.F. conducted initial data collection, completed analyses and led the writing of the manuscript. All authors contributed to manuscript preparation and approved the final version. Ethics of human subject participation: This study was conducted according to the guidelines laid down in the Declaration of Helsinki and all procedures involving human subjects/patients were approved by the Partners Institutional Review Board in 2013. This trial is registered at ClinicalTrials.gov (NCT01990508).
Supplementary Material
To view supplementary material for this article, please visit https://doi.org/10.1017/S1368980018000319


