


It has been reported that the concentration of plasma fatty acids are interrelated and reflect the complex interplay of dietary consumption and endogenous metabolism( Reference Imamura, Lemaitre and King 1 ). Therefore, it is not sufficient to examine individual fatty acids using conventional statistical methods. Cluster analysis allows for the identification of distinct, relatively homogeneous groups based upon selected attributes. In this study, k-means cluster analysis was used to explore patterns of plasma fatty acids and how they reflect dietary intake and biomarkers of metabolic health.
The National Adult Nutrition Survey( 2 ) estimated habitual food and beverage intake in a representative sample of 1,500 Irish adults. A 4-day semi-weighed food diary was used to record food and beverage intake data. Consenting participants (n = 1138) provided a fasting blood sample after the diary recording period had ended. Plasma total fatty acids were extracted and transesterified using Bligh & Dyer( Reference Bligh and Dyer 3 ) and Ohta( Reference Morrison and Smith 4 ) methods respectively. Plasma fatty acid profile (n = 26) were expressed as percentage of total fatty acids and used as the clustering valuables. Firstly, all values were standardized by subtracting their minimum from their value and then dividing by their range( Reference Lo Siou, Yasui and Csizmadi 5 ). Two-step cluster analysis and scree plots were then used to determine the best fitted number of clusters (n = 4) and then the cluster analysis were repeated using the methods of k-mean. Estimation of mean and standard deviation (SD) values and GLM adjusted for (Bonferroni correlation) social class, smoking status, age, BMI and energy) were carried out using SPSS version 20·0 (IBM Inc. Chicago, USA).
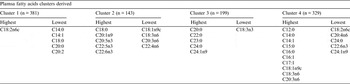
Cluster 1 of the four clusters generated by the k-means method (n = 381) was characterized as ‘linoleic acid’ pattern, with the highest percentage of linoleic acid and the lowest percentage of some medium chain and long chain fatty acids. Cluster 2 (n = 143) was characterized as ‘n-3 polyunsaturated fatty acid (PUFA)’ pattern. This pattern had the highest n-3 PUFA percentage in plasma and had the lowest percentage of oleic acid and some n-6 PUFA. Cluster 3 (n = 199) was characterized as ‘long-chain saturated fatty acid (LCSFA)’ pattern, with the highest plasma percentage of C20:0, C22:0, C23:0 and C24:0 and the lowest percentage of α-linolenic acid. Cluster 4 (n = 329) was described as ‘short-chain fatty acid (SCFA)’ pattern which is highest in some short chain fatty acids. Further analyses indicated that plasma fatty acids patterns were related to dietary intake and markers of metabolic health. Cluster 2 was associated with healthier dietary intakes (data not shown), while cluster 4 was associated with adverse concentrations of markers of metabolic health.
The project was funded by the Department of Agriculture, Fisheries and Food, and Health Research Board under the Food for Health Research Initiative 2007–2012
