

The Present Conundrum
A central theme of the book is the relationship between the present and the future, and in particular the conundrum in which we find ourselves in the modern world with respect to our environment and the survival (or not) of our current ways of life in a globalizing world. Let us therefore take a look at some of the trends that characterize our current societies globally. Doing so will rapidly show us that although greenhouse gas emissions have been targeted by international politics as the focus of our battle against the destruction of our environment, this is woefully insufficient and actually misleading because it ignores the roots of the problem and oversimplifies the challenge.1
If we view the current challenges as societal rather than environmental in origin, there are a number of essentially societal dynamics that are threatening to exceed their own safe operating spaces: demography, food security, financial stability, wealth distribution, urbanization, etc. Fortunately, as part of the efforts of the United Nations (UN) to define sustainable development goals (SDGs) in 2015 and to propose an agenda to reach those goals, the realization has quickly grown in the scientific community that, indeed, the challenge is in large part a societal one (see Chapter 19 for a more detailed discussion of the SDG research effort). Moreover, the recent focus on SDGs has shifted efforts toward viewing the core sustainability challenges through the lens of a multidimensional systemic approach. This is beginning to have an impact on governments as well, with efforts to coordinate ministries and agencies now also including central government functions, such as the ministries of finance, planning, and/or the prime minister’s office. Yet the engagement of the social science community is still in its infancy compared with that of the natural and life sciences. For one, because it was initially called upon to respond to issues that the natural sciences defined, it was as it were backed into its main topic: societal dynamics. As a result, much effort has been spent by social scientists studying such topics as climate and society, water and human needs, food (in)security, rather than focusing on studying the internal dynamics of society that have brought us to the current situation. Moreover, there has to date not been enough of a coordinated effort at developing the results of different sectoral approaches to dynamics in various societal domains into a more holistic, scientifically coherent one, based on intellectual fusion between the efforts of disciplinary communities. Neither have the scientific and the economic, financial, and political communities looked closely at the role of unintended, unanticipated consequences of earlier choices.
Briefly discussing some of the main sustainability challenges just mentioned, this chapter probes the depth to which an analysis of our current multidimensional predicament must go. It emphasizes the complexity of the challenge and the need to begin to view it from a complex systems perspective. Finally, it will emphasize that our current situation is due to the effects of unexpected and unanticipated consequences of earlier choices made by our western societies, which are in my opinion the root cause of tipping points throughout history. With that perspective, a “crisis” or “tipping point” is a (usually temporary) situation in which the information-processing capacity of a society is no longer able to deal with the highly complex dynamics in which the system finds itself owing to the shift in risk spectrum that it has undergone over time.
The Environment
Our actions over many centuries have ultimately transformed our environment to the point that the relative stability of the Earth system dynamics that we have, as humans, enjoyed over some 10,000 years, may be coming to an end within this century. Over the last hundred years or so, many indicators of the expansion of the socioeconomic system, both globally and locally, have gone exponential, and so have indicators of its impact on the environment.
Steffen et al. (Reference Steffen, Sanderson and Tyson2005, Reference Steffen, Richardson, Rockström, Cornell, Fetzer, Bennett, Biggs, Carpenter, de Vries, de Wit, Folke, Gerten, Heinke, Mace, Persson, Ramanathan, Reyers and Sörlin2014) illustrate that transformation in a single figure (Figure 2.1). In the last thirty years, moreover, numerous signs have emerged that our current society is close to hitting, or actually has hit, a series of planetary environmental risk barriers (Rockström et al. 2009) (Figure 2.2). After some thirty years of research on changes in the environment that saw our challenge essentially as an environmental one, awareness is growing that we are in effect dealing with a societal challenge. After all, society defines its environment, identifies environmental challenges, and proposes solutions for them. Societal action is therefore the only kind of action that can have caused, and may change, the current trend.
This leads me to argue that as scientists we may until recently have been looking under the streetlights to find the key that we have lost somewhere in the dark beyond the reach of those streetlights. To determine why this has happened would be a highly interesting and important topic of research in its own right. Instead of mainly looking at socioenvironmental dynamics to see where there are dangers lurking, and how we might mitigate these so that we could retain our current western lifestyle, we should have been looking more closely at the societal dynamics that created the current conundrum and how we might change that lifestyle.
Might some of the signs that Steffen has collected also indicate that we are crossing, or at least approaching, a set of societal planetary boundaries? In this chapter I will try to explore that question. I will briefly enumerate a number of the dimensions in which our societies are threatening their own safe operating space. Most, if not all, of these are known, but because of the disciplinary and sectoral fragmentation of our worldview and our science, many of them have not sufficiently been linked in a holistic perspective to see what they really mean for our future. Others have not been discussed because they derive from such fundamental values and assumptions in our culture that they are our sacred cows.
Global Demography and Health
Figure 16.1 shows three different projections of the demographic tendencies currently observable worldwide. Notwithstanding the fact that it is difficult to predict the demographic evolution over a whole century, it is one of the most solid forecasts of all, even though in the past effective population growth has often tended to attain the higher ranges of the predictions. The predictions take increasing life expectancy in proportions related to wealth and healthcare into account, and also the fact that as populations grow wealthier they reduce their birthrates. But they do not take the potential nonlinearities into account that might be created by quantum jumps in healthcare, such as the healing of cancers, the potential of stem-cell therapy, etc.
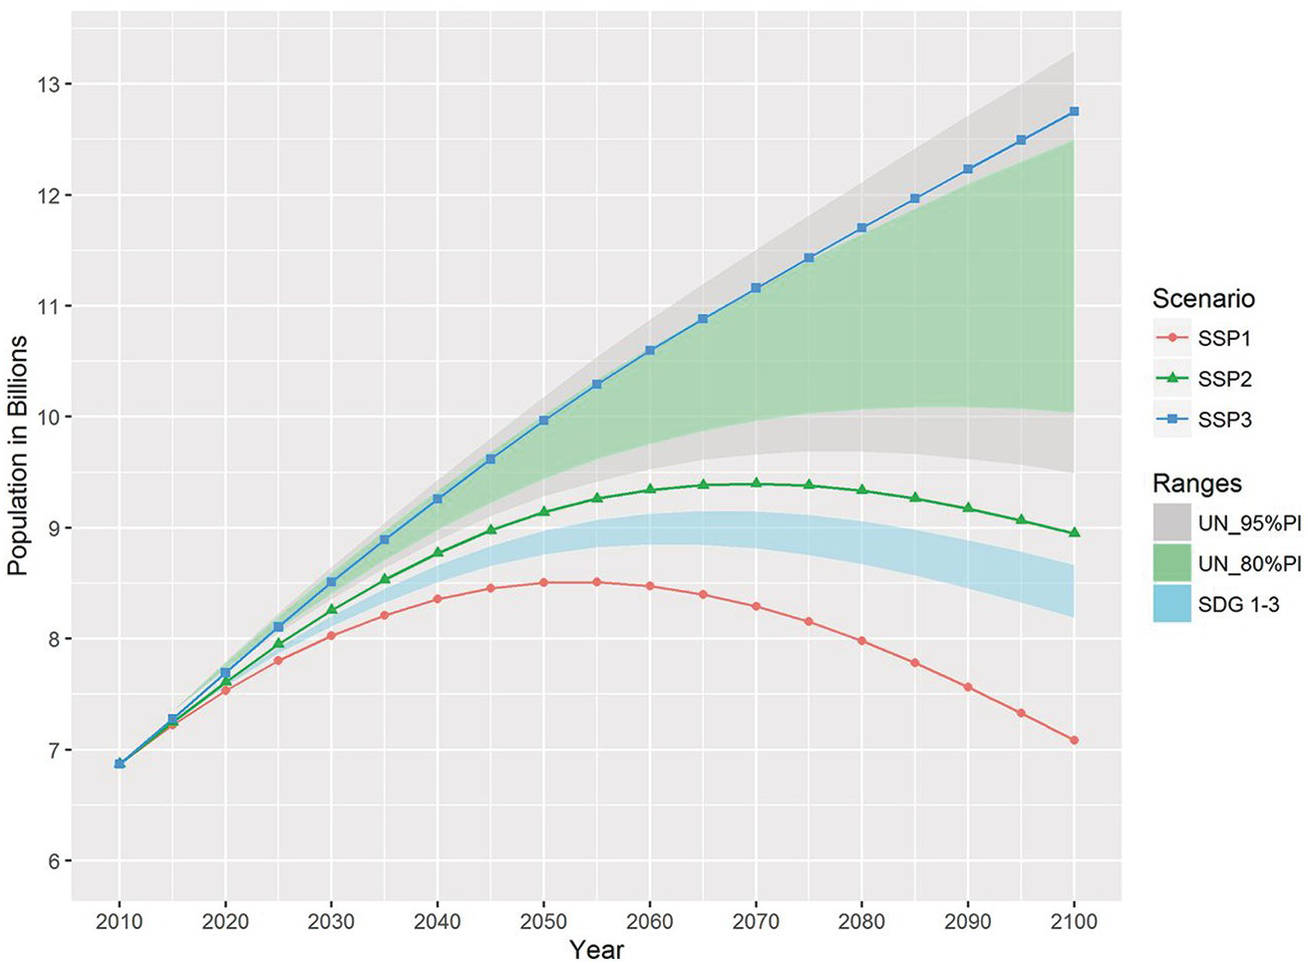
Figure 16.1 Projected global population growth 2000–2100 as projected by the three Shared Socioeconomic Pathways (SSP) scenarios and the probabilistic ranges given by the UN.
The wide divergence between the scenarios in Figure 16.1 clearly illustrates the difficulties of projecting so far into the future.
These population figures are only one part of the picture. Major differences in the distribution of health are the other. As shown in Figure 16.2, health, as represented by life expectancy at birth, is very unevenly distributed across the globe, and its distribution appears to be similar to that of wealth.
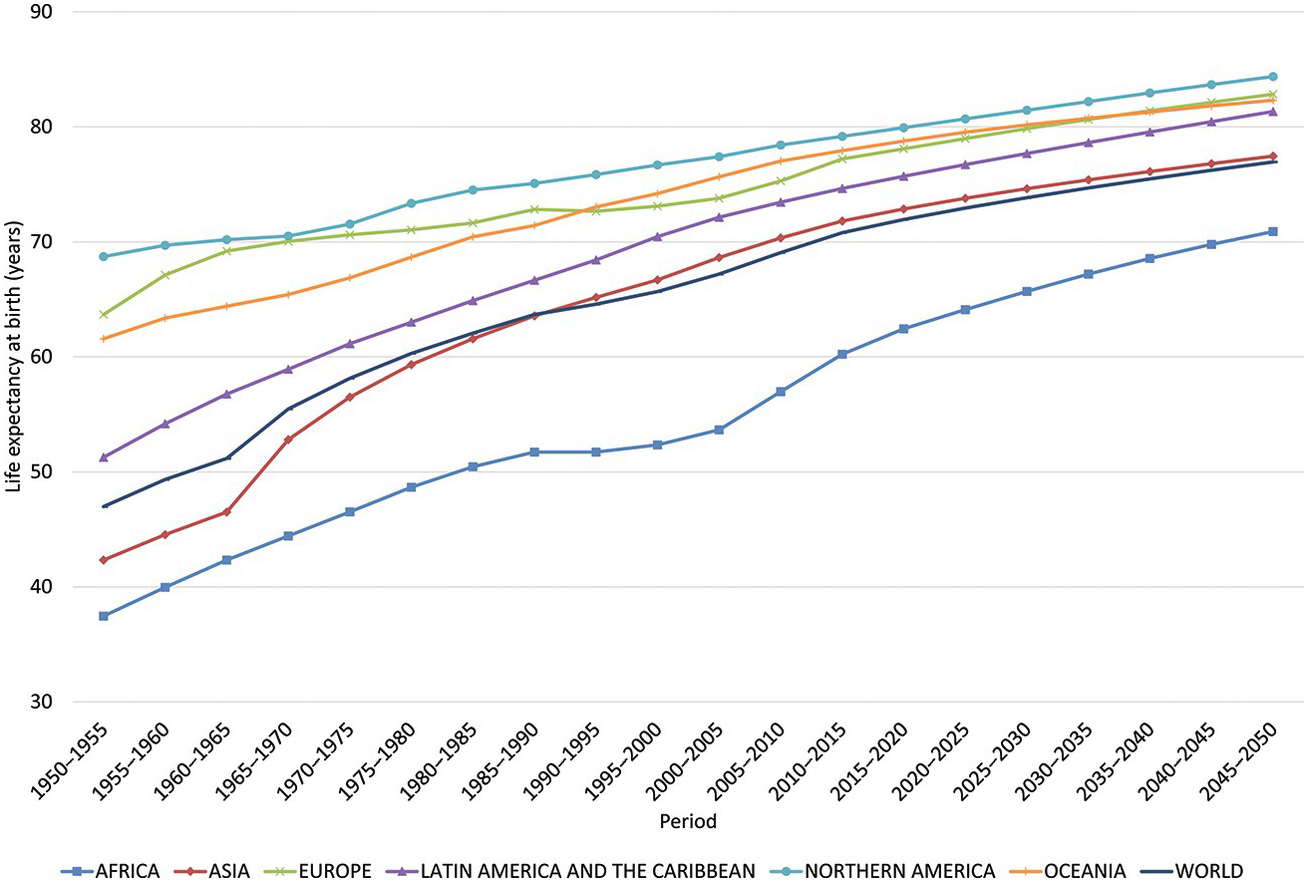
Figure 16.2 Life expectancy at birth (years) by region: estimates 1975–2015 and projections 2015–2050.
This has direct implications for overall global population growth, which in the coming decades is expected to be principally occurring in Africa (Figure 16.3).
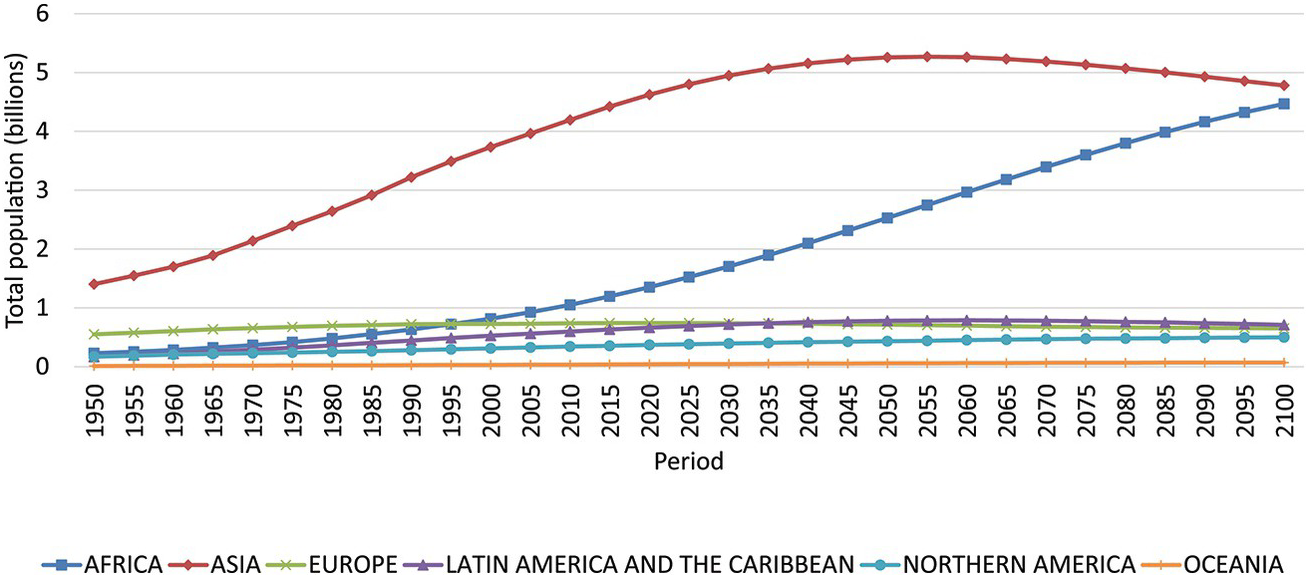
Figure 16.3 Population growth by macro-region. Most population growth is predicted for Africa.
It is generally expected that with growing wealth in the developing world, the crude birth rate will go down as life expectancy increases. In 2018 the population of the world is growing at an average annual rate of 1.1 percent. This rate has been declining since 1965–1970, when it peaked at around 2.1 percent. The fact that world population growth is on the decline can be explained by the Demographic Transition Theory (Notestein Reference Notestein1954). Eventually, according to this theory, all societies evolve from a pretransition situation (stage 1), where fertility and mortality are unchecked and high, thus producing low population growth, to a stationary population (stage 4), when a society reaches low levels of fertility and mortality. This pattern is quite well established and exceptions have so far been of a temporary nature.
The crucial question is, however, whether growth in wealth and decrease in birth rate will manifest themselves at more or less the same rates or not. Another question is how these processes will play out in different parts of the world. No one knows, but it is clear that 200 years of western industrial economy have created important demographic discrepancies that may impact on global sustainability.
Aging
Behind these global figures lurks a potentially major challenge: aging. Generally, it is assumed that growing economies require growing working-age populations. Currently, in a number of developed countries, aging and a low birth rate combine to cause decreasing numbers of inhabitants of working age: Japan, China, Germany. Others still have an expanding population due, for example, to important immigration (the USA, Canada, Australia), but in a general political climate in which immigration is increasingly subject to xenophobia, those fluxes may well decrease. This will have an impact on the size of these economies, not so much from the supply side (where people will probably be replaced by automation), but on the demand side.
The opposite is the case for Southeast Asia and Africa, where birthrates are still higher and the working-age population will be growing for some time. There, the economies will continue to grow, and one of the interesting questions that raises is whether this will also entail a shift in global power balance toward the currently developing countries. That will in part depend on whether, and how far, these countries will be able to develop their technologies and economies, but also their institutions and legal systems. China has shown, over the past few decades, how this can be done.
Global Migration
Another fundamental characteristic of the current world, but with ancient origins, is large-scale migration. It is exceedingly difficult to obtain good quantitative data on the numbers of people involved, and a purely narrative description will have to suffice.
Current research indicates that on a global scale migration has not recently increased substantively, but at local and regional scales it has shifted demographies. According to the UN, during 2005–2050 the net number of international migrants to more developed regions is projected to be 98 million (UNDESA 2017). Such regional migration is likely to further accelerate in the foreseeable future owing to, for instance, climate change, sea level rise, and food and water availability. But there may also be increasing pressure toward migration for societal reasons, such as warfare, failing states, populism, ethnic cleansing, or criminal violence. The rapid spread of information through word of mouth, television and the Internet is contributing to migration in important ways. It triggers widespread “push” reactions in the developing world, driving people living in dangerous or economically difficult circumstances to migrate to the USA, Canada, the EU, and other (mainly developed) countries.
Migration is thus likely to further accelerate in the foreseeable future. The counterpart may be a defensive reaction in developed countries, fed by local populism and identity issues, creating more barriers to migration and globalization such as is currently occurring in Southern Europe and the USA. But then, demographic and economic declines in developed countries may in the end overcome such sentiments. Major environmental disasters and ethnic cleansing will probably further complicate the situation. All in all, we can therefore expect major cultural, social, and economic challenges related to migration in the developed world as well as in the developing world, wherever state control is not willing or able to deal with, or prevent, mass migration.
Food (In-)Security
The importance of these demographic trends becomes clear if one compares them with the evolution of our resource footprint as a global population. One consequence of major innovations in healthcare, and the spread of technologies to make human beings healthier across the world, has been that we are, as Tim Flannery (Reference Flannery2002, n.p.) put it, “eating our future.” We are facing a potential crisis in the provision of water and food for the world population that could very easily trigger major conflicts. Recent increases in food prices due to speculation are early warning signs that food security may, in the not-so-distant future, become a major challenge worldwide (Figure 16.4). No surprise, then, that the topic has in the past five years emerged as a major concern, both scientifically and politically.
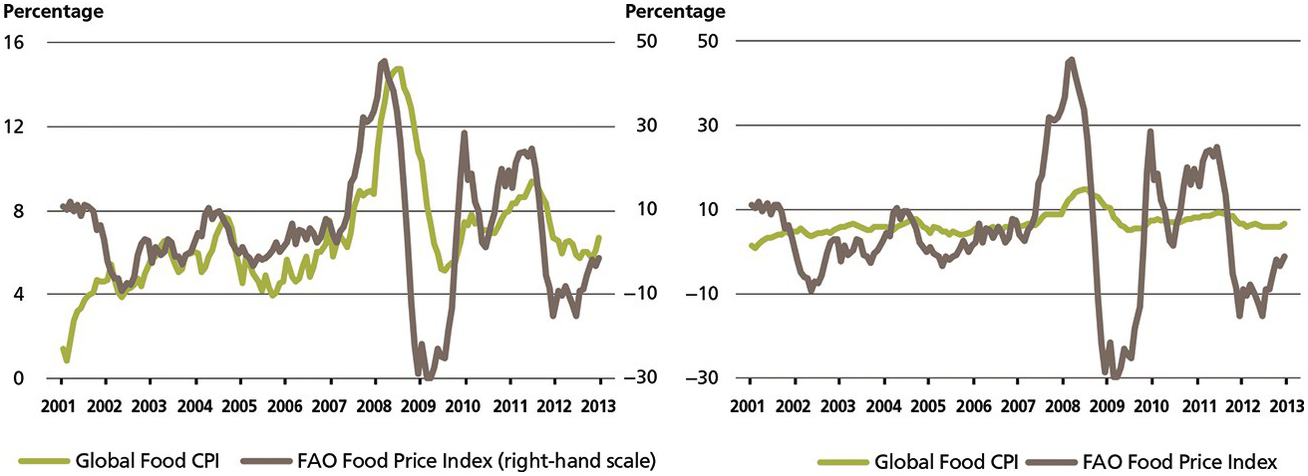
Figure 16.4 Food prices remained relatively stable from the 1980s to 2005 thanks to the green revolution, but have recently spiked partly as a result of speculation and ethanol production
Individual countries are hedging against the possibility that food and water insecurity will threaten their populations, for example by buying large tracts of land in Africa. But as the population of Africa is growing faster than the population of any other area, one has to wonder whether this strategy will in the end be sustainable.
Fossil Energy
Energy has been a constraint on human societal evolution for most of the existence of the species, but that constraint was lifted with the harnessing of fossil energy in around 1800.
Since then, energy use has increased very rapidly, as was seen in Figure 15.1. Basically, the societal dynamics that are driving our societies have increased average global energy consumption from approximately 20 gigajoules (GJ) per capita per year at the beginning of the Industrial Revolution to approximately 80 GJ per capita per year now. Clearly this is very unevenly divided between the developed and the developing world. In the USA, in 2013, average per capita consumption was in the order of 290 GJ equivalent per year, while in India it was only about 25 GJ. Most of that difference is absorbed in building, maintaining, and running our material and institutional infrastructure. A growing need for energy is fundamental to the way in which the world is currently moving, and energy consumption, for political and economic as well as societal reasons, is not likely to decrease in the foreseeable future.
Yet the total quantity of exploitable fossil energy on earth is limited, and this has, since the 1970s, led to the conclusion that at some point in the future oil as a cheap resource will be exhausted. That point may recently have been pushed back owing to exploitation of new oil gas deposits (but see Day & Hall Reference Day and Hall2016), the discovery of large volumes of natural gas, and the expansion of renewable energy use, but traditional gas and oil exploration and exploitation is becoming more and more expensive because the superficial sources in accessible areas are being depleted and replaced by fossil fuel from very deep sources (presal in Brazil) or extreme climates (Arctic). Though there is coal for many more years, the fact that burning it is highly unadvisable from a greenhouse gas and global warming perspective is forcing us globally to reduce its use.
As energy has been an early target in the world’s efforts to reduce global CO2 emissions, major efforts have been deployed to reduce both the use of fossil fuels and of their CO2 emissions. Numerous approaches have been discussed and some of them undertaken. Technologies have been invented and improved, such as the application of digital information processing in grids. In particular, substantive measures have been taken to reduce CO2 emissions (by shifting from coal to oil, then gas, then renewables) and to increase the efficiency of energy use (in electricity generation; insulation of buildings; transport, etc.). But as Figure 16.5 shows, this is still woefully insufficient, partly because only a fraction of total energy ends up being useful (Figure 16.6 in the box below).
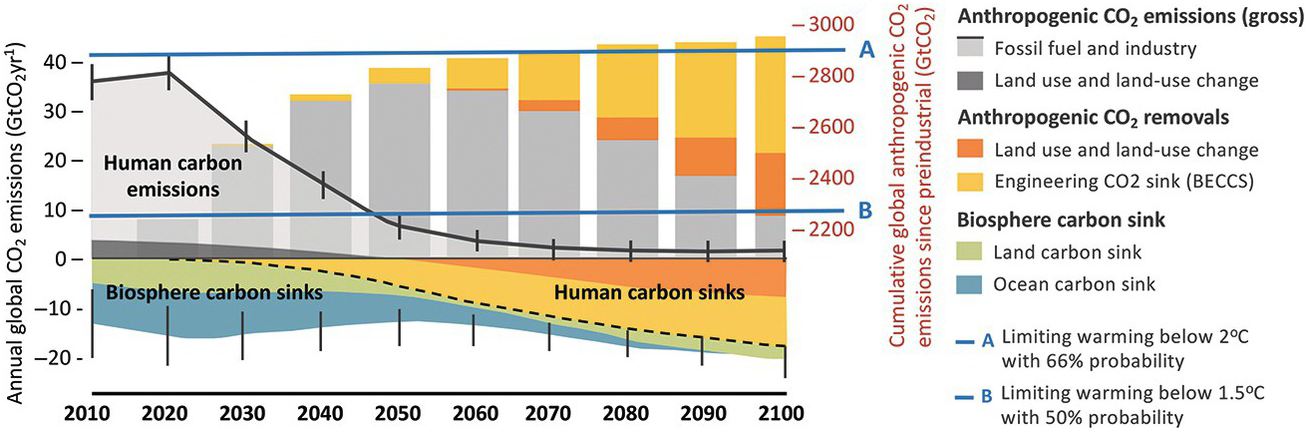
Figure 16.5 Cumulative and annual emissions and sinks of CO2 are shown for stabilizing global climate at below 2ºC and 1.5ºC. Most of the carbon emissions shown in gray are energy-related. Together with land-use emissions they need to decline toward zero by midcentury. The figure is called Carbon Law as a metaphor to Moore’s Law of semiconductors, where a number of transistors on a chip doubled every two and a half years. Carbon Law indicates that global emissions need to be halved every decade. In addition, human carbon sinks need to increase to almost half the magnitude of current positive emissions: This is a tall order. Carbon capture from biomass (bio-energy use with carbon capture and storage – BECCS) and land-use change are here the key. Third, biosphere carbon sinks need to be maintained as atmospheric concentrations decline. The vertical gray bars show cumulative emissions since the beginning of the industrial revolution of some 2,000 billion tons CO2. This budget, or carbon endowment of humanity, will be exhausted shortly as the remaining emissions for achieving stabilization at below 1.5ºC are essentially nil while we still emit some 40 billion tons CO2 per year. Net-negative emissions are needed to stay within this budget. The remaining budget for stabilizing at 2ºC is a bit more generous so that the demand on net-negative emissions can be significantly reduced. The Carbon Law can be seen as a roadmap toward making the Paris Agreement and the SDGs a reality. Pathways shown in this report such as the SSP1 variant focused at the 1.5ºC target or the alternative scenarios portray similar dynamics, whereas the latter is unique among stabilization pathways as it does not need net negative emissions because of vigorous changes in end-use technologies and behaviors.
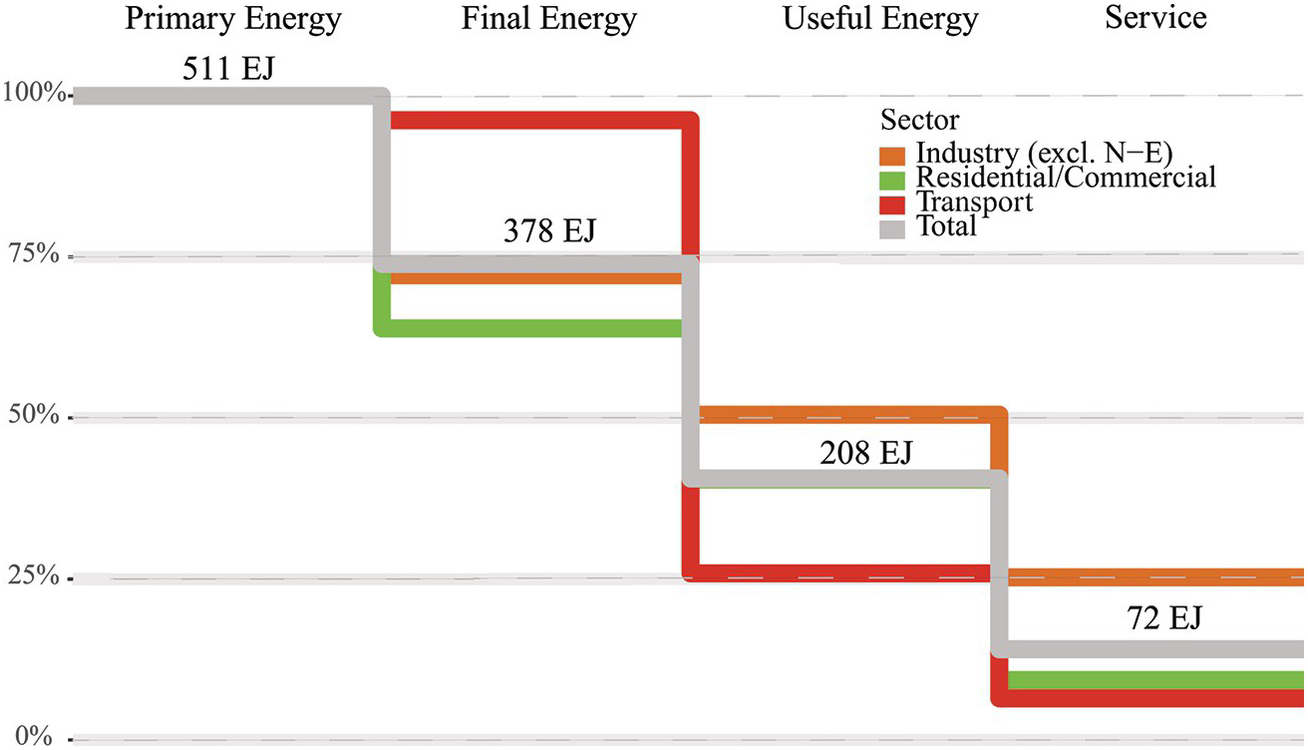
Figure 16.6 Energy conversion cascades in the global energy system. Lines show percentage of extracted primary energy delivered as final energy, useful energy, and services respectively for three end-use sectors (industry, residential and commercial buildings, transport) and totals for the whole energy system in 2020. Energy flows exclude non-energy feedstock uses of energy (labeled as N-E). Total energy flows (EJ) are shown at each stage of the energy conversion cascade. Service efficiencies are first-order (conservative) estimates based on Nakićenović et al. (1990) and Nakićenović et al. (1993).
The world has currently achieved a total global efficiency improvement of about 2 percent per year. But as concluded by the “The World in 2050” team (TWI 2050, 62), all these efforts are quite insufficient to substantively reduce greenhouse gas emissions. As stated by the International Energy Agency (2017): “While carbon emissions have flattened in recent years, the report finds that global energy-related CO2 emissions increase slightly by 2040, but at a slower pace than in last year’s projections. Still, this is far from enough.”
This worrying situation is exacerbated by the fact that the decrease in return on investment in traditional energy capture risks leaving a substantial proportion of the theoretically available (identified) resources in the ground, potentially creating a major financial liability for the institutions that have lent money against those irrecoverable assets (the so-called stranded assets problem). This poses a threat to our current global financial system, as do some of the derived geopolitical risks involved in oil price fluctuations. If countries cannot make enough money on fossil fuels, their political structure becomes unstable (in Venezuela from 2016 to 2019, for example). Moreover, if we continue to reduce global poverty, one can reasonably expect energy needs to continue to grow. For example, in Saudi Arabia the national increase in energy use is such that the country may cease being a net oil exporter by 2032 (Leggett Reference Leggett2014). If we include in the calculations the energy needed to increase the living standard of the whole global population to a level that guarantees a comfortable life (without going into the excesses of the current West), we will clearly exceed all acceptable levels of fossil energy use from an atmospheric pollution perspective because this would almost certainly involve substantive use of coal, which is currently (and will so remain unless major technical innovations change the situation) the worst polluter among the fossil energies. Only renewable energy can avoid this energy squeeze, but though its installation is growing exponentially (it now produces about 20 percent of global energy), that is still not fast enough to compensate for emissions growth from fossil fuel (not to mention land clearance, saturation of the ocean’s absorption capacity, tundra melt leading to methane release, and so forth).
Finance
We can clearly see that in recent years a very important, and growing, proportion of total financial capital is no longer engaged in the production of goods or services, but entirely devoted to what amounts to speculation. Figure 16.7 shows how the proportion of available capital that is subject to capital gains tax and is therefore not productively invested has been increasing in the USA since the late 1940s and has recently in some years constituted close to 40 percent of total financial capital. As such speculative capital moves around with worrying (and increasing) speed, for example between developed and developing countries, but also between sectors, individual institutions, and forms of investment, the basis of our global financial systems is substantially, and increasingly, unstable.
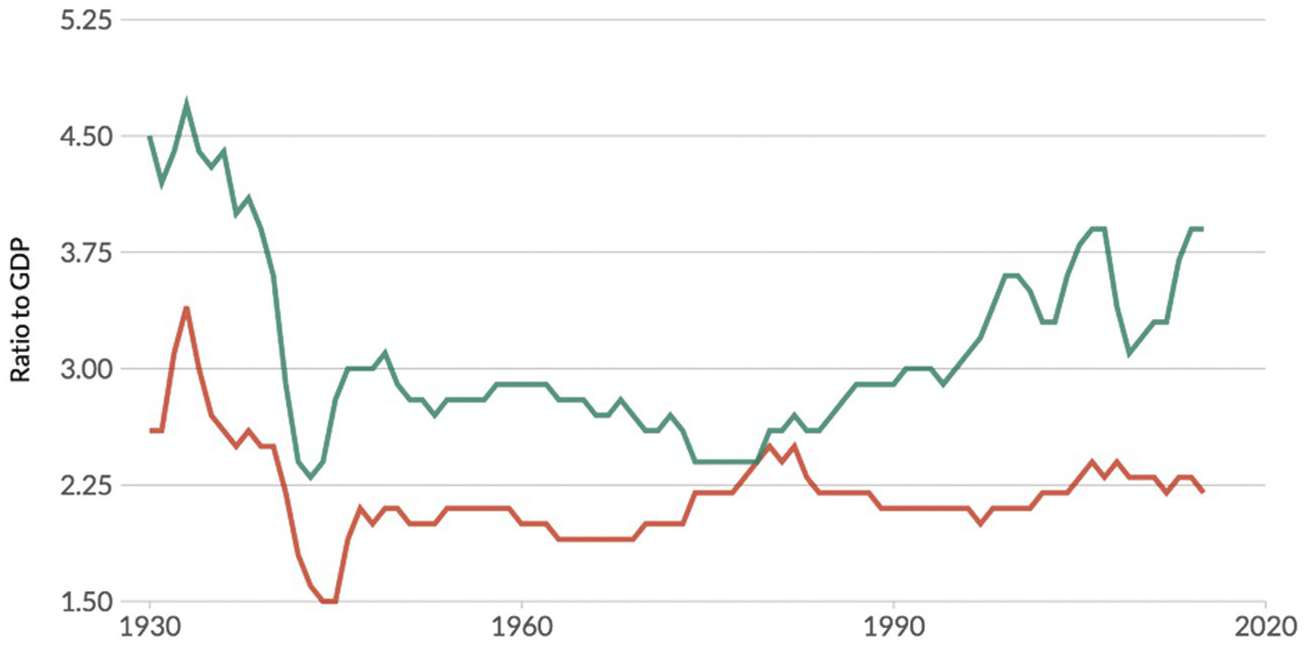
Figure 16.7 Fraction of total gross domestic product (in the USA) invested in production (red line, without capital gains tax) and speculation (green line, with capital gains tax). The global recession of 2008 has depressed both trends, but the relationship is still the same.
The mobility of speculative capital associated with the fact that it is controlled by fewer and fewer people (see below on the “wealth gap”) and institutions (some of which are now considered “too big to fail”) has had the destabilizing effect of contributing to the rapid succession of financial crises that we have seen in the last sixty years (The Economist in 2014 ran the headline “The History of Finance in Five Crises”). There are many different aspects to this trend, but there are several that are so dangerous that we need to include them in our thinking about the future.
Trade, Protectionism, and Investment Flows
Several developed economies are currently moving toward protectionism, under the pretexts of protecting jobs, correcting bilateral trade imbalances, or even national security. This restricts economic growth in the long run, since it inhibits trade in intermediate goods and the creation of value chain niches. It also threatens the existing supply chains in our greatly interwoven global economy. Moreover, the uncertainty produced by the threat of protectionism slows down investment flows in global capital markets, as it generates uncertainty regarding future economic growth (Erokhin Reference Erokhin2017). This is aggravated by trends in international aid, migration, climate change, and geopolitics. Protectionism threatens food sustainability by drastically shifting value chains and forcing replacement of staples and other foods with less sustainable varieties. Trade has a major role in stabilizing food prices, as well as shifting production from areas of high environmental risk to less risky areas (IFPRI 2018). The effects of protectionism in developed countries will be felt most acutely in the least-developed countries (LDCs) (UNDESA et al. 2018). Many LDCs are dependent on external demand for commodity exports, as well as foreign aid for budget support (Timmer et al. Reference Timmer, Dailami, Irving, Hauswald and Masson2011). In a closed world economy, many LDCs will continue to lag behind more developed economies, and this will have important ramifications in other sectors. LDCs will not achieve the economic growth required for sustainable development without a significant increase in investment. However, many of these countries are unable to attract the levels of investment they require owing to institutional deficiencies, an overdependence on commodities subject to fluctuation in prices, and a dearth of basic infrastructure to support fledgling industries.
Debt
The rapid increase in global indebtedness (see Figure 16.8) is directly threatening overall financial and economic stability. Nominal global debt is currently around 250 percent of gross domestic product (GDP). This includes both government and private debt, and the percentage has been rising for most of the last fifty years, after a major deleveraging phase immediately following World War II. This debt is unevenly distributed among countries, and also between public and private debt, with the latter generally growing faster than the former. As long as the world is – and most countries are – on a growth trajectory this is not necessarily a financial problem, as people have enough confidence that much of this debt will in the end be reimbursed, and because inflation reduces the real debt load.
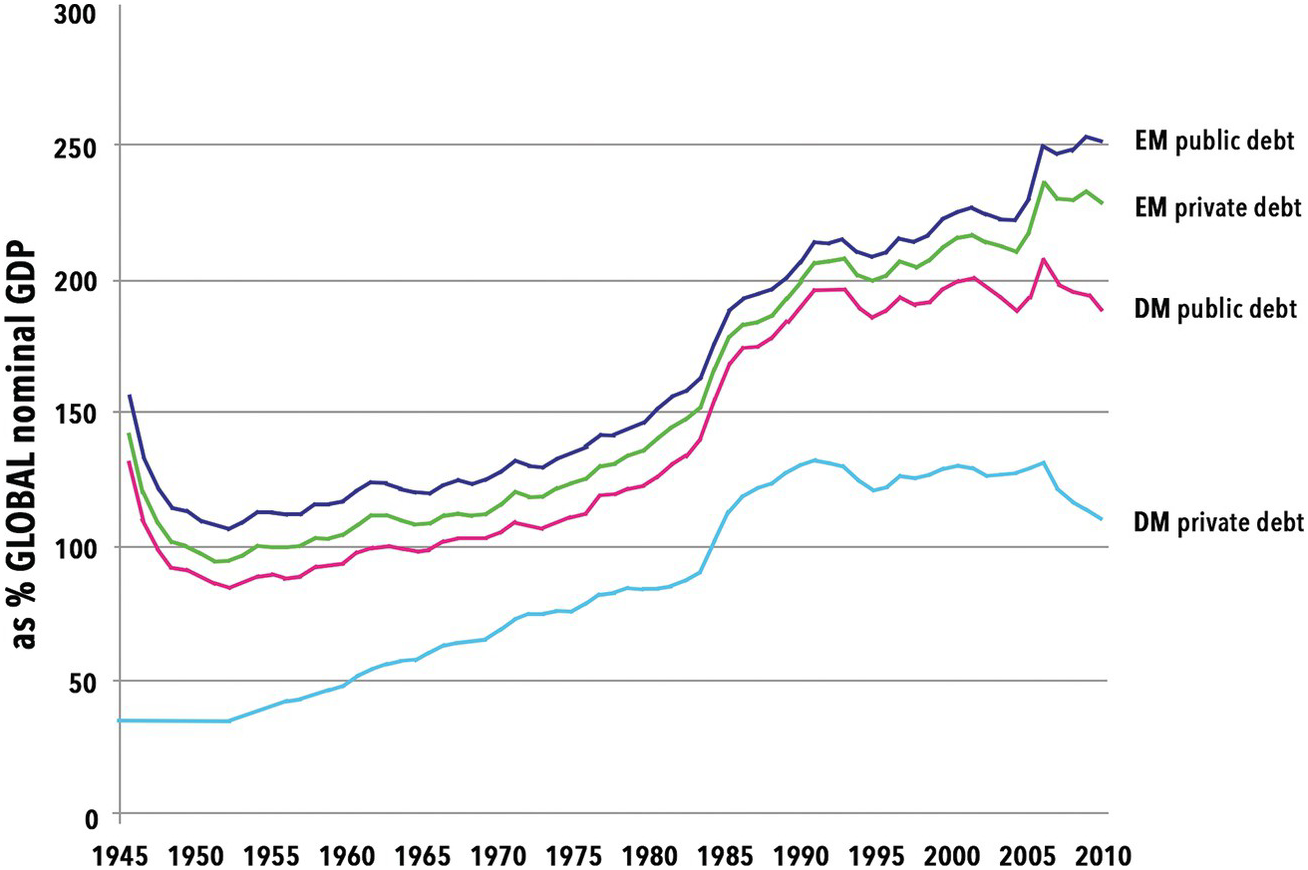
Figure 16.8 Private debt in developed and developing countries exceeds public debt.
We have to remember, though, that this whole system is fiduciary, and that if trust in it is for some reason or other undermined it could collapse very easily, leading to major social unrest. As we saw in the 2007–2008 Great Recession, there are many hair triggers that may cause such a collapse. And because each crisis is countered by central banks with an increase in their debt levels, the underlying instability increases with each such event (Figure 16.9).
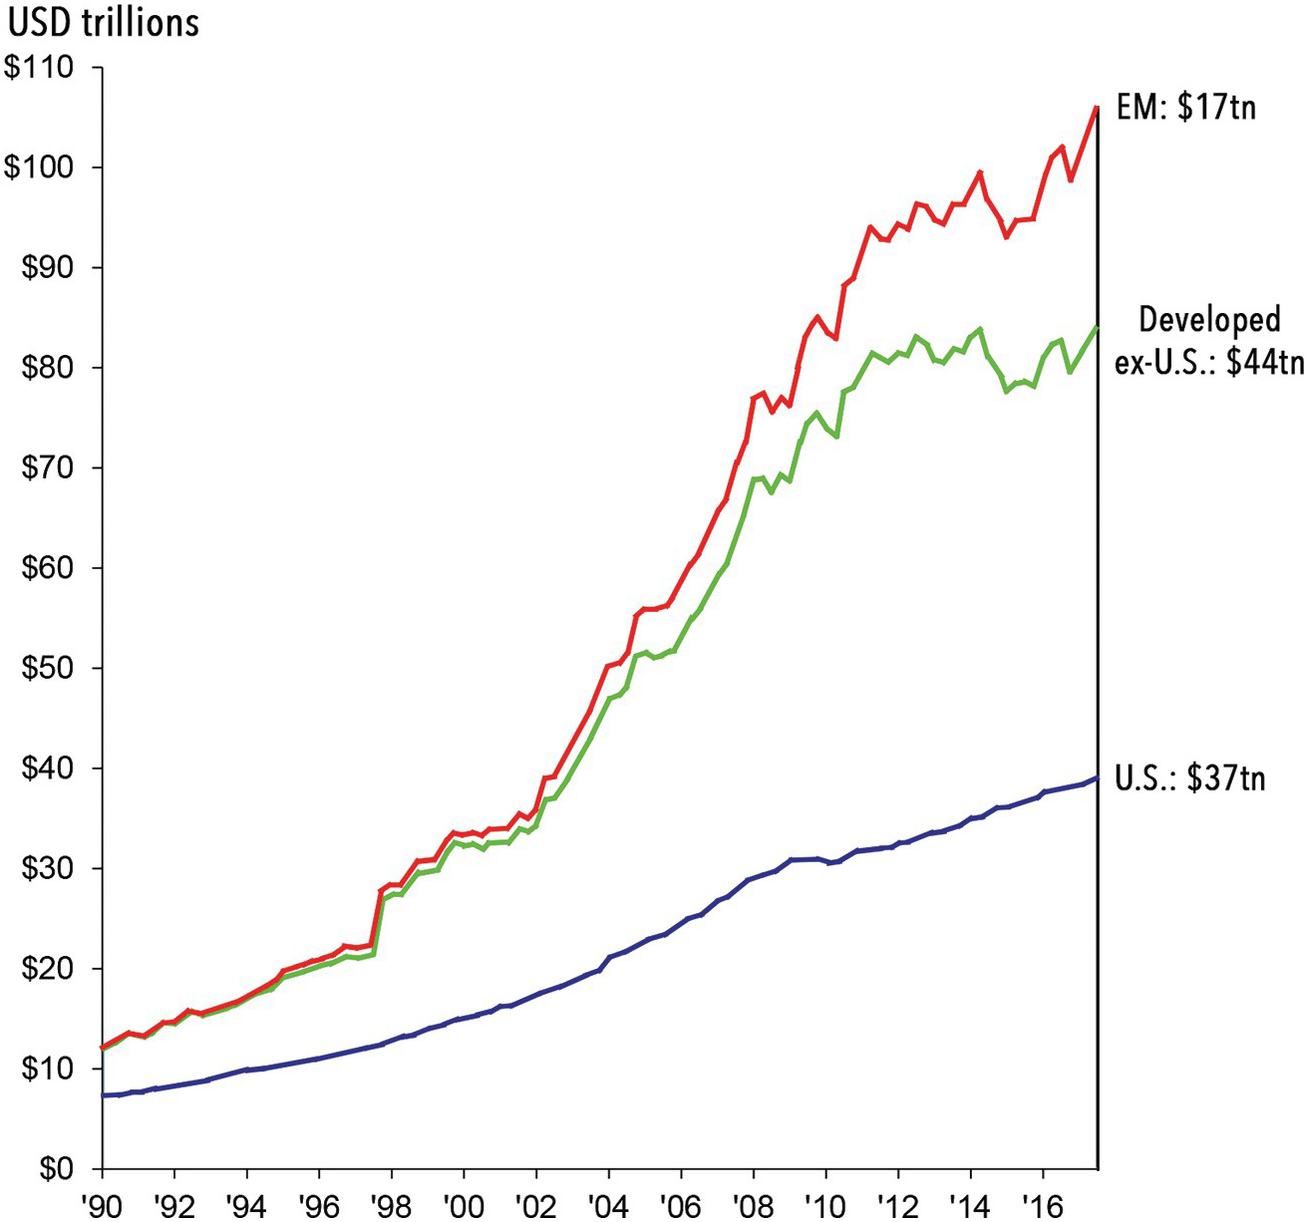
Figure 16.9 Public debt in the USA, other developed countries, and emerging markets. After the 2007 debt crisis, public debt increased rapidly, to level off (except in the USA) after 2010.
In recent years, we have also seen how several individual nations have seen trust in their financial systems collapse owing to mismanagement or actual cheating (Argentina, Greece, Ireland, Turkey).
That is not affecting world financial stability as long as there are other economies that can serve as lenders of last resort because they are bigger and in better shape. However, with the overall increase in debt level among both large and small countries this mechanism may itself be at risk.
Another aspect of the high debt level is the fact that an ever-larger percentage of GDP is devoted, by governments and individuals, to interest payments, which reduces the proportion of GDP that is available for spending. There is thus an incentive to promote a feedback spiral, increasing the debt to be able to both spend as necessary and pay the interest owed.
Ultimately, this may hit the total amount of funds available for investment and lead to reductions, notably, in infrastructure maintenance (as is currently occurring in a number of developed countries). In certain cases, this problem may even limit the potential for further investment in the expansion of productive capacity.
It is easy to see that the information revolution, which has reduced transaction times to milliseconds, and which has linked all financial markets in one large web, contributes further to the potential instability of the global system as a whole.
Aging Populations, Productivity, Savings, Debt, and Pension Systems
I have already mentioned that a major demographic trend is the aging of populations. It has tremendous economic implications that represent a challenge for the sustainability of welfare systems in developed and developing economies. This includes pension and healthcare systems, in addition to a possible decrease in savings and investments (Bosworth et al. Reference Bosworth, Bryant and Burtless2004). In developed countries, an increased burden will be placed on public transfer systems, owing to the concurrent trends of a growing proportion of pensioners and a diminished tax base. However, the majority of the increase in the population above the age of sixty will occur in the Global South (UNDESA 2017), where the elderly are less likely to have retirement savings plans or to be supported by public welfare systems, and instead depend on assets and labor income. Without the means to support themselves in retirement, many of these people are susceptible to poverty. An aging world population also means that the share of non-communicable diseases in the global disease burden will grow, increasing pressure on countries’ health expenditure, adding to the fiscal burden of government budgets.
Low productivity growth in developed economies in recent years has been explained by aging workforces, a slowdown in total factor productivity in the information and communications technology (ICT) sector, declining contributions of trade to economic growth, and stagnation in levels of educational attainment (Adler et al. Reference Adler, Duval, Furceri, Sinem, Koloskova and Poplawski-Ribeiro2017). Between countries, global inequality has decreased in the last decade thanks to the contribution of China and India in their economic development process. As these and other emerging markets continue to grow, the economic hegemony of the United States and its western allies will gradually be replaced by a multipolar world economy, in which India, China, Indonesia, and Brazil become increasingly important economic hubs for financial services, manufacturing, and innovation (Timmer et al. Reference Timmer, Dailami, Irving, Hauswald and Masson2011).
However, this trend does not mean that economic growth will be evenly distributed. Many LDCs are at risk of continued vulnerability to economic shocks for the reasons previously mentioned. Their economic vulnerability is compounded by the fact that many of the LDCs are facing disproportionately high threats from climate change, have rapidly growing populations, and also have weak governments and vulnerable security situations. These trends are inhibiting the ability of LDCs to bridge the gap between themselves and the emerging and developed economies. Without appropriate economic growth and investment, their populations may continue to grow at unsustainable rates, they will not be able to provide adequate education to their youth, and the coverage of health services will remain incomplete and fail to tackle preventable causes of morbidity and mortality (UNDESA 2018).
Innovation and Societal Coherence
The societal implications of the innovation challenge, though major, are much less clearly perceived, and have probably differed across cultures and societies. In the case of the west, I mentioned in Chapter 12 that Girard (Reference Girard1990) argues cogently that between the seventeenth and the twentieth century, society’s perspective has shifted from one directed toward the past and therefore encouraging stability (“the future is more of the present”) to one that favors change and innovation. That is a fundamental change in our (western) values, and should not blind us to the fact that for many societies change may not have been a fundamental value.
Nevertheless, any society will ultimately lose coherence unless its members continue to see an advantage in being a member of the society (van der Leeuw Reference van der Leeuw, Costanza, Graumlich and Steffen2007). This means that the society must maintain a sense of comfort among its members. I would argue that over long-term time, even if ever so infrequently, some degree of innovation is necessary, because when societies reach tipping points in their dynamics, innovation is called upon.
Whether in the material and technical realm or in the socioeconomic one, every innovation requires energy for implementation, whether it is to change the structure of institutions, to change collective behavior, or to create or modify infrastructure. One of the consequences of the harnessing of fossil energy after 1750 has been that, for a considerable amount of time, it was relatively cheap in energy terms to innovate. We have therefore, over the last 250 years, seen an ever-accelerating spate of innovation in the material and technological realms, which has globally brought with it an important population growth (especially in the last seventy years), an emphasis on “progress,” an increase in life expectancy in many places, and a huge increase in trade leading to globalization. It is difficult to point to specific single causes for this very complex coevolution, but one argument that has a certain ring to it is that these phenomena are part of the ideology that capitalism (initially industrial, more recently financial) has developed to ensure profits through growth. I return to this topic in Chapter 18.
Whether this process can continue at a sufficient rate to keep our current societal institutions intact will of course in part depend on whether we continue to meet our society’s growing innovation needs. But there are some early signs that this is not as self-evident as some think.
One observes in the USA an overall decrease in return on invested capital (Figure 16.10) as well as a decline in entrepreneurship (Figure 16.11), which might be linked to an overall decline in the frequency of major innovations.
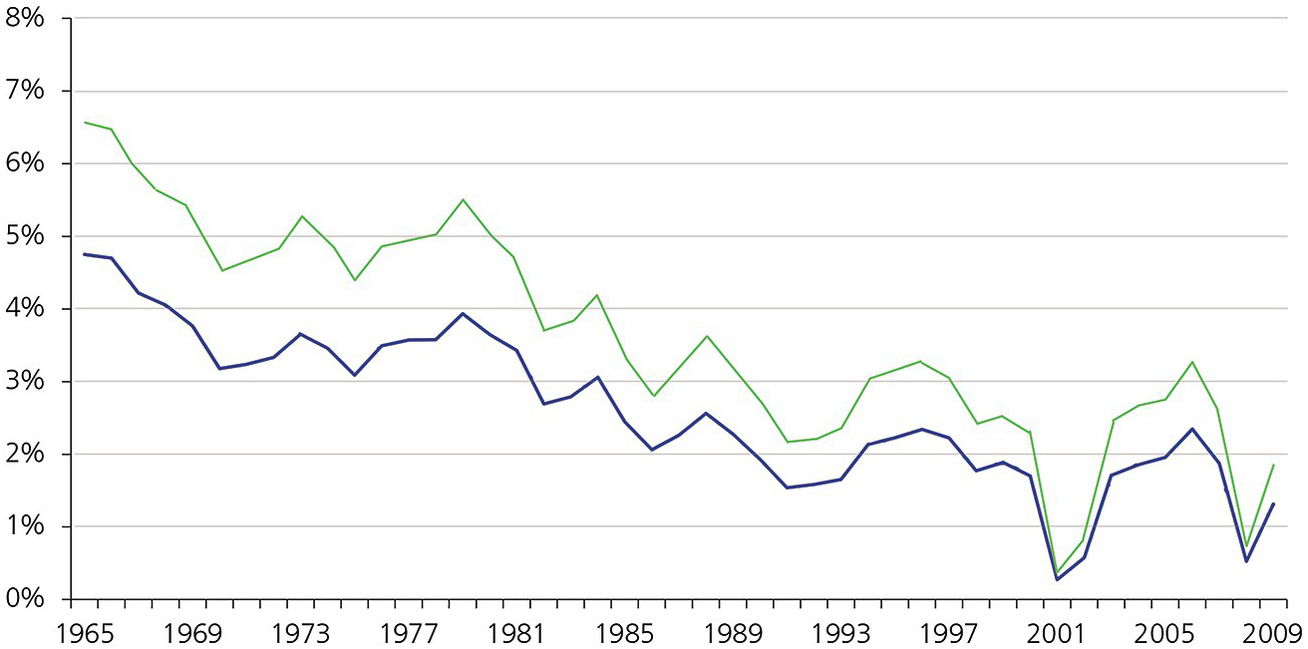
Figure 16.10 Evolution in return on invested capital in the USA, 1965–2011. The blue line represents the evolution of return on assets; the green line that of return on investment.
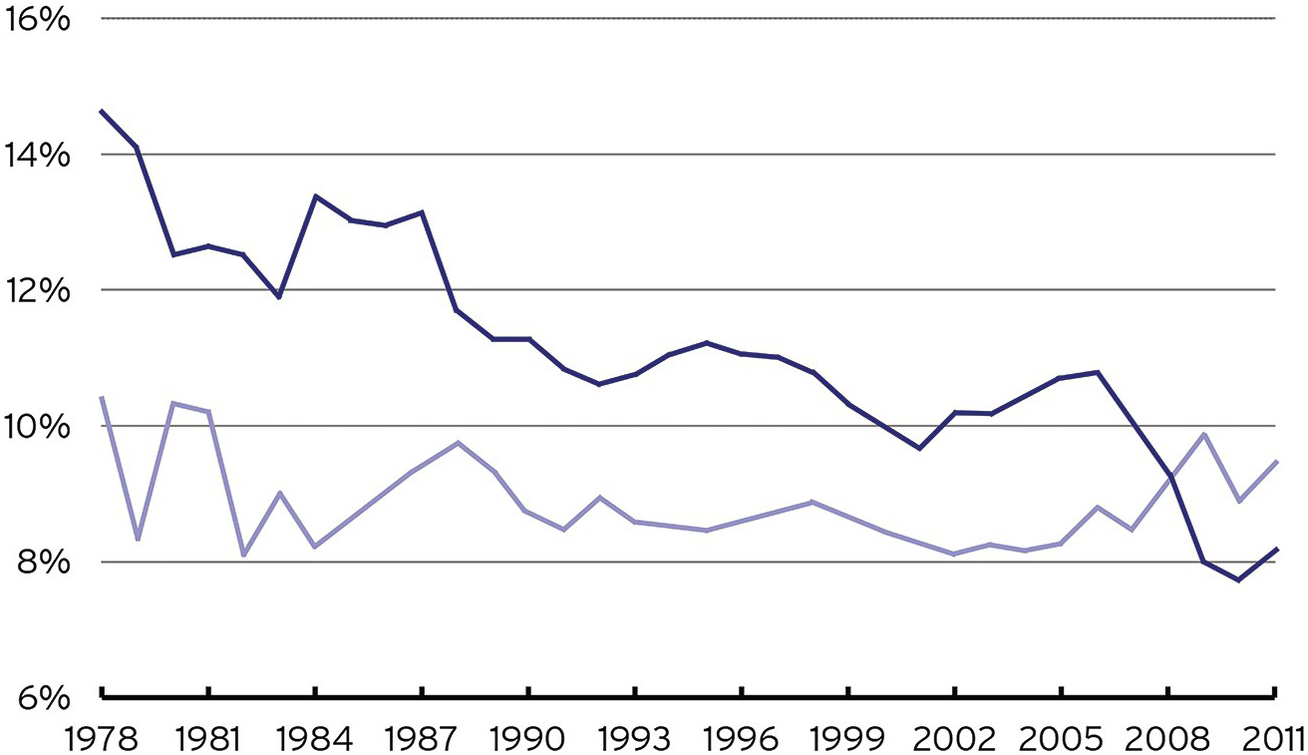
Figure 16.11 Annual new firm creations (dark blue line) and existing firm deaths (light blue line).
If we offset the number of patents per innovator against the growth in size of the teams involved in an innovation, we see that innovation involves more and more domains, and becomes more and more difficult and costly. Research on the wealth created by innovations registered at the US Patent and Trademark Office seems to point to the fact that, in terms of the return on investment on such innovations, their impact on the economy is slowing down (Strumsky & Lobo Reference Strumsky and Lobo2015). This may be because the explosion of patents over the last fifty years has made it more and more difficult to come up with something that is so new that it sets an innovation cascade in motion within or outside our current technologies. Another contributing factor could be that the shift toward short-termism in many industries makes it more difficult to develop innovations with long loss leaders. But there may be a more fundamental reason for this: has our value space (the total set of dimensions to which we accord economic value) reached a limit? I will return to this point in Chapter 17.
Wealth Discrepancy
The global economy has created excessive material wealth differentials by concentrating most such material wealth in the hands of a relatively small, if growing, proportion of the world’s population, almost entirely in the developed countries (Figure 16.12). This causes a steepening of the wealth disparities within and between countries in another very long-term deep trend, as analyzed recently by Scheidel (Reference Scheidel2017), which is very difficult to invert, as his many case studies show.
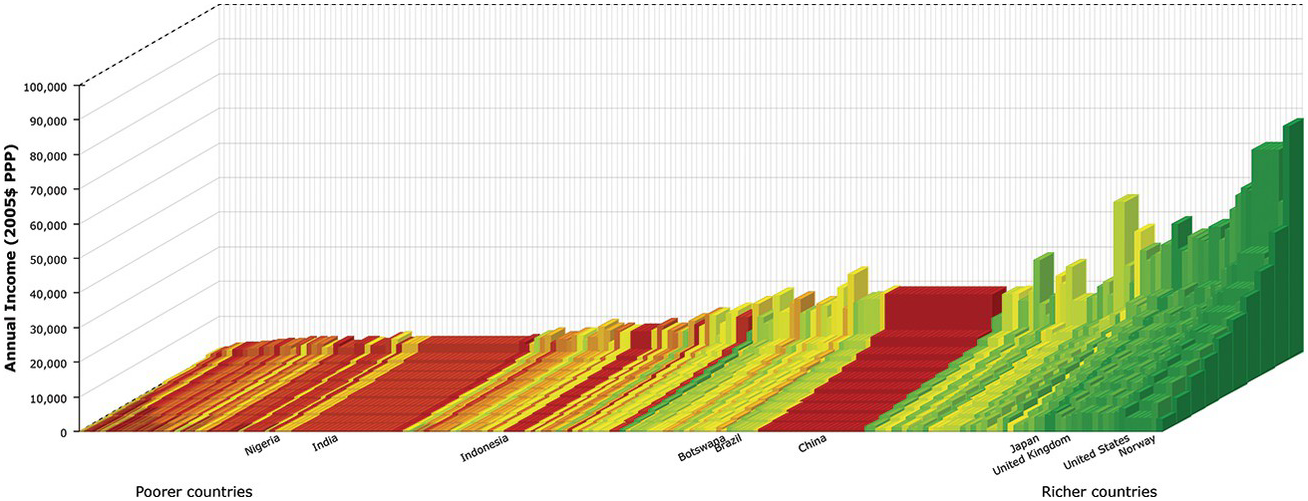
Figure 16.12 Worldwide differences in wealth distribution
Recently, we observe two opposing trends in this dynamic: a leveling off of wealth disparities between developed and developing nations and an increase of wealth disparities within many countries. This is the statistical effect of the rich becoming richer in the developing countries (especially the BRICS countries), while within these countries – as well as in the developed world – the contrast between rich and poor becomes starker.
Recent publications, e.g., Piketty Reference Piketty, Saez and Stantcheva2013,2 have been drawing worldwide attention to this phenomenon, which some see as an early warning sign of major social adjustments – in the developed nations as a protest against the squeeze of the middle classes, and in developing nations as a revolution of rising expectations triggered by the fact that a small proportion of the population is getting (very) rich.
As is now discussed both in academia and in politics, the growing wealth discrepancy seems a manifest case of a societal planetary boundary that we are approaching, or have already crossed. Hence, I will use this section to discuss it at some length. To illustrate the scope of the phenomenon, I will present some statistics.3 In doing so, I use the USA and Europe as examples because there are much better data for the wealth gap here than in many other countries.
Particularly since the 1940s, income inequality in the USA has spectacularly risen, from a situation in which 90 percent of the population collectively made about 66 percent of total US income and the top 10 percent about 33 percent. At the beginning of the 1980s that trend was dramatically inverted, coinciding all too closely with the “big bang” in the New York stock exchange, a major deregulation under the Reagan government. In 2012, the top 10 percent of the population received about half the income of the USA.
Figure 16.13 compares the Anglo-Saxon world with that of continental Europe, and shows how the “big bang” of the 1980s has hugely increased the wealth gap in the English-speaking world, but much less so in (continental) Europe. The most important lesson to learn from these differences in policy between continental Europe and the Anglo-Saxon world is the fact that, indeed, governments do shape markets (Mazzucato 2016), and should be regulating them if they want to preserve social peace. If they abandon that role, and important parts of the population grow apart, they are in for trouble. But of course, part of the responsibility for such growing apart rests upon the voters.
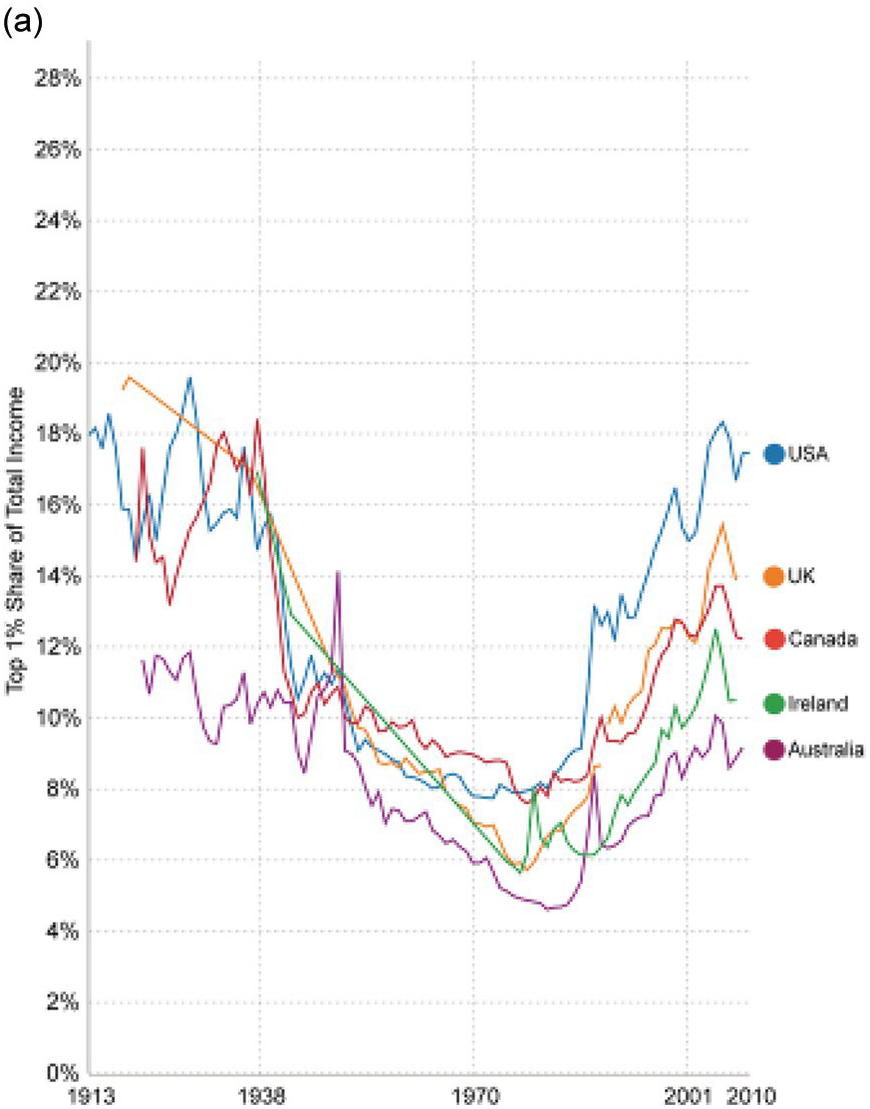
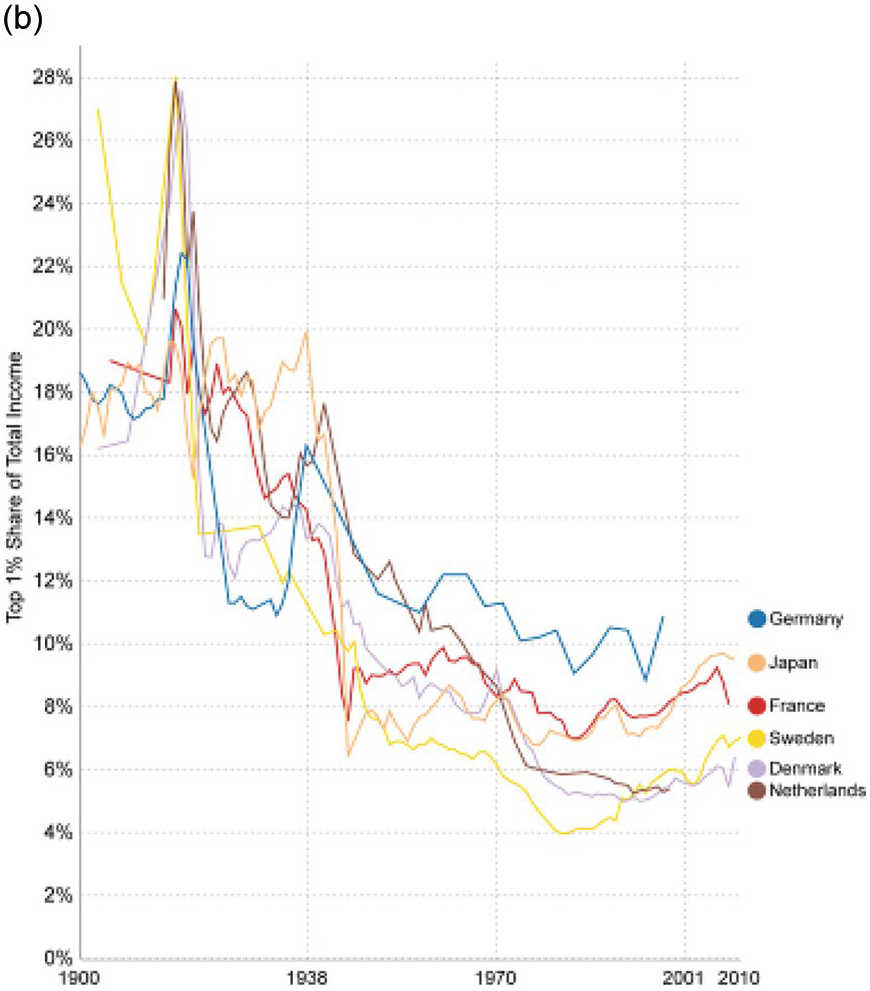
Figure 16.13 The 1980s “big boom” in financial regulation has inverted the reduction of inequality in the English-speaking world, but at least until 2010 not in other parts of Europe.
In the literature, the widening wealth gap in the USA is related to the relative decrease of manufacture – which provided good salaries for production personnel in factories – owing to automation and outsourcing in the developing world. But it is also the case that with the increased reliance of industry and services on automation and ICT, large parts of the economy in developed countries require higher levels of education to deal with more and more complex tasks. This is a dramatic development that will over time pose major challenges to all governments. They will have to find a solution for the large numbers of undereducated, unemployable people that this trend is likely to generate in the next couple of decades. Improving general education, from the primary and secondary school levels to universities, can profit from ICT to drive down the cost of education, but it urgently requires the review of the contents and skills, as well as the ways in which they are acquired. Recent studies argue for a major revision in favor of promoting student-directed learning (Ito and Howe Reference Ito and Howe2016; see also Chapter 4).
The productivity increase has generally not been used to reward the median family in these countries. Automation, offshoring to countries with lower wage levels, as well as the 2008–2010 economic crisis are among the responsible factors. The extra profits have generally gone to major corporations and the rich and super-rich segment of the population – in the USA most extremely owing to the tax system bias, of which Warren Buffett (one of the richest US citizens) famously said (in 2012) that he pays a smaller proportion of his income in taxes (17.4 percent) than his secretary (35.8 percent). It is only in 2018 that tension in the labor market is beginning to force companies in that country to pay higher wages.
If we look at the evolution of wealth globally (see Figure 16.14), the so-called elephant curve (Lakner & Milanovic Reference Lakner and Milanovic2013), representing the growth in average household income of each percentile group worldwide between 1988 and 2008, we see the combined effect of three trends: (1) rapid and substantive income growth for the poorest part of the world population, especially in some developing countries, but starting from a very low base, (2) absent or low income growth for the middle classes in the developed countries, and (3) rapid growth for the richest people in the developed and some developing countries (notably China). Corlett (Reference Corlett2003) shows that differences between countries’ population growth rates and the selection of countries included in the statistics (notably Russia, Japan, and China) accentuates some of the contrasts, but this does not fundamentally change the picture that the middle classes in developed countries have not seen any increase in real income in this period.
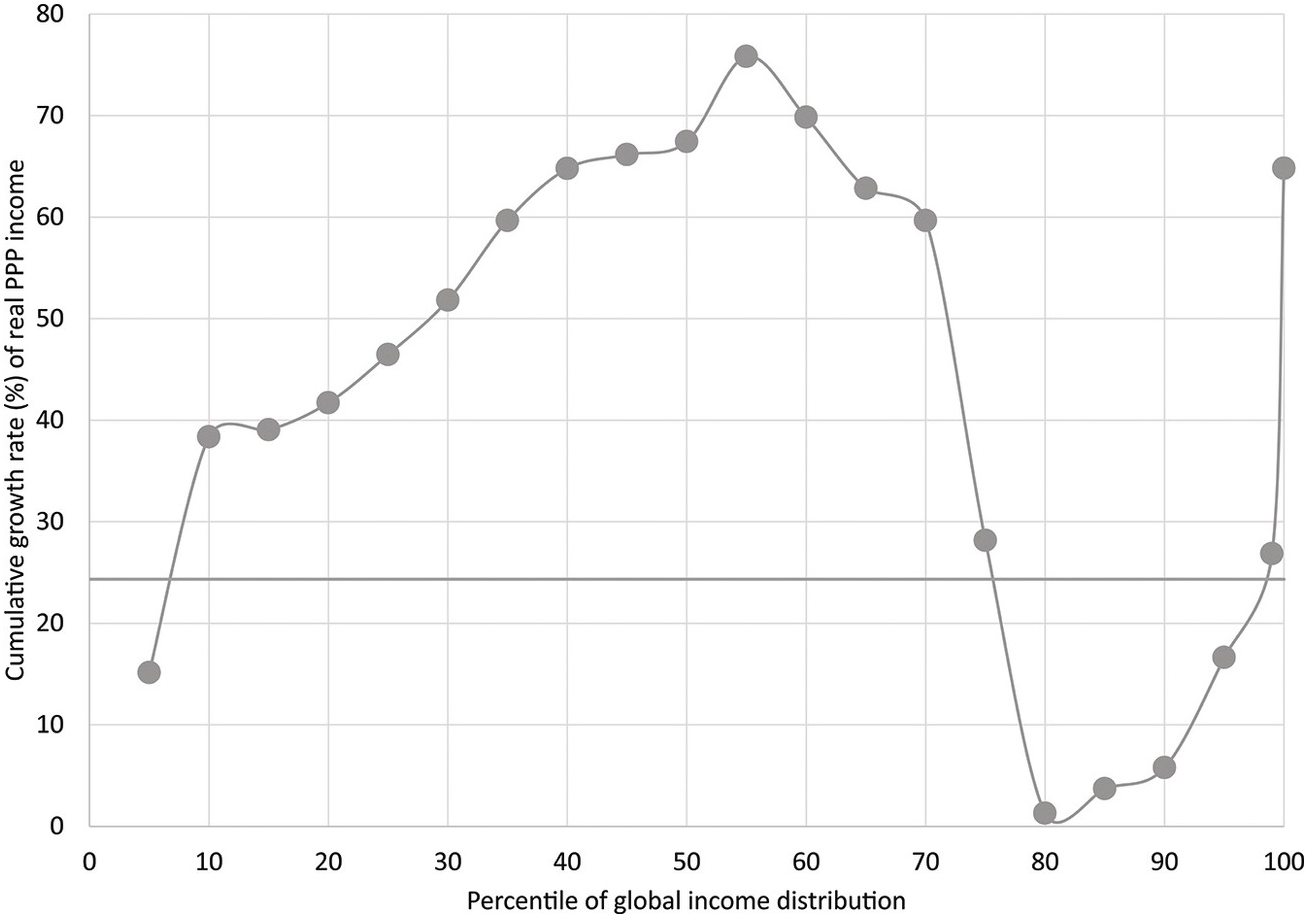
Figure 16.14 Global growth incidence curve, 1988–2008. One sees that below the tenth percentile incomes have grown very strongly, while incomes between the tenth and the fiftieth percentile incomes have grown substantially, whereas from the fiftieth percentile to the eightieth incomes have substantially declined. From the eightieth to the ninety-fifth they have grown some, and beyond the ninety-fifth they have grown exponentially.
Turning now from the phenomenon and some of its causes to some of its consequences, we can look at Figure 16.15, which shows the relationship, in a number of countries, between energy use (as a proxy for wealth) and a composite metric, social progress. This indicator combines life expectancy, education (as measured by proficiency in mathematics and literacy), infant mortality, homicides, imprisonment, teenage births, obesity, mental illness, social mobility, and drug and alcohol addiction. The relationship is quite convincing.
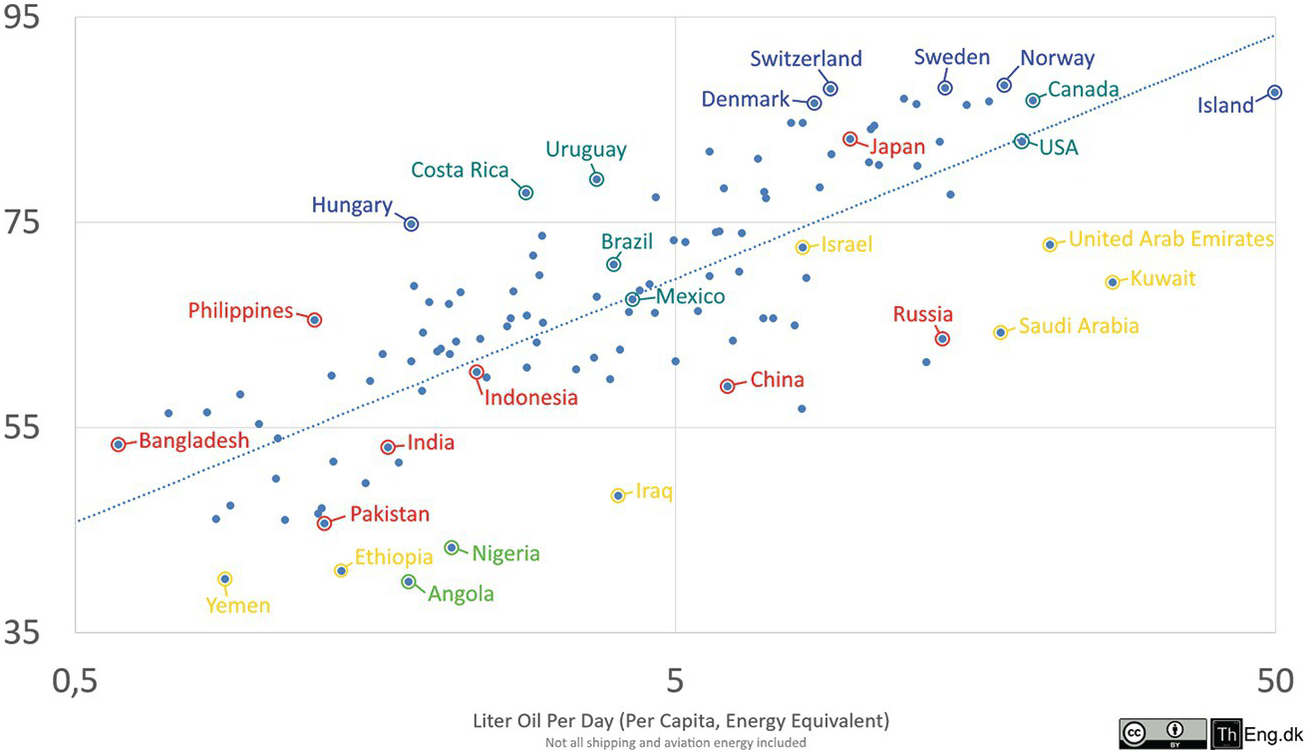
Figure 16.15 Social Progress Index vs. energy per country.
I conclude by repeating that the growing wealth discrepancy seems a manifest case of a societal planetary boundary that we are approaching or have already crossed. Some see it as an early warning sign of major social adjustments – in the developed nations as a protest against the squeeze of the middle classes, and in developing nations as a revolution of rising expectations triggered by the fact that a small proportion of the population is getting (very) rich.
Urbanization
We should include in this series of stresses that current global societies are undergoing the very rapid increase of urbanization. Urbanization is one of the major drivers of societal and environmental change and is a major topic of discussion in the sustainability context (Seto et al. Reference Seto, Güneralp and Hutyra2012, Reference Seto, Golden, Alberti and Turner2017). It is in effect the most long-standing materially observable societal transformation that we know, as it originated around 6,000 years ago. Current projections of the growth of urbanization seem to indicate that by 2050, 68 percent of the global population will live in cities (UNDESA 2018). However, it is not clear that such linear projections are trustworthy, as there are a number of factors (high institutional vulnerability, rising transport costs owing to climate change, food security, and potential changes in governance structure) that may force the drivers of urbanization in a different direction.
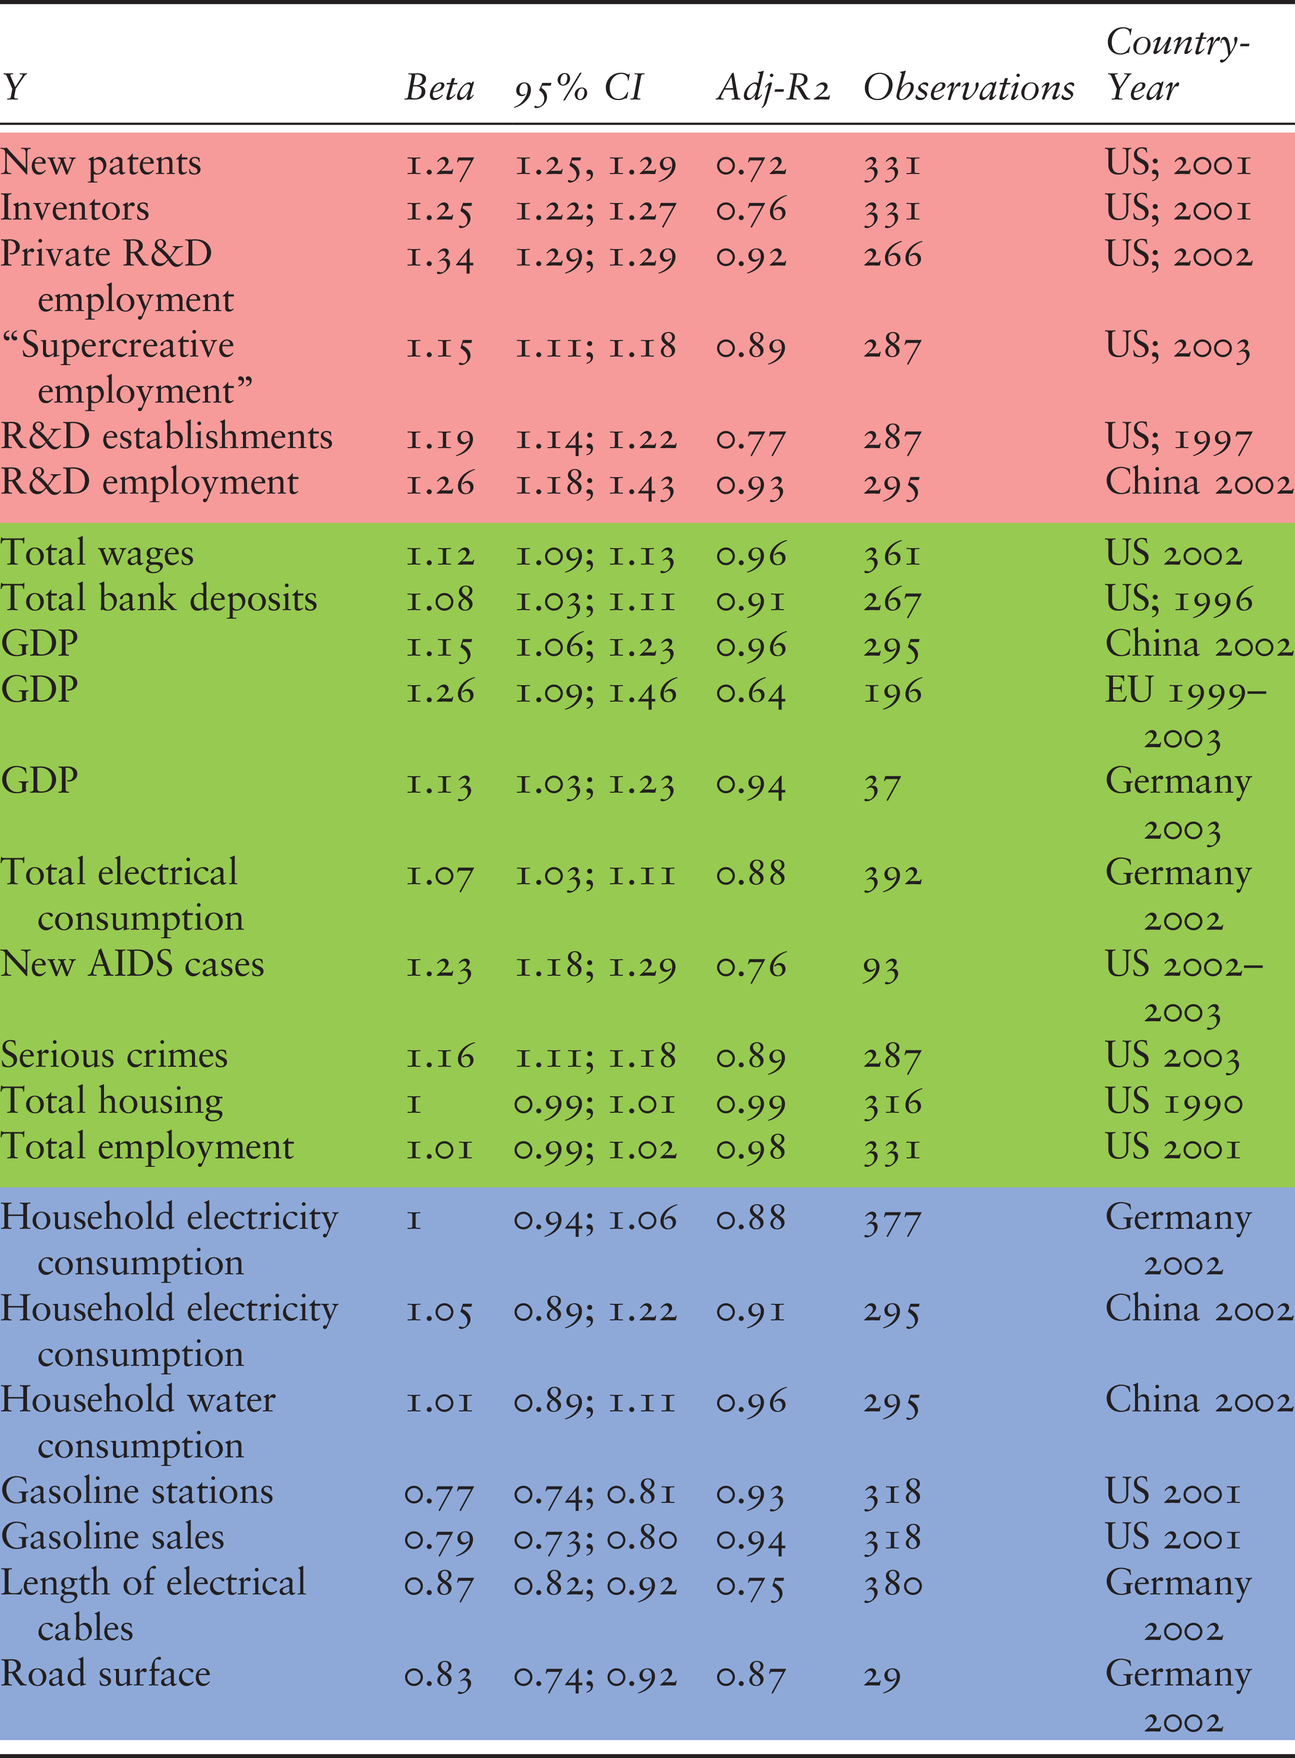
Although there are possibly as many explanations for the existence of towns as there are towns (Jacobs Reference Jacobs1961), one recent approach, proposed by Bettencourt et al. (Reference Bettencourt, Lobo, Helbing, Kühnert and West2007) and Bettencourt (Reference Bettencourt2013) relates their existence and many of their features to societal information processing. Based on allometric scaling analyses, it argues that there is a direct relationship between innovation and urban scale, expressed by the fact that with urban scale (as expressed in population numbers), innovation activities grow superlinearly while energy use grows sublinearly (Table 16.1). Population and services, scale, of course, linearly. The authors argue on this basis that while energy is a constraint in the growth of urbanization, information processing, and innovation in particular, is its driver (see also Florida 2014). That would explain why the explosion of urbanization and that of material innovations have gone hand in hand to drive our consumption society to its current heights.
Table 16.1 Allometric scaling relationship between innovation processing (research and its results, in red), population size (in green), and energy use (in blue). All metrics concerning the creative professions scale superlinearly (around 1.25), those related to the size of the population scale linearly (around 1.00), and those related to energy consumption scale sublinearly (around 0.80). The others are either summations (wages, bank deposits, GDP, electrical consumption, etc.) or less dependent (AIDS, crime) upon any of these three categories.
| Y | Beta | 95% CI | Adj-R2 | Observations | Country-Year |
|---|---|---|---|---|---|
| New patents | 1.27 | 1.25, 1.29 | 0.72 | 331 | US; 2001 |
| Inventors | 1.25 | 1.22; 1.27 | 0.76 | 331 | US; 2001 |
| Private R&D employment | 1.34 | 1.29; 1.29 | 0.92 | 266 | US; 2002 |
| “Supercreative employment” | 1.15 | 1.11; 1.18 | 0.89 | 287 | US; 2003 |
| R&D establishments | 1.19 | 1.14; 1.22 | 0.77 | 287 | US; 1997 |
| R&D employment | 1.26 | 1.18; 1.43 | 0.93 | 295 | China 2002 |
| Total wages | 1.12 | 1.09; 1.13 | 0.96 | 361 | US 2002 |
| Total bank deposits | 1.08 | 1.03; 1.11 | 0.91 | 267 | US; 1996 |
| GDP | 1.15 | 1.06; 1.23 | 0.96 | 295 | China 2002 |
| GDP | 1.26 | 1.09; 1.46 | 0.64 | 196 | EU 1999–2003 |
| GDP | 1.13 | 1.03; 1.23 | 0.94 | 37 | Germany 2003 |
| Total electrical consumption | 1.07 | 1.03; 1.11 | 0.88 | 392 | Germany 2002 |
| New AIDS cases | 1.23 | 1.18; 1.29 | 0.76 | 93 | US 2002–2003 |
| Serious crimes | 1.16 | 1.11; 1.18 | 0.89 | 287 | US 2003 |
| Total housing | 1 | 0.99; 1.01 | 0.99 | 316 | US 1990 |
| Total employment | 1.01 | 0.99; 1.02 | 0.98 | 331 | US 2001 |
| Household electricity consumption | 1 | 0.94; 1.06 | 0.88 | 377 | Germany 2002 |
| Household electricity consumption | 1.05 | 0.89; 1.22 | 0.91 | 295 | China 2002 |
| Household water consumption | 1.01 | 0.89; 1.11 | 0.96 | 295 | China 2002 |
| Gasoline stations | 0.77 | 0.74; 0.81 | 0.93 | 318 | US 2001 |
| Gasoline sales | 0.79 | 0.73; 0.80 | 0.94 | 318 | US 2001 |
| Length of electrical cables | 0.87 | 0.82; 0.92 | 0.75 | 380 | Germany 2002 |
| Road surface | 0.83 | 0.74; 0.92 | 0.87 | 29 | Germany 2002 |
That has created a number of major stresses for the urban component of the global system dynamics (UNDESA 2018). Urban systems are costly and highly vulnerable both socially and environmentally. As can be seen in many developing parts of the world, economic inequality, crime, food insecurity, and lack of hygiene all abound in urban systems unless very costly social and infrastructural measures are put in place. The growth of urban systems has hugely increased the (energy-costly) worldwide flows of goods, including foodstuffs and water, as well as an increasingly wide range of other products across the world. It has thus exploded the footprint of the global urban population. The growth of urbanization should also be seen in the perspective of the rural depopulation that is occurring, or has recently occurred, in many parts of the world, uprooting communities, transforming landscapes, and industrializing agricultural production methods in developed and developing areas.
One of the fundamental questions of capital importance for sustainability in all domains of human endeavor is therefore whether the current trend toward further urbanization will continue as is assumed by the linear projections of our current “business-as-usual” scenarios. In view of our assumption that the need for increased communication has over the long term been one of the major drivers of urbanization, it will be particularly interesting to see how the changes wrought by the ICT revolution will affect global urbanization. For some, this may imply that urbanization is at the core of the tensions our world is seeing. But it seems to me that it is merely one of the many manifestations of the fact that our current mode of life (in the developed countries in particular) is butting up against planetary social boundaries.
Globalization
Another long-term trend that we will need to include in our thinking is globalization itself. For five centuries, the European (and later the western) socioeconomic system has spread across the world. Initially this occurred through trade (1500–1800), then (1800–1945) through military and administrative exploitation, and since World War II in the form of economic colonization. But since World War II a countertrend has also been visible, in which colonies gain independence, find their economic footing, and gain self-confidence (in part through learning from developed countries). Now the Euro-American sphere is coming under increasing political and economic pressure. The rise in importance of the BRICS countries is a sign of this; it is bound to be a source of uncertainty for the coming fifty years or so while the world searches for a new political organization. I will discuss ICT’s role in this shift in Chapter 17.
An important underlying trend is that a reduction in the dimensionality of metrics (and awareness) of human wellbeing has emerged. Different cultures and populations have been aligned around the dimension of wealth (GDP) as the one by which they compare themselves and transact exchanges.
Other dimensions such as religion, community solidarity, art, and culture have been decreasing in importance as drivers of decision-making except among focused subsets of societies. This in turn has increased the emphasis on wealth, productivity, and growth, and led to the overexploitation of natural and social capital in many regions.
Current populist movements find their origins at least in part in the need to rediscover those multidimensional communal value sets, as was finely analyzed by Karl Polanyi (Reference Polanyi1944) and members of his school in anthropology (e.g., Graeber Reference Graeber2001; Munck Reference Munck2004). Elites have been able to make the transition toward a globalized society, whereas a very large majority of citizens worldwide has been left behind, focused on their local community and thus resistant to expanding the spatial sphere of their identity. This has shaped another deep (second order) field of tension that will inevitably play a major role in structuring our world over coming decades.
Summary
To summarize, there are a number of indicators that point to the fact that some of the resources, both natural and human, on which our western societies and economies of the last couple of centuries have been based are no longer amply available, and that this is, or will soon be, causing stresses in the planetary societal system. Are our societies currently moving toward a tipping point that will, whether we like it or not, force them to introduce major structural changes in the way they are organized? Changes of a scale and scope that we have not seen for centuries because our societies are close to exceeding the boundaries of a societal safe operating space? In this chapter, I have mentioned some of the phenomena that point in that direction. As in the case of the environmental planetary boundaries, the inherent major risk is that the different kinds of societal dynamics described will ultimately come to interact in such a way that they will destabilize the current global order. It is therefore fundamental that we no longer look at these different aspects of the current situation in isolation, but as a complex of interrelated factors.
In that light, it is in my opinion a great pity that the world’s attention has so far increasingly been focused on CO2 emissions, greenhouse gases, and climate change. Though that is, evidently, an important aspect of what is going on in the Earth system, it is only one aspect, and dealing with it in isolation, however difficult that proves to be, will not fundamentally change the socioenvironmental dynamics in which we find ourselves globally.
This is not the first time that humanity has faced such a challenge. Looking back some 10,000 years, there have been at least two other moments in (relatively) recent human history where such very fundamental transitions have occurred: the emergence of sedentary, cultivating societies around 9,000 BP and the emergence of urban societies around 5,000 BP. In principle, therefore, humans are able to collectively make such major structural changes in their social organization. However, in both cases this occurred in the absence of a threat to stability at a global scale, and in both cases the changes took considerable time (centuries, if not millennia). Will the acceleration of innovation that has been triggered by the exploitation of fossil energy, together with the accelerating effect of the ICT revolution, enable us to reduce the time needed for such structural social change to the extent that we avoid disaster? To answer this, I need first to present my perspective on the causes of the emerging crisis.
A Complex Adaptive Systems Perspective on “Crises”
Let me now try to conceptualize the concept of crisis that I have introduced as an important dynamic. The study of crises has led to many descriptive publications, case studies, and doomsday hypotheses, from Gibbon (Reference Gibbon1776–1788) and Spengler (Reference Spengler and German1918) to Diamond (Reference Diamond2005), but it is only in recent years that elements of a more general scientific theory of socioenvironmental dynamics, including societal crises or even societal collapse, are emerging, combining insights from four research domains. The natural sciences have contributed to the set of ideas that is sometimes called the science (or theory) of complex systems that is introduced in Chapter 7 (e.g., Prigogine Reference Prigogine1977; Kauffmann Reference Kauffmann1993; Bak Reference Bak1996; Levin Reference Levin1999; Mitchell Reference Mitchell2011). Social anthropology has contributed in the area of cultural theory (Thompson et al. 1989) that is at the root of our understanding of the societal reactions to different stages of the resilience dynamic (see Chapter 5), and the sciences of organization and information have contributed to our understanding of the dynamics of organization in social structures extensively discussed in Chapter 11 (e.g., Pattee Reference Pattee1973; Simon Reference Simon1969; Huberman Reference Huberman1988). Some of these ideas on the nature of organizations have been taken up and adapted by ecologists (e.g., Allen & Starr Reference Allen and Starr1982; O’Neill et al. Reference O’Neill, de Angelis, Waide and Allen1986; Allen & Hoekstra Reference Allen and Hoekstra1992). Finally, the first attempt at a synthesis of these different ideas comes from a collaborative effort of ecologists and social scientists (Holling 2001; Gunderson & Holling Reference Gunderson and Holling2002; Walker & Salt Reference Walker and Salt2006). I would like, in this section, to proffer a metadescription of what causes such societal crises.
In looking for causes of major transitions (‘tipping points’) such as the one that we are currently facing, and which all societies have encountered at some point in history, we must move away from any specific external or internal causes such as climate change, epidemics, or political (mis)management. These are of course occurring in certain instances, but one must search at a different level of generality, formulating the dynamics in a different language if one is to move from proximate to ultimate causes; causes that truly take into account that such tipping points occur in the evolution of each and every society, no matter what are their natural environment, their specific internal dynamics, or their external perturbations.
As I will argue in the next section, it seems to me that the crises (tipping points, phase transitions) that we are experiencing might be due to two simultaneous – and related – dynamics that combine to increasingly constrain our societal dynamics, narrowing the range of opportunities for their future and at the same time making management of the present more difficult: (1) the accumulation of unexpected consequences of our past actions and (2) the reduction of our value space. In the remainder of this chapter, I will deal with the former; the latter will get attention in Chapter 17.
Accumulation of Unexpected Consequences
The complexity of the Earth system or any of its subsystems is so generally accepted that it hardly requires demonstration. I have argued earlier (Chapter 7) that we need therefore to conceive of the Earth system and its (natural, social and socionatural) subsystems as a complex adaptive system (CAS) in the theoretical sense of the word; i.e., as fundamentally unstable systems of many active agents, in which both agents and processes mutually affect many other components of such (open) systems. The study of such CAS focuses on the complex, emergent, and macroscopic properties of the system that are due to the interactions of these agents. For all intents and purposes, in practice the number of interactive actors and processes at all scales approaches infinity.
Seen in these terms, the infinite complexity of the Earth system contrasts strongly with the limitations of human perception. We saw in Chapter 8 that experimental research as well as a monitoring of the archaeological record, lead us to conclude that the short-term working memory of modern human individuals limits their perception biologically to at most 7 ± 2 information sources simultaneously (Read & van der Leeuw Reference Read and van der Leeuw2008, Reference Read, van der Leeuw, Renfrew and Malafouris2009). Although over the course of human Holocene history, our species has developed an amazing array of techniques to overcome that handicap, from introducing narratives that symbolically refer to more dimensions to the introduction of many abstract concepts capturing more dimensions and to working together in groups to extend the number of dimensions that can simultaneously be perceived, nevertheless human perception, whether individual or collective, has never been able to capture the virtually infinite number of dimensions that constitute the dynamics of the Earth system, far from it.
I pointed out in Chapters 2 and 5 as well as elsewhere that the consequence of this cognitive constraint is that any human intervention in the environment is based on a very simplified perspective on the processes actually going on in that complex environmental system. On the other hand, human impact on the environment is highly multidimensional, as any human action directly or indirectly affects many of the dimensions of the socioenvironmental system involved, many more than are perceived. As a consequence, any human action upon the environment leads to numerous unexpected or unanticipated consequences (Nowotny Reference Nowotny2015). Over long-term time, although our knowledge about a certain system may increase (linearly or even geometrically), owing to the difference in dimensionality between our (individual and collective) cognitive space on the one hand, and the complexity of the system of which we are part on the other hand, the unexpected consequences of our actions increase exponentially. Or in simpler terms, though we may (correctly) imagine we know more (and are thus able to intervene and control more), in effect we know less and less about the environmental systems we are dealing with, because in the process of learning about them and interacting with them, we have changed them very profoundly in many more dimensions than we are aware of. Hence, in reality we are experiencing loss of control.
In every socioenvironmental system we therefore encounter a number of tipping points that are inherent in the human–environmental interaction itself, although they cannot be predicted a priori. Often, such crises are seen as events that are brought about by extraneous or unexpected disturbances, whether these are triggered inside or outside the socioenvironmental system. I argue, however, that such crises (sudden tipping points, or to use René Thom’s (1989) word catastrophes) are actually the inevitable result of human intervention in the environment and occur whenever a socioenvironmental system is overwhelmed by the unexpected consequences of past actions. One might therefore rephrase the definition of crisis as “A temporary incapacity of a system to process the information needed to respond to keep it coevolving with the context in which it finds itself as a result of its own antecedent actions.”
These unexpected consequences, time and again, lead to the need to make fundamental changes in that relationship – resetting the way in which human societies deal with the environment (see Chapter 10; van der Leeuw Reference van der Leeuw2012), and more specifically how they deal with the relationship between their internal dynamics and those in their environmental context (niches), as formulated by Laublicher and Renn (Reference Laubichler and Renn2015). One way to think of this interaction is illustrated in Figures 16.16a–c. In these figures, the thick line symbolizes in a stylized way the trajectory of the environment of a human system and the thin line the trajectory of the human system’s information processing. The basic idea is that, according to the principle of unexpected consequences, any human interaction with an environment transforms that environment and reduces the capacity of the society to interact with that environment. Hence, after some time, the society needs to “reset” its relations with the environment to regain the capacity to interact with it efficiently. The three figures show (Figure 16.16a) how not resetting – or not resetting in time – definitively loses the society’s capacity to interact with its environment, (Figure 16.16b) how resetting at regular intervals helps maintain the interaction between society and environment for longer, but at some point at the cost of more drastic resets, and (Figure 16.16c) how irregular and frequent resetting enables the society to maintain closer and more effective interactions with its environment.
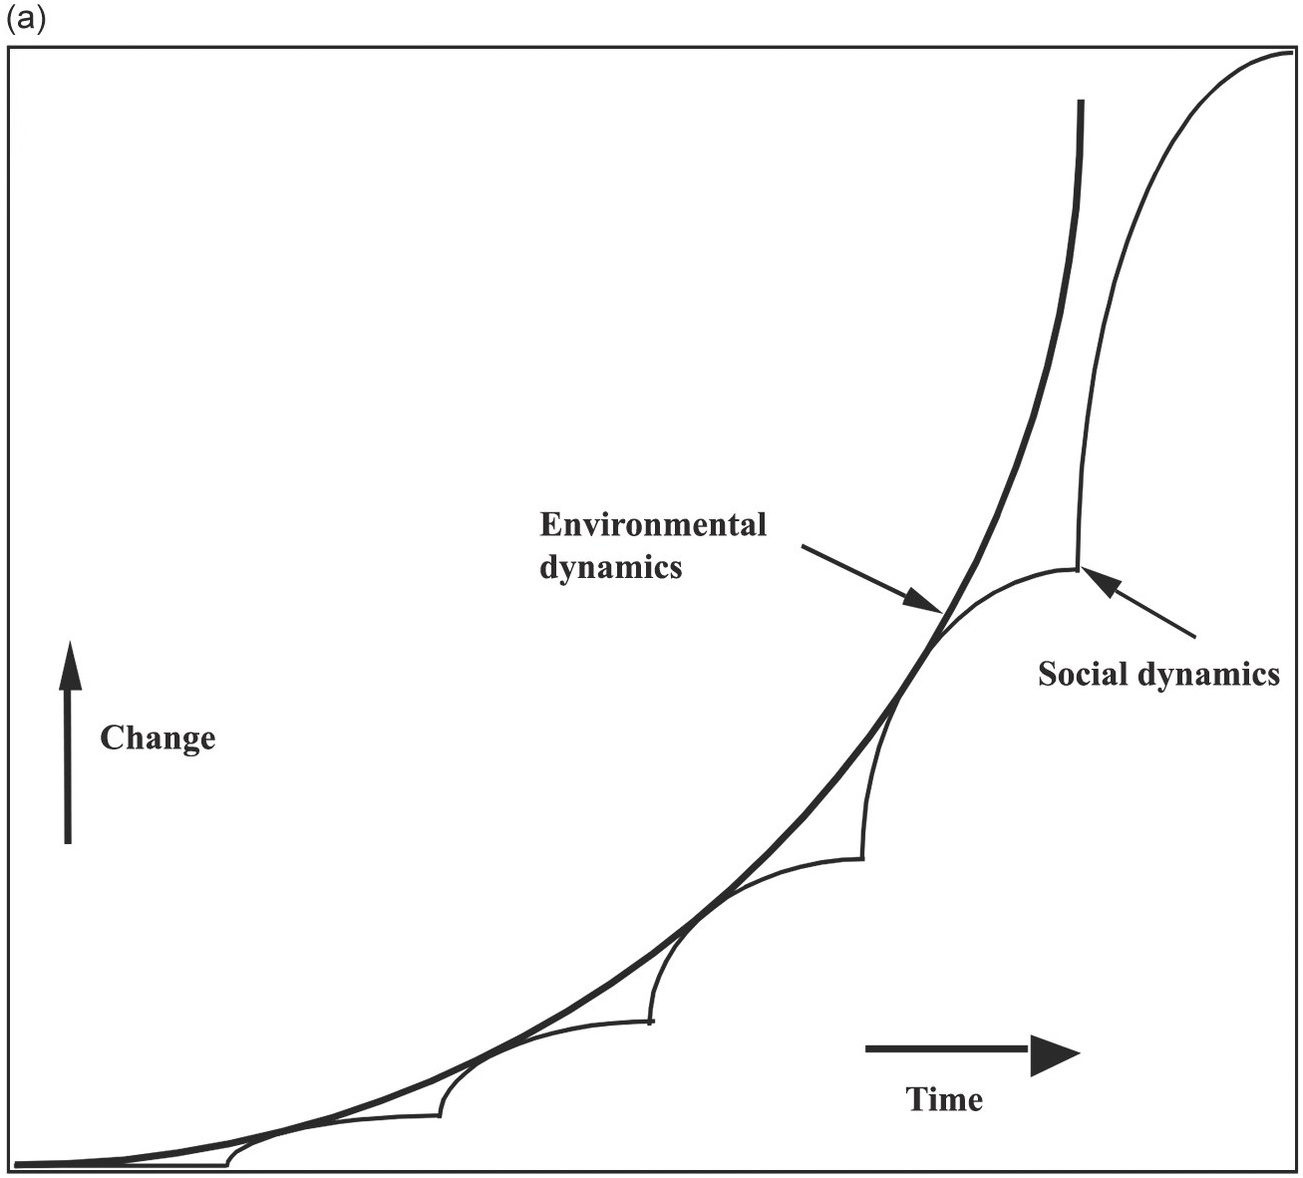
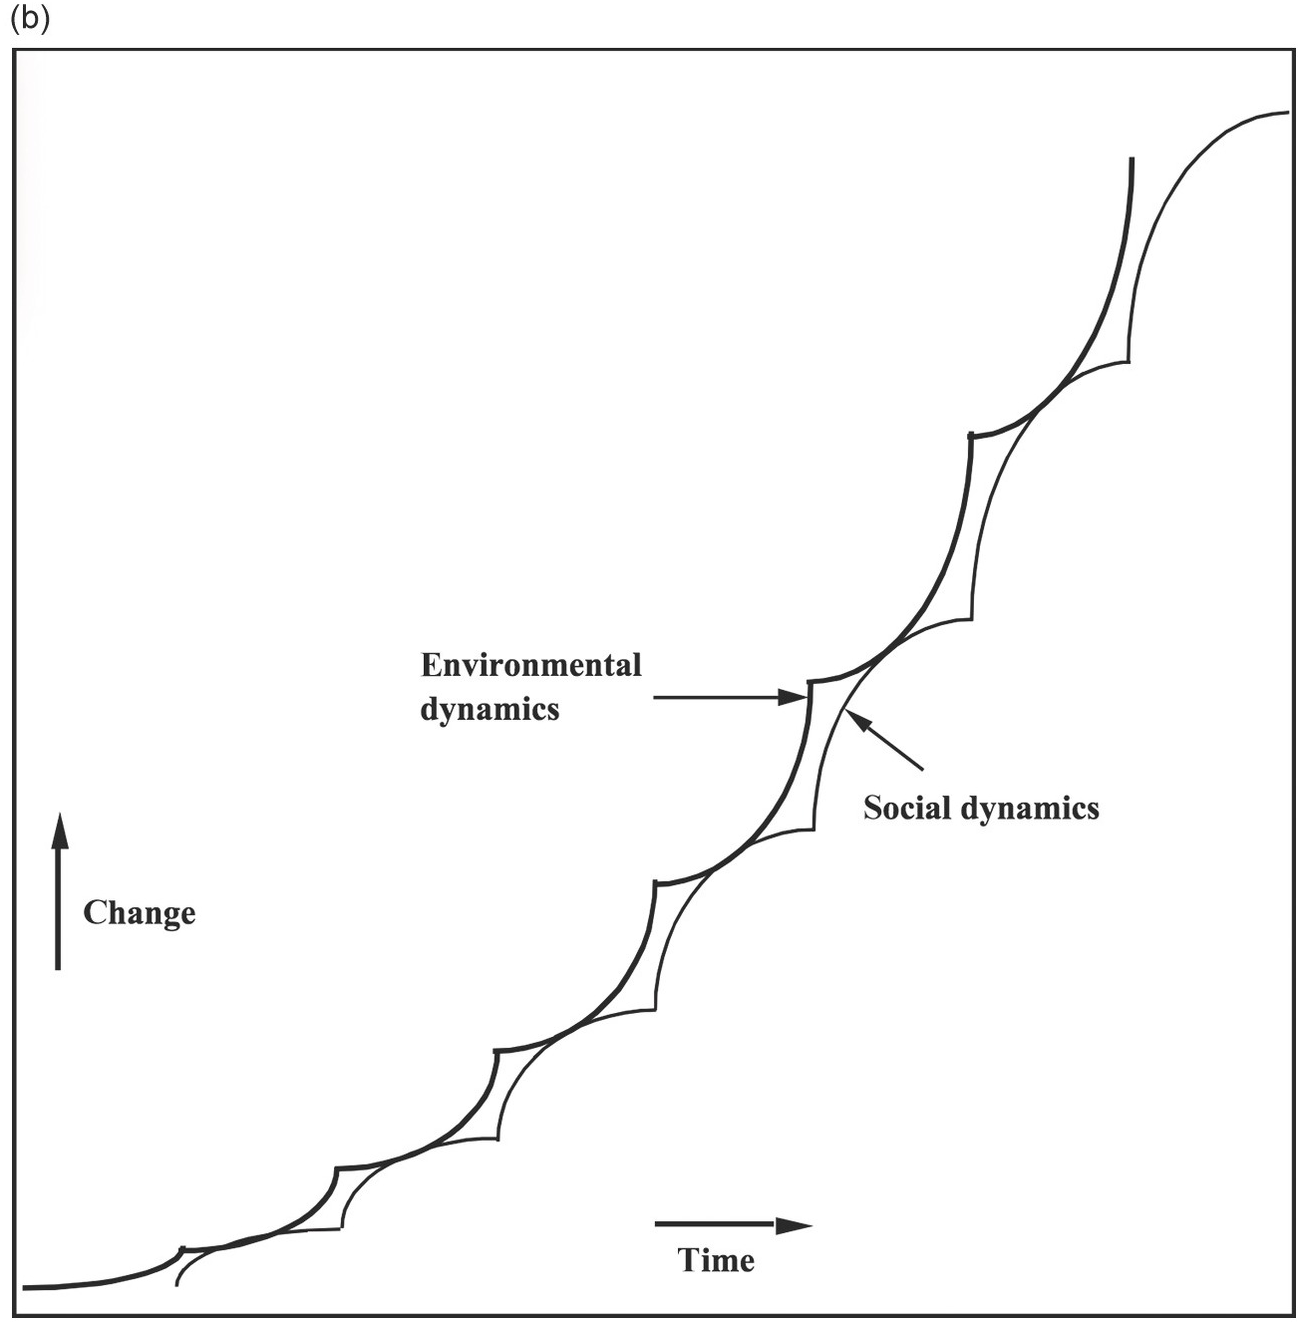
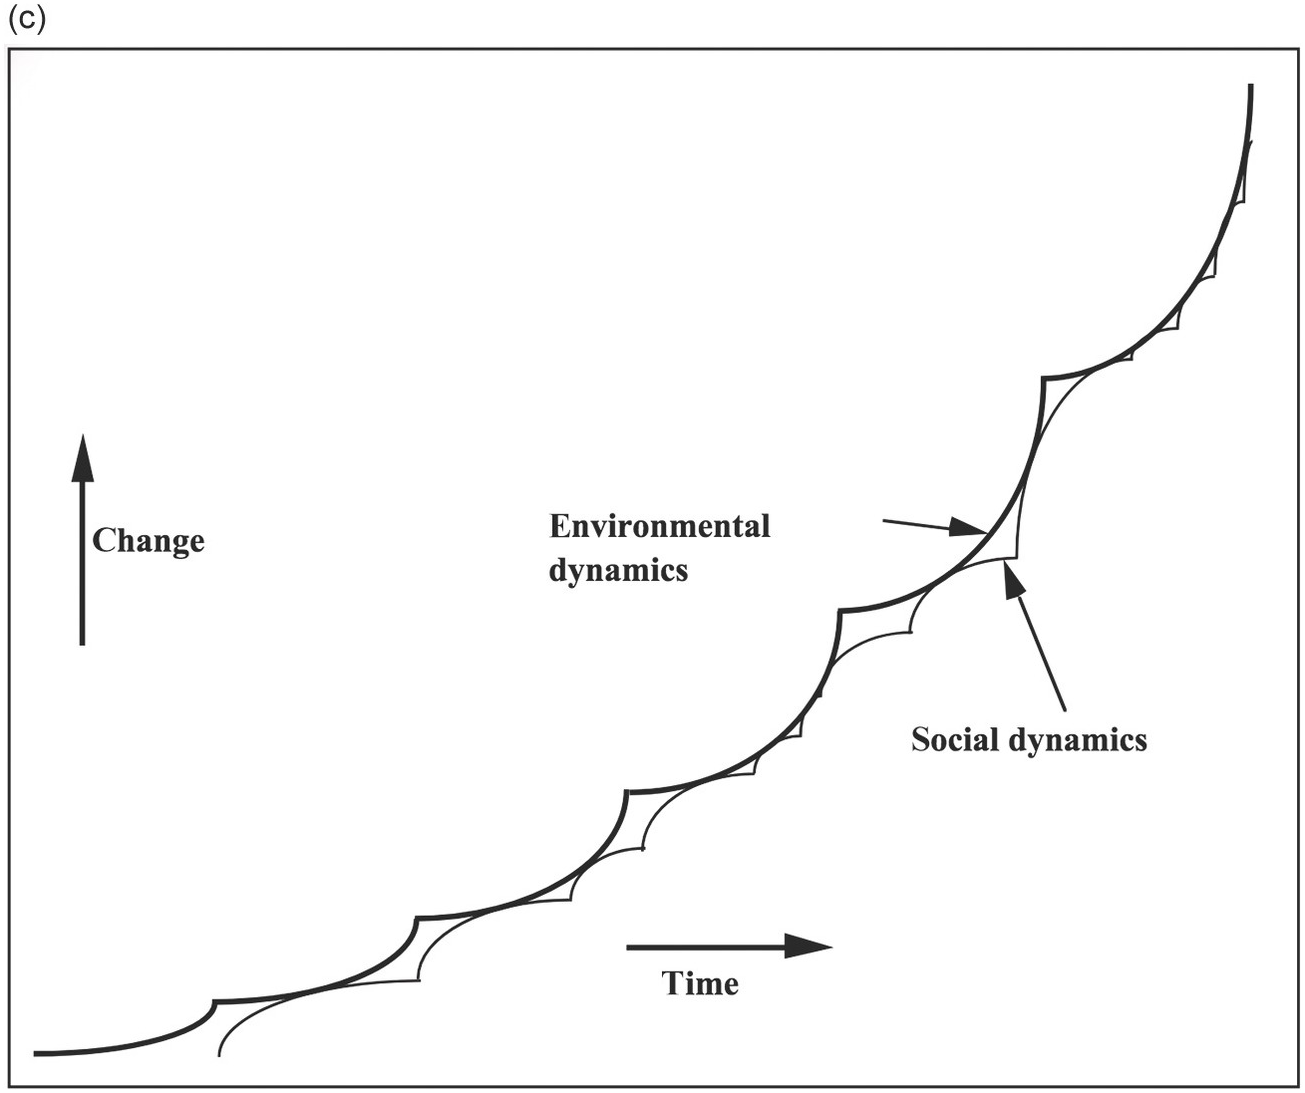
Figure 16.16a–c To stay in tune with the environmental dynamics, the frequency and timing of information-processing resets is crucial.
It should be added that as the group of interactive humans grows, and its social structure becomes more and more complex, the nature of the required resets changes. Initially, in a simple, small society (such as an isolated village), the resets are predominantly a question of adapting the societal component to changes in the natural one, but as the group grows, and societal complexity grows superlinearly with it, the spectrum of the resets shifts toward the social domain, which comes to dominate the environment.
That shift also has consequences for the frequency with which resets occur and the speed with which they happen in order to retain the cohesion of the society’s relations with the environment. Initially, in the simple social situation, the environmental dynamics have a much higher dimensionality and are therefore more complex and slower to change than the societal ones (see Ch 14). The human dynamics, which can potentially be faster (because humans can learn), can adapt to the slower environmental ones. As the societal dynamics grow more complex, and human intervention in the environment has reduced its complexity, the societal dynamics come to dominate the interaction, and societally driven adaptations are likely to follow each other faster and faster. That seems to be the current situation in the Anthropocene.
Finally, I would emphasize that these second order dynamics do not only concern the interaction between societies and their natural environments. Because all human interaction with other human beings, but also with ideas, materials, institutions, and everything else combines the dimensional limitations of human cognition with action upon a system that is much higher in dimensionality, it actually concerns any human perception–action loop, including the ones that play out in the purely societal and social, the technical, and the economic domains.
Referring to the current condition of the world system, I would argue that in the above process we have come now to a point where the gap between our societies and their global societal and natural environments, particularly in the developed nations, has grown so wide that a very major reset has become necessary. The Industrial Revolution is an excellent example of such a reset: the overall growth of European societies led to major societal tensions that were dissolved (after a considerable period of adaptation) into the kind of societal organizations we have nowadays in the western world, including new institutions, new ways of exploiting the environment (particularly in the colonies), new technologies, a huge advance in general education, and so forth. But those nineteenth- and twentieth-century innovations have now served their time, and have become maladaptations in need of a new readjustment (van der Leeuw Reference van der Leeuw, Wilson and Kirman2016). Our societies have (temporarily?) no longer the information processing capacity to deal with the accumulation of unexpected consequences of our earlier actions, and are therefore incapable of constructing effective, durable, relationships with our environment(s). That is one of the dynamics that is constraining our current and future development as global societies – we urgently need to move to a basin of attraction that is not dominated by those unexpected and unanticipated consequences of our earlier actions.


 Open access