


1. Introduction
1.1. Background
In the past, extraordinary snow conditions have been reported to have negative and sometimes even catastrophic consequences for reindeer herding in Arctic regions (Reference ReimersReimers, 1982; Reference Forchhammer and BoertmannForchhammer and Boertmann, 1993; Reference Heggberget, Gaare and BallHeggberget and others, 2002; Reference Kohler and AanesKohler and Aanes, 2004; Reference PaivioPäiviö, 2006; Reference Hansen, Aanes, Kohler and SaetherHansen and others, 2011). Ground-ice or high-density layers inhibit reindeer from penetrating the snowpack and grazing the underlying vegetation. A large spatial extent of these layers, combined with other ecological factors (e.g. cold summer or nutritionally poor forage quality), may reduce the number of reindeer. However, this is only an empirically founded hypothesis, and quantitative measurements and analysis are required (Reference TylerTyler, 2010; Reference Hansen, Aanes, Kohler and SaetherHansen and others, 2011). Recently, it has also been demonstrated that icing events at Svalbard influence reindeer movement (Reference Stien, Loe, Mysterud, Severinsen, Kohler and LangvatnStien and others, 2010).
Snowpack stratigraphy and penetrability are determined by winter weather conditions. As climate change affects the atmospheric circulation pattern, it may also affect the frequency of weather situations leading to difficult grazing conditions. It is therefore important to understand the physical processes leading to formation of high-density snow layers and ground-ice layers and linking them to weather and climate patterns. In this context, it is important to recognize that the mechanical properties of the snow cover are more decisive for penetrability than is snow depth alone. High-density layers within the snow cover or ice conditions at the snow/ground interface are caused by specific weather conditions (e.g. warm spells or rain-on-snow (ROS) events followed by cold periods). The effect of ROS events on the thermal regime at the snow/ground interface has been investigated by, for example, Reference Putkonen and RoePutkonen and Roe (2003) and Reference Westermann, Boike, Langer, Schuler and EtzelmullerWestermann and others (2011). To understand how future climate may affect reindeer husbandry, it is important to recognize how past weather events have influenced mechanical snow properties and thereby the availability of reindeer pastures. Observations from Abisko, northern Sweden, document changes in snow properties over a 50 year period (1961–2009), particularly a significant increase in very hard snow layers at ground level (Reference Johansson, Pohjola, Jonasson and CallaghanJohansson and others, 2011). The observed changes were assumed to result from increasing temperatures at the start and end of the snow season. Reference Bulygina, PYa, Razuvaev and RadionovBulygina and others (2010) report similar changes in ground-ice layers in northern Eurasia from 1966 to 2007. Likewise, future climate change will probably also influence the frequency of warm spells and ROS events (Reference Putkonen and RoePutkonen and Roe, 2003), and thereby the physical properties of the snowpack.
Different statistical approaches have been attempted to analyse winter climate, ground-ice layers and reindeer population dynamics. Different parameters have been correlated with annual population size (e.g. winter precipitation, snow depth, temperature indices) (Reference Aanes, Sæther and ØritslandAanes and others, 2000; Reference Kumpula and ColpaertKumpula and Colpaert, 2003; Reference Tveraa, Fauchlad, Yoccos, Ims, Aanes and HögdaTveraa and others, 2007). Reference Aanes, Sæther and ØritslandAanes and others (2000) showed that the amount of winter precipitation is highly correlated with the population dynamics of wild reindeer at Svalbard. Reference Kohler and AanesKohler and Aanes (2004) carried out a more sophisticated analysis of the same reindeer population, by modelling ground-ice thickness using a simple degree-day model. Winter precipitation was divided into two components, snow and ground ice, using temperature thresholds. Their statistical analysis showed that ground-ice thickness explained a large part of the reindeer population dynamics over the years 1978–2002. However, their degree-day model is limited by simple assumptions of fixed thresholds for determining snow or rain, and snow density is excluded since water passes directly to the bottom to form ground ice. High-density layers forming within the snowpack are therefore not accounted for.
In order to analyse individual snow layers as part of the snow profile with respect to access to forage, the model of choice must be a detailed snow model, which treats mechanical properties of individual (thin) layers. There are two models that have a particular focus on the mechanical properties of individual snow layers, because they have been developed for avalanche warning applications: the French model Crocus (Reference Brun, Martin, Simon, Gendre and ColéouBrun and others, 1989, Reference Brun, David, Sudul and Brunot1992, Reference Brun2013; Reference VionnetVionnet and others, 2012) and the Swiss model SNOWPACK (Reference Lehning, Bartelt, Brown, Russi, Stockli and ZimmerliLehning and others, 1999; Reference Lehning and FierzLehning and Fierz, 2008). Both allow individual precipitation events to be simulated as characteristic layers with distinct mechanical properties.
We choose SNOWPACK, which has already been evaluated for the Finnish climate (Reference Rasmus, Gronholm, Lehning, Rasmus and KulmalaRasmus and others, 2007) and has been used for climate change scenario calculations in Finland (Reference Rasmus, Raisanen and LehningRasmus and others, 2004). SNOWPACK simulates the snow layers using meteorological driving data of high time resolution. In this way, both low- and high-density snow layers are simulated. The model allows study of the weather conditions leading to formation of high-density snow layers. As well as weather and climate, both political and socio-economic factors relevant to reindeer management influence the reindeer population in a region, but we restrict our analysis to the climatic causes contributing to favourable or difficult winter grazing conditions. This study was conducted within the framework of the International Polar Year project EALAT, which addressed the impact of climate change on reindeer pastoralism (Reference Eira, Magga and EiraEira and others, 2010, Reference Eira, Jaedicke, Magga, Maynard, Vikhamar-Schuler and Mathiesen2013; Reference Magga, Mathiesen, Corell and OskalMagga and others, 2011; Reference Maynard, Guman and ReiselMaynard and others, 2011; Reference EiraEira, 2012). We provide a new approach to reindeer ecology by applying a physically based snow model to identify the occurrence of high-density layers.
1.2. Objectives
The aim of our paper is to investigate and compare the performance of two different methods for identifying winters reported to have been difficult for the reindeer population in the past in Kautokeino, northern Norway. We first carry out a statistical analysis of climate data over a long period (1900–2011) and compare with the reported years. We analyse seasonal values for temperature and precipitation, aggregated for autumn (September–November), winter (December–February) and spring (March–May) and compare with the standard normal period 1961–90. Secondly, we investigate the feasibility of using the multilayer snow model SNOWPACK (Reference Lehning, Bartelt, Brown, Russi, Stockli and ZimmerliLehning and others, 1999; Reference Bartelt and LehningBartelt and Lehning, 2002; Reference Lehning, Bartelt, Brown, Fierz and SatyawaliLehning and others, 2002a,Reference Lehning, Bartelt, Brown and Fierzb) to identify high-density snow layers or ground-ice conditions during the years 1956–2010. The model is driven by synoptic data from a weather station located in Kautokeino, which we consider is representative of a larger area. We evaluate the model results using snow temperature measurements, snow profile observations and literature records of difficult winters for reindeer herding.
2. The Snow Model Snowpack
We apply the physical multilayer snow model SNOWPACK to simulate the evolution of the snow stratigraphy (Reference Lehning, Bartelt, Brown, Russi, Stockli and ZimmerliLehning and others, 1999, Reference Lehning, Bartelt, Brown, Fierz and Satyawali2002a,Reference Lehning, Bartelt, Brown and Fierzb; Reference Bartelt and LehningBartelt and Lehning, 2002). SNOWPACK is a predictive model that uses Lagrangian finite elements to solve for heat and mass transfer, stresses and strain within the snowpack. Snow is modelled as a three-phase porous medium consisting of ice, water and air. Since the model has been developed specifically for snow avalanche warning, its strength lies in the simulation of layers that are potentially important for triggering avalanches, such as surface hoar (Reference Stossel, Guala, Fierz, Manes and LehningStossel and others, 2010) or crusts (Reference Lehning, Bartelt, Brown and FierzLehning and others, 2002b). This property makes the model particularly useful for the ecological application discussed here. With respect to avalanche warning, the model has been validated for alpine snow conditions (Reference EtcheversEtchevers and others, 2004; Reference Schirmer, Schweizer and LehningSchirmer and others, 2010), for the maritime snow of Japan (Reference Yamaguchi, Sato and LehningYamaguchi and others, 2004; Reference Nishimura, Baba, Hirashima and LehningNishimura and others, 2005; Reference Hirashima, Nishimura, Yamaguchi, Sato and LehningHirashima and others, 2008) and for the continental snow cover in the Rocky Mountains (Reference Lundy, Brown, Adams, Birkeland and LehningLundy and others, 2001) and Canada (Reference Bellaire, Jamieson and FierzBellaire and others, 2011). Additionally, it has also been validated for five boreal regions in Finland with various winter climate conditions (Reference Rasmus, Gronholm, Lehning, Rasmus and KulmalaRasmus and others, 2007). Reference Rasmus, Gronholm, Lehning, Rasmus and KulmalaRasmus and others (2007) found that the model performance improved with increasing latitude, which is probably related to increasingly cold weather conditions. They also observed a decrease in the variation of the snowpack structure with increasing latitude. Better performance was obtained during early winter than during the melting period. SNOWPACK has been used to predict possible future snow structures in Finland (Reference Rasmus, Raisanen and LehningRasmus and others, 2004; Reference RasmusRasmus, 2005).
SNOWPACK simulates the development of the snowpack during winter, based on meteorological input data. Required input parameters are air temperature, relative humidity, precipitation (or snow depth), snow surface temperature, ground surface temperature, incoming longwave radiation (or cloud cover), shortwave radiation, wind speed and wind direction. For the specified time-step, the resulting outputs are stratigraphies of, for example, snow temperature, grain types, grain sizes, liquid water content and snow density.
3. Study Area
The study area Kautokeino (Sami name: Guovdageaidnu) (69° N, 23° E) is located in a continental setting in northern Norway at ∼300 m a.s.l. at the Finnmark plateau (Fig. 1), one of the largest reindeer-herding regions in the world (Reference Magga, Mathiesen, Corell and OskalMagga and others, 2011). There are about 180 000 reindeer in Finnmark, and ∼2600 people are active reindeer herders (Reference Mathiesen and MaggaMathiesen and Magga, 2011).

Fig. 1. The study area Kautokeino (black dot), located in western Finnmark, northern Norway. Three classes of mean annual air temperature (MAAT, 1961–90) indicate regions with increasing probabilities of permafrost (Reference Isaksen, Farbrot, Blikra, Johansen, Ludvig, Eiken, Kane and HinkelIsaksen and others, 2008): (1) no permafrost where MAAT > –1 °C; (2) discontinuous and sporadic permafrost where –1 °C ≥ MAAT ≥ –3°C; and (3) permafrost widespread above timberline in areas where MAAT < –3°C. Kautokeino is located in a region with high probability of sporadic and discontinuous permafrost (class 2).
Except for a few small high-alpine localities elsewhere, inland Finnmark is the coldest and driest area in Scandinavia on an annual basis, and especially during winter (Reference TveitoTveito and others, 1997, Reference Tveito2000). The snow cover is therefore relatively shallow, though the ground is covered by snow ∼7 months per year (Reference Vikhamar-Schuler, Hanssen-Bauer and FørlandVikhamar-Schuler and others, 2010a). Snow data from 1956 to 2011 (Fig. 2) show that the onset of the snow season varied by ∼2 months, while the end varied by ∼1 month during this period. The winter maximum snow depth varied from <50cm to almost 1 m. Even though the Finnmark plateau is cold and dry by Scandinavian standards, it should be noted that reindeer-herding regions in northern Asia are usually even colder during winter, and winter precipitation is even more limited in some of those regions (Reference Vikhamar-Schuler, Førland, Hanssen-Bauer, Hygen, Nordli and SvyashchennikovVikhamar-Schuler and others, 2010b).
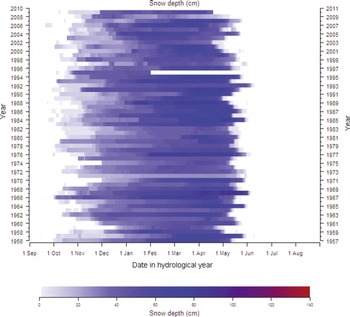
Fig. 2. Snow depth evolution in Kautokeino for the period 1956–2010. Observations are missing from January until June 1996.
Available meteorological data from Kautokeino are described in Sections 4.1 and 4.2 and show considerable interannual variability. Figure 3 presents the mean monthly temperature and precipitation for the standard normal period 1961–90 for Kautokeino, as well as the highest and lowest monthly means measured in the same period. The average winter temperature is ∼–15°C. Monthly mean values ranging from –5 to –25°C have been recorded during winter. The driest part of the year is usually winter and early spring, when mean monthly precipitation is <20mm. Monthly precipitation sums ranging from <1 mm to >50mm have been recorded in these months during the period 1900–2011. The highest monthly values for temperature (12.4°C) and precipitation sum (63 mm) are found during summer (July). The recorded monthly temperature variation is smaller in summer than in winter.
Fig. 3. The mean monthly temperature and precipitation sums for the standard normal period 1961–90, and the highest and lowest monthly means measured in Kautokeino in the same period.
The variability in daily weather conditions in Kautokeino is only to a limited degree reflected in the monthly mean values. For example, in spite of the continental winter climate, days with temperature above zero may occur even in midwinter, and precipitation as rain has been recorded in all months of the year (Reference Vikhamar-Schuler, Hanssen-Bauer and FørlandVikhamar-Schuler and others, 2010a).
4. Data
4.1. Long-term climate data
We applied official meteorological data from Kautokeino, freely available from the Norwegian Meteorological Institute (www.eklima.no), for describing the climate in Kautokeino, for characterizing the weather conditions in specific years and as driving data for the snow model. The detailed daily observations required by the snow model are available only from 1956. These data are further described in Section 4.2. For characterizing the climate in Kautokeino in a longer time perspective, monthly temperature and precipitation records were applied. These are available from observations started in Kautokeino late in the 19th century. In the present analyses we used these monthly series from 1900 to 2011.
The monthly records of temperature and precipitation are not complete. Furthermore, the station was twice relocated: in 1970, when it was moved from the valley bottom (307 ma.s.l.) to the valley side (330 ma.s.l.), and in 1996 when it was moved back to its original site. In the official data archives, no correction has been made for possible homogeneity errors (Reference NordliNordli, 1997). Both homogeneity considerations and gap filling are thus demanded. The winter temperature is expected to be slightly higher at the valley side than in the valley bottom, because of frequent temperature inversions in winter. This is in accordance with the 1961–90 climatology for the two localities, as the difference between the mean monthly temperatures at these stations is 0.2°C or less in the period May–November, while the former site is systematically 0.2–0.5°C colder in December and January through April (Reference AuneAune, 1993). Though these differences might affect long-term trend analyses, they are of little relevance from a climate variability perspective (Fig. 3). We therefore merge the temperature series from the two localities without adjustments.
For precipitation, climatological differences between the two measuring sites are expected to be minor. However, very low values of winter precipitation prior to 1970 motivated a comparison of the series from Kautokeino with regional precipitation series valid for inland Finnmark, which are based on several precipitation series in the area (Reference Hanssen-BauerHanssen-Bauer, 2005). The comparison revealed no change with respect to the regional series in 1996, but a large change from 1970 to 1971, when winter precipitation in Kautokeino increased abruptly compared to the regional curve. The reason for this is probably not the relocation of the station, but rather a windscreen which was introduced at the same time, leading to increased catch efficiency of the precipitation gauge. Adjustment factors for different months were calculated based on the ratio between the Kautokeino series and the regional series after and before the change (Table 1). In winter, the adjustment factors are considerable, which is consistent with the fact that a windscreen would affect snow far more than rain. In the present study, we homogenized the monthly precipitation series by multiplying values from before autumn 1970 with the factors given in Table 1.
Table 1. Adjustment factors used on monthly precipitation sums from Kautokeino before autumn 1970
Both for temperature and precipitation, the valid regional series were used to fill gaps in the monthly Kautokeino series following the method described by Reference Hanssen-BauerHanssen-Bauer (2005).
4.2. Driving data for the SNOWPACK model
The model was run for time series of observations digitally available from 1956 until 2010 (Table 2). All observations (precipitation, temperature, relative humidity, wind speed, wind direction and cloud cover) are recorded at 00:00, 06:00, 12:00 and 18:00 UTC, while snow depth is observed daily at 06:00.
Table 2. Driving data for SNOWPACK from the Kautokeino weather station
Snow surface temperature, ground surface temperature and radiation are not routinely observed at the weather station, but are required input parameters for the SNOW-PACK model. We used the Neumann boundary conditions for the runs to describe the heat flux between snow surface and atmosphere. Incoming longwave radiation was estimated by the model using observed cloudiness from the weather station, while we computed the potential incoming shortwave radiation using the method described by Reference HockHock (1999). The method computes the daily and seasonal cyclicity in clear-sky direct solar radiation based on latitude, longitude and surrounding topography. We computed the potential shortwave radiation for a point (weather station) on a flat surface.
Ground surface temperature below the snowpack has not been measured over the model period (1956–2011) but is required by SNOWPACK as a boundary condition at the lower end of the domain. In the absence of such measurements, the ground surface has been assumed to be 0°C (Reference Rasmus, Gronholm, Lehning, Rasmus and KulmalaRasmus and others, 2007). This assumption is not valid for the Kautokeino region, as indicated by the presence of discontinuous and sporadic permafrost conditions (Fig. 1) (Reference Isaksen, Farbrot, Blikra, Johansen, Ludvig, Eiken, Kane and HinkelIsaksen and others, 2008; Reference ChristiansenChristiansen and others, 2010). Here we derive the ground surface temperature from available observations of air temperature Tair and snow depth SD by convolution of the temperature series with a transfer function Φ depending on SD:
Here t denotes time, and the transfer function describes purely conductive heat transport through a semi-infinite medium having uniform thermal properties in terms of heat diffusivity κ (Reference Carslaw and JaegerCarslaw and Jaeger, 1986).
For the snow depth, precipitation or snow depth may be used as model input for driving SNOWPACK. If precipitation is applied as driving data, the snow depth is computed, while the use of observed snow depth directly gives accurate snow depth. We used observed snow depth as model input in our application. In this operation mode, precipitation input is still required to characterize rain events, which may lead to ground-ice and crust formation.
The SNOWPACK model simulates the evolution of layer stratigraphy for specified time-steps. Each layer is described by physical properties, i.e. liquid water content, grain type, grain size, density, temperature and depth. In our application we focus on identifying high-density snow layers which may have contributed to difficult grazing conditions. For this purpose we post-processed the output from SNOWPACK. For each time-step we identified layers having snow density above a specified threshold (tentatively 350 kg m−3). The thicknesses of these layers were summed and visualized for each individual winter from 1956 to 2010 (Figs 6 and 7). These plots represent a new approach to identify possible unfavourable grazing years due to ice conditions or hard layers in the snow.
4.3. Validation and evaluation data
We distinguish between model validation and model evaluation. By model validation we mean the assessment of the model’s ability to reproduce observed physical structures within the snow layer. To validate our snow model results, we used two different sources: (1) hourly intra-snowpack temperature measurements at Kautokeino and (2) twice-monthly snow profile measurements which describe the physical properties of the snowpack, from winter 2009/10. The snow temperature was measured at three different heights above ground (0, 10 and 35 cm) using Campbell Scientific 109 probes, based on BetaTherm 10K3A11B Thermistors (tolerance: ±0.2°C), and the data were recorded on a Campbell Scientific CR200 data logger. For practical reasons, the station was located at an undisturbed place in the vicinity of Sami University College, Kautokeino. It is referred to here as the EALAT station, and vertical snow profiles were collected twice a month at this location. These observations include identification of snow layers and measurements of their physical properties (snow density, grain type, temperature, resistance, photographies).
We use the term model evaluation to denote the assessment of the model’s ability to identify periods when snow conditions were problematic according to the reindeer herders. The evaluation data therefore consist of records of ‘difficult winters’ with respect to reindeer husbandry in the Finnmark region. There is a limited amount of literature dealing with this kind of detailed historical information. Reference TylerTyler and others (2007) described just a few examples of winters when climate conditions at the Finnmark plateau were, in different ways, unfavourable for reindeer herding. Reference Lie, Riseth and BerntLie and others (2008) included a more systematic analysis of years characterized as ‘difficult’ during the period 1953–2006. Their main sources were annual reports from the regional reindeer management areas, oral accounts from herders and managers, and statistics on reindeer losses. Since 1980 the reports from the management regions have provided less detailed information. On the other hand, the statistics on losses have been more complete. The historical record of winters with unfavourable conditions is presented in Table 3.
Table 3. Historical records of unfavourable winters for reindeer grazing in Finnmark. The information includes snow and weather conditions and possible causes of the problems. Winters in bold type represent years that contributed high reindeer losses
5. Results
5.1. Long-term climate analysis
The literature-based overview of known years with unfavourable winter conditions for reindeer herding in western Finnmark during the last 100 years (Table 3) includes 13 specific winters in addition to the unspecified ‘1930s’. Ten of the problem winters occurred after 1955, in the period covered by the snow modelling. Layers of ice or high-density snow are the most frequently mentioned problems. The formation and duration of such layers depend to a large degree on the combination of precipitation and temperature conditions throughout autumn, winter and spring. Reference TylerTyler and others (2007) used plots of seasonal temperature and precipitation anomalies to illustrate the large climate variability in Finnmark. We computed a similar plot for the 3 month period December-February in Kautokeino for the years 1900–2011 (Fig. 4). The analysis shows that precipitation varied between 20% and 200% of the 1961–90 climatology, while the average 3 month temperature variability was up to ±7°C relative to climatology. The same interannual variability was observed in our climate analysis plots covering the other 3 month periods September-November (autumn) and March-May (spring) in Kautokeino (plots not shown).
Fig. 4. Scatter plot of seasonal mean temperature and precipitation sum from 1900 to 2011 for winter (December–February) in Kautokeino. Extraordinary winters in the precipitation–temperature space are presented as filled blue circles, and unfavourable winter grazing years mentioned in the text are identified with filled triangles. Temperatures are given as anomalies from the 1961–90 mean (–15°C), and precipitation is given as a percentage of the 1961–90 mean precipitation sum for December–February (43 mm).
In these plots, the outlier years represent four types of extraordinary winters: (1) dry, cold winters (lower left), (2) wet, cold winters (upper left), (3) wet, warm winters (upper right) and (4) dry, warm winters (lower right). Note that the 13 ‘problem seasons’ do not reveal a systematic pattern within the plot, whereas the ‘problem seasons’ tend to appear in the middle of the plot (Fig. 4). As such, difficult grazing conditions are not necessarily associated with outliers in the precipitation–temperature space for the three analysed 3 month periods. However, both the coldest and warmest winters are recorded among the difficult winters. This shows that unfavourable conditions are not easily identified from mean values. It also indicates that unfavourable conditions may develop in different ways. The reindeer herders divide the period September–May into shorter periods referred to as ‘autumn’, ‘autumn–winter’, ‘winter’, ‘spring–winter’ and ‘spring’ (Reference Lie, Riseth and BerntLie and others, 2008). However, even monthly resolution of temperature and precipitation anomalies (not shown) does not reveal a systematic pattern of the problematic years, such as we can see in Figure 4.
5.2. SNOWPACK model results
5.2.1. Validation against snow measurements
Can we use the multilayer snow model to identify high-density layers? The intra-snowpack temperature measurements and snow stratigraphic observations show very promising results. Although the snow observations at the EALAT station were carried out at a few kilometres distance from the official weather station (referred to as the met.no station), both stations have practically the same weather and snow conditions. We used the observations from the EALAT station to validate the modelling results from the met.no station. The r 2 coefficient of determination for hourly observed 2 m air temperatures at the two stations is 0.97. Only for extremely low temperatures does the met.no station record significantly lower temperatures, which might be an effect of temperature inversions in the winter or a stronger local cold air pool. Observed snow depth on six occasions in 2010 (15 January, 22 January, 11 February, 1 March, 29 March and 13 April) varied only within 10 cm at the two locations.
The observed and modelled snow temperatures were compared at 0 cm, 10cm (Fig. 5a) and 35 cm (Fig. 5b) heights above the ground. Validation is performed for the days when the snow thickness (HS, following the definition by Reference FierzFierz and others, 2009) exceeded the height of the temperature sensors by >15 cm. Figure 5a and b both show that the snow temperature is modelled with too low temperatures, with an increasing deviation at lower temperatures. This may be related to the atmospheric stability corrections applied in SNOWPACK, which will lead to underestimated snow surface temperature, and therefore also internal temperatures in case of low-wind, fair-weather conditions. A roughness length of 2 mm may also have contributed to the underestimation of surface temperatures for clear nights. A systematic investigation of the effect of roughness length was not carried out, but this should be included in a future study. For temperatures around 0–5°C, there are small deviations between the observed and modelled values, and this temperature range is also most important for snow metamorphoses, melt processes and possible ice layer formation. For days with shallow snow cover (HS<10 cm), the results show that the snow temperature was modelled slightly higher than the observed temperature at the ground surface. This may be due to the observed differences in snow depth at the two stations. Overall, we conclude that the SNOWPACK model can be used for our purpose.
Fig. 5. Comparison of observed snow temperatures from the EALAT station and modelled snow temperatures from the SNOWPACK model for the period 22 October 2009 to 13 April 2010: (a) snow temperature at 10cm height above the ground, for days with HS > 25 cm; (b) snow temperature at 35 cm height above the ground, for days with HS > 50 cm.
5.2.2. Modeled high-density snow layers 1956–2010
The SNOWPACK simulations were conducted for the years 1956–2010 at 6 hour intervals and therefore resolve the processes leading to difficult winter grazing conditions such as melt-refreeze cycles. The output should thus show snow-cover development throughout the season, including effects of possible short-period extreme temperature or precipitation events. Figures 6 and 7 give an overview of the calculated amounts of snow with density above a threshold value (set to 350 kgm−3) from autumn to spring in all years during this period. According to the model, both the relative amounts of such dense layers (Fig. 6) and their absolute vertical extent (Fig. 7) varied widely throughout the season as well as between years. For several winters during the 1970s and 1980s, no such layers were simulated by the model. On the other hand, the years 1966/67, 1967/68 and 1991/92 according to the model had 10 cm or more of dense snow layers at least from December to May. These features fit well with the historical record of difficult winter grazing conditions (Table 3). While few climate-related problems were reported in the 1970s and 1980s, all three years with extensive modelled high-density layers are among the reported problem years. In fact 1966/67 and 1967/68 were reported to be among the five most problematic winters in the modelling period. The 1967/68 winter was famously a catastrophic one for reindeer husbandry (Reference TylerTyler and others, 2007). According to Reference Lie, Riseth and BerntLie and others (2008), one has to go back to 1917 to find similar losses of reindeer. The output of SNOWPACK also indicates that 1967/68 is the most extreme of the modelled winters, as a substantial high-density layer formed as early as November and lasted until July (Fig. 8a and b). The model simulations from November 1967 demonstrate how a ‘warming event’ (ROS event) followed by extreme cold formed a high-density layer.
Fig. 6. Percentage of total snow depth having density above 350 kgm−3 for the hydrological years 1956–2010 (1 September–31 August).
Fig. 7. Sum (cm) of vertical extent of layers having density above 350 kg m−3 for hydrological years 1956–2010 (1 September–31 August).

Fig. 8. The difficult grazing winter 1967/68 in Kautokeino. The ROS event in November 1967 formed a high-density snow layer that persisted throughout the winter.
For the other years within the modelling period that were reported to have especially unfavourable winter conditions (1961/62, 1996/97 and 2000/01), the model indicates the existence of dense snow layers, though not as extensive and long-lasting as in the three above-mentioned years. Another five winters within the modelling period were also reported to be difficult. For two of these (1957/58 and 1965/66) the model does not simulate high-density snow layers (Figs 6 and 7), though ‘ice conditions’ are reported in Table 3.
There are also some years when the model results indicate formation of some high-density snow layers, but when no problems were reported. For the years since 1980, the fact that the reporting of grazing conditions has been less systematic (Reference Lie, Riseth and BerntLie and others, 2008) may explain some discrepancies between the model results and Table 3. However, the model also simulated high-density snow layers for the 1960/61, 1962/63 and 1975/76 winters, which are not reported to have been problematic.
Altogether, the model results indicated possible ice problems in eight of the ten reported ‘problem years’, and in all those reported as most problematic. From 1956/57 to 2006/07 there are also 30 winters when neither the model nor the information summarized in Table 3 indicates problems connected to snow conditions. However, in two years the model failed to simulate ice layers though they were reported (‘failed detection’), and it also indicated some ice layers in nine years when no problems were reported (‘false alarms’). In the discussion we take a closer look at the model performance and uncertainties related to the categories ‘false alarms’ and ‘failed detection’.
6. Discussion
6.1. Why the climate data analysis does not identify unfavourable winter conditions
Results of the climate data analysis demonstrate that processes leading to high-density snow layers occur on timescales that are not resolved by monthly values. There are at least two reasons why the unfavourable seasons do not show a clear signature in Figure 4. First, seasonal or even monthly means do not necessarily capture extreme events. For instance, the mean temperature for December 1961 was far below the 1961–90 average. Nevertheless, there was a ‘warming event’ in that month, with temperatures above 0°C. If followed by extreme cold, such events may lead to the formation of ice layers in the snow. Although high mean values of the temperature during winter months probably imply increased frequency of warming events, such events may also occur in generally cold periods. Secondly, whether or not given seasonal conditions are unfavourable for reindeer may depend on the previous and/or following season. A cold spring may be unproblematic after a reasonably dry winter with easily available pastures, but if heavy ice layers have formed during autumn or winter, a cold spring may be catastrophic (Reference Lie, Riseth and BerntLie and others, 2008).
6.2. Why the SNOWPACK model identifies many of the documented unfavourable winters during 1956–2010
Overall, the model simulations of winters with high-density layers correspond quite well with the historically reported winters. There are several advantages of using a physical snow model such as SNOWPACK in comparison to a climate data analysis. The physical snow model applied available meteorological data observed at 6 hour intervals as driving data. This time resolution allows modelling of the physical processes (warming events and ROS events) that lead to formation of high-density snow layers. These processes are not captured by a climate data analysis of monthly values. There is still a question whether the 6 hour time resolution of the meteorological data is enough to identify the warming events usually leading to the ice-layer formation. The simulations using the SNOWPACK model include both a high-resolution dataset and the snow process modelling. A future study could focus on distinguishing these two effects. However, the snow process simulations also allow us to study where in the snowpack ice layers or high-density layers appear, which would be impossible using only meteorological data of high time resolution. The SNOWPACK model also simulates grain types, such as depth hoar. Depth hoar consists of large faceted grains which are very poorly bonded and therefore advantageous for winter grazing conditions. The validation data from the Finnmark region did not contain extensive and detailed information on this matter. In a future study, however, observations of ice layers and depth hoar would be a very useful dataset for detailed model validation.
In the simulations a threshold of 350 kg m−3 was applied to sum up the vertical extent of the high-density layers. This threshold is empirical and should be regarded as a relative measure. With available ice-layer observations it could be set more specifically.
In our approach for deriving ground surface temperature below the snowpack, the thermal diffusivity κ represents the bulk diffusivity of snow, averaged over the season, and we adopted κ=10–7m2s−1. This method has previously been used to quantify the thermal dynamics of permafrost and found to be valuable for negligible heat production, i.e. for relatively dry sites with little water available (Reference Roth and BoikeRoth and Boike, 2001). That we capture the temperature dynamics at the snow/soil interface with this approach is a strong assumption, which may be the cause of some of the simulation errors. In the future, we could include the soil layers below the snow in the SNOWPACK simulations and use an assumed constant geothermal heat flux at some depth to better represent the soil/snow interface.
6.3. On false alarms and failed detections
The validation of the snow density simulations against the historical records of difficult winter grazing conditions (Table 3) revealed a few ‘false alarms’ and ‘failed detections’. ‘False alarm’ represents a winter where the model simulations identify high-density snow layers, while the annual report from the Sami Reindeer Management in Norway does not contain information about difficult snow conditions. ‘Failed detection’ represents the other case, where the annual report contains description of difficult winter grazing conditions while the model simulations do not identify high-density snow layers. There are several possible causes for these errors. First of all we have modelled the situation in Kautokeino, or, more precisely, the location of the weather station in Kautokeino. The simulations are only valid for this location. However, we assume that this point is representative of a larger region, using the historical records as validation data. The annual reports cover the weather and snow conditions over the entire Finnmark plateau. As such, the conditions in Kautokeino may be good while the conditions were difficult in other areas of Finnmark. The spatial variability of snow depth and its layer densities is probably quite large. As such, this spatial variability is not captured when modelling a single point. A future study should therefore contain several stations to improve the representation of the region. Since the historical literature records are inadequate and non-systematic over time, reports from northern Sweden support the information in Table 3. Reference PaivioPäiviöä (2006) describes historical winter grazing conditions leading to catastrophic years for reindeer herding in the Jokkmokk region. He reports 1967/68 as a catastrophic year for reindeer herding, in addition to the 1935/36 and 1955/56 winters. Furthermore, he describes the second part of the 1970s and the entire 1980s as years with favourable winter grazing conditions, while conditions in the 1990s were unfavourable.
Other reasons for the ‘false alarms’ and ‘failed detections’ may be a combination of factors occurring within a year. For instance, difficult summer grazing conditions lead to a reindeer population of weak animals, even before the start of the winter. A cold summer, followed by a winter with large amounts of snow, may therefore also represent difficult winter grazing conditions not captured by the model simulations, when only snow density is studied. However, by analysing combined factors, ‘failed detections’ may be reduced. Another cause of ‘false alarms’ or ‘failed detections’ is the reindeer-herding aspect. A reported non-difficult year may in fact have had difficult snow conditions, or areas with ground ice layers, but the reindeer herders acted wisely by moving their animals to better grazing areas, and thereby avoided losses of animals.
7. Summary and Conclusions
We have compared the performance of two different methods for identifying winters reported to have been difficult for the reindeer population in the past in Kautokeino.
The long-term climate data analysis based on monthly values of precipitation and temperature (1900–2011) demonstrated that the reported winters were difficult to identify systematically. These are generally not extreme winters with regard to monthly or 3 monthly mean values.
The physical snow model SNOWPACK successfully simulates high-density snow layers in eight of the ten reported difficult winters during the period 1956–2010. The time resolution of the driving data (6 hours) allows modelling of the physical processes (warming events and ROS events) leading to formation of high-density snow layers.
The model simulations indicate that 1967/68 is the most extreme winter in terms of high-density snow layers. During the modelling period 1956–2010, this winter is reported as the most catastrophic for reindeer husbandry, with considerable losses of animals caused by ground-ice layers in conjunction with long snow-cover duration (Reference TylerTyler and others, 2007).
For several winters during the 1970s and 1980s, no high-density snow layers were simulated by the model, and this is consistent with the literature records.
The analysis revealed a few ‘false alarms’ and ‘failed detections’. These are related to different types of uncertainties in the modelling and the validation data.
There is no systematic reporting of causes (snow conditions, ice layers, spatial extent, human action) of losses of animals during the period 1956–2010. There are also no measurements of ice layers available. Hence, the analysis is validated against a non-homogeneous dataset. The spatial variability of snow depth and its layer densities is probably quite large. As such, this spatial variability is not captured when modelling a single point. In addition, reported winters may also have been caused by a combination of several problematic factors (e.g. a cold summer followed by a deep, persistent snow cover).
Overall, this paper provides a new approach to the study of past snow conditions related to high-density snow layers. In a future study it will be interesting to increase the number of stations to improve representation of the spatial variability, and also carry out systematic measurements of snow densities and ice layers. This study also indicates that, if sufficiently detailed climate scenarios are available, the SNOWPACK model may be used as a tool for estimating the possible effect of global warming on conditions for reindeer husbandry.
Acknowledgements
This study was financially supported by the Research Council of Norway, project IPY (International Polar Year) EALAT-RESEARCH: Reindeer Herders Vulnerability Network Study: Reindeer Pastoralism in a Changing Climate (grant No. 76078/S30), by the Nordic Council of Ministers and by the International Centre for Reindeer Husbandry, Kautokeino, Noway. We thank Philip Burgess for establishing and maintaining the automatic weather station for recording temperatures in the snowpack in Kautokeino 2009–10. We also thank Ole Isak Eira and Ravdna B.M. Eira for providing assistance in collection of snow data. This study also received support from the Research Council of Norway, project CRYOLINK (grant No. 185987/V30).


