


Introduction
The retreat of mountain glaciers in central Asia has attracted considerable attention in recent years. A monitoring station has been maintained since 1959 on Urumqi glacier No. 1, located at the headwaters of the Ürumqi river in the Tien Shan, China. Currently the glacier is 2.4 km long and covers an area of 1.95 km2, but over the observation period (up to 2000) it has undergone a vertical net loss of ∼80 cm, the terminus has retreated by 171.0 m and the total area has shrunk by 0.217 km2 (Reference Jiao, Jing and HanJiao and others, 2004). The glaciers in the southern Qinghai-Tibetan Plateau have retreated an average 6 m a−1 over the 20th century (Reference Zheng and ShiZheng and Shi, 1975; Reference ZhengZheng, 1982; Reference Ren, Qin and ZingRen and others, 1998, Reference Ren, Qin and Kang2003; Reference Su and PuSu and Pu, 1998; Reference Pu, Yao, Wang, Su and ShenPu and others, 2004), and glaciers in the Qilian Shan on the northern margin of the plateau have also retreated since the 1970s (Reference Wang and LiuWang and Liu, 1983; Reference Xie, Wu and WangXie and others, 1985; Reference WangWang, 1993; Reference Shen, Liu, Wang and LiuShen and others, 2001; Reference Liu, Shen and SunLiu and others, 2002). This distinct glacial change has commonly been attributed to the recent climatic warming in the study areas, which may have raised the snowline elevations (Reference Yao, Jiao and YangYao and others, 1995, Reference Yao, Qin and Tian1996; Reference Wang and YaoWang and Yao, 2003; Reference Yang and YaoYang and Yao, 2004). However, the specific processes that impact individual glaciers require further investigation. For example, Reference Zhang, He and PangZhang and others (2004) linked water resources to the accumulation histories of individual glaciers, and concluded that the regional glacier changes are closely associated with the summer monsoon indices on the Asian continent.
The Chongce ice cap (35˚14’ N, 81˚07’ E), located in the west Kunlun Shan along the southern margin of the Taklimakan desert (Fig. 1), was cored in 1992. This glacier has provided a variety of records of climatic and environmental change in this arid region. This paper focuses on the relationship between two of these records, atmospheric dust content and the snow accumulation.
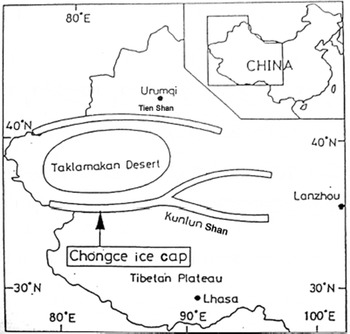
Fig. 1. Map showing the location of the Chongce ice cap in China.
Ice Physics and Analytical Methods
The Chongce ice cap extends over a distance of about 7 km, and contains two prominent domes at 6530 and 6374ma.s.l. The ice core, which is 18.7 m long, or ∼40% of the total ice thickness, was drilled on the higher dome, the summit of which is presumably situated on an ice divide. In situ temperature measurements in an adjacent borehole that reached bedrock showed that at 15 m.b.s. (meters below surface) the ice was −17.5˚C, while at the ice/rock interface it was −17.1˚C, indicating favorable conditions for preserving the climatic and environmental records.
Core segments (0.3−0.5 m long) were packed and sealed in polyethylene tubes, and stored in a cold room at −20˚C until the samples were prepared for analysis. After densities were determined for each of the segments, 2−5 cm thick samples were cut. The outer layers of the samples were cut away and analyzed for oxygen isotopic ratios (δ18O) using a Finnigan MAT mass spectrometer. The remaining interior portions were analyzed for major anions (NO3 −, SO4 2-, Cl−) using a Dionex-100 ion chromatograph, and for cations (Ca2+, Mg2+, K+, Na+) using a Seiko SAS 7500 atomic absorption spectrophotometer equipped with a flame atomizer. These samples were measured for pH using a TOA FAR-101 pH meter. Microparticle analyses were performed with a Coulter Counter Multisizer, which, when equipped with a 30 μm aperture tube, counts particles from 0.66 to 21.4 μ m in 32 size ranges. The residual melt from each of the samples was collected, and some samples were combined, to meet the volume requirement of ∼50 mL for individual tritium (3H) measurements. These were analyzed by direct beta (β) measurements in a liquid-scintillation spectrometer.
Core Dating and Determination of Snow and Dust Deposition Rate
Snow erosion by strong winds observed at the summit is thought to be the dominant cause of the very low accumulation at this site. Bamboo stake measurements from 26 August 1987 to 4 October 1992 show that over nearly 5 years the net snow accumulation totaled 93.6 cm, for an annual average of 18.7 cm of snow, or 7.3 cmw.e., which translates to 73 kg m2 a−1. This value is much lower than the average of 200−500 kg m−2a−1 for the whole glacier (Reference Nakawo, Goto-Azuma and HanNakawo and others, 1994), and even smaller than the minimum criterion of about 200 kgm−2a−1 for efficient application of δ18O to the establishment of chronology through seasonal variations (Reference Dansgaard, Johnsen, Clausen and GundestrupDansgaard and others, 1973). Fortunately, since the glacier is composed of ‘clean ice’ without any visible dust layers, this insures that less ‘noise’ in the dust signal was introduced from local sources. In addition, the dominant size fraction of the dust particles is <10 m m, which is similar to that of polar ice sheets. This allows us to attempt to date the core based on seasonal variations in microparticle concentrations, as was done successfully for some polar glaciers (Reference Hammer, Oeschger and LangwayHammer, 1989). The sharp seasonal variation of airborne dust in western China, which is evident from dust loading from mid-February to late May with a strong maximum in late April to early May (Reference Merrill, Uematsu and BleckMerrill and others, 1989), is manifested in the dust record of the Chongce ice core. Measurements of particle concentrations in the 0.66−1.33 μm size range, in association with the variation of the chemically related ionic component Ca2+, were used to construct the chronology. The dating was calibrated by the presence of the prominent 3H reference horizon produced by the nuclear weapons test in 1962−63; thus the uncertainty in the timescale is reduced to within 1 year, or about 1% of the ice-core length. The reconstructed timescale extends back to ∼90 years before 1992 (Fig. 2). An extended description of these methods can be found in Reference Han and NakawoHan and Nakawo (2005).
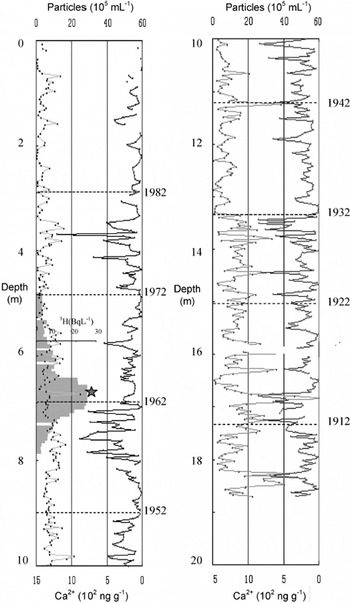
Fig. 2. (a) Records of microparticles ranging in size from 0.66 to 1.33 μm (left) and Ca2+ concentration in ng g−1 (right) vs ice-core depth. Every 10years is marked (dotted lines), and the 1963 nuclear-test reference horizon is noted with a star. 3H measurements (in Bq L−1) between 5 and 8 m.b.s. are illustrated by shaded bars.
The density calculations were multiplied by their respective layer thicknesses to reconstruct the annual net snow accumulation. The total particle weight concentration (W) for each sample, in mg kg−1, is determined by:
where N is the particle concentration per mL of sample, D1 and D 2 are the diameters (in μm) of the particles in duplicate measurements of each sample (assuming that the particles are spherical) and p is the average density of the dust, which is assumed to be 2 g cm−3 (Reference Wagenbach, Geis, Leinen and SarntheinWagenbach and Geis, 1989). The dust deposition rate (A) is obtained by summing the weights of all the samples in an annual layer:
where i denotes the ith sample in the annual layer and hi denotes the corresponding thickness.
Overall Decreasing Trends In Snow and Dust Deposition
The temporal sequence of dust deposition rate (in μg cm−2 a−1), along with the snow accumulation rate, for the past 60 years is plotted in Figure 3. Although the time series developed for the core extends back to 1903, the data from 13 to 18.7 m.b.s., corresponding to the interval 1903–32, were not included in this figure because the microparticle analyses were incomplete. The similarly decreasing trend in the two profiles is noticeable. Since the main features of snow redistribution in a glacier by wind are constant with time at a given location (Reference LliboutryLliboutry, 1974), the relative changes in the annual snow/ice layer thickness calculated for the past 60 years should be significant for the precipitation trend. This should be true even though the values for snow accumulation rate should be regarded as a lower limit, since the effects of erosion result in the net accumulation being smaller than the actual precipitation.
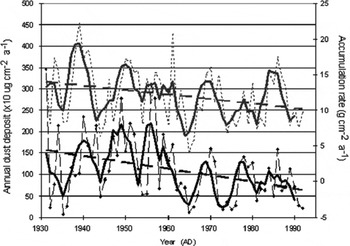
Fig. 3. Variations of annual dust deposition (lower curve) and snow accumulation rate (upper curve) between 1930 and the early 1990s recorded in the Chongce ice core. The solid lines represent 3 year smoothing averages, while dashed lines denote the linear trends.
In light of the similar trends of dust deposition rate and accumulation on the Chongce ice cap over these six decades, the following points deserve further investigation:
-
1. Among all the various aerosols such as SO4 2–, what processes allow dust particles (despite their non-hygroscopic character) to act as cloud condensation nuclei (CCN), which affects precipitation at high altitudes?
-
2. What processes allow dust aerosols to serve as the principal factor controlling the precipitation at high altitudes, which over recent decades has shown a decreasing trend at the same time that the precipitation rate at the lower elevations around the Taklimakan desert has been increasing (Reference Zhang, He and PangZhang and others, 2004)?
-
3. Assuming that the persistently decreasing dust content in the sink area has a close relationship to that in the source region, is there evidence for linkages from source to sink areas in terms of dust formation, transportation and deposition processes?
Dust Trends Around the Taklimakan Desert
Until the 1950s, there existed no systematic meteorological observation network around the Taklimakan desert. Since then such a network, consisting of more than 30 stations, has been established and measurements of three types of atmospheric processes conducive to the dispersion of atmospheric dust, i.e. dust storm, blowing sand and floating dust (Reference LiLi, 1991), have been logged. These observations indicate an overall decline of dust events in any of these forms over the last four to five decades (Reference He, Yang and LiHe and others, 2003). Variability in such trends is typically represented by the sandstorm days per annum, which are characterized by extraordinarily strong gales with wind speeds >20 m s − 1 that lift tremendous amounts of soil–mineral particulates into the air, reducing visibility to <1 km in places such as Hotan and Aksu (Fig. 4). The Chongce ice-core records reflect this tendency over the same time-span (Fig. 3). Such changes were partially attributed to the weakening of prevailing winds around the deserts in southern Xinjiang Province. The incidence of sandstorms at more than ten observed stations dropped from 136 in the 1960s to 33 in the 1990s (Reference CuiCui, 2000), and the average maximum wind speed diminished from 9.32 ms− 1 in the decade 1960–70 to 6.88 ms− 1 in the decade 1980–90 (Reference ShiShi, 2003).
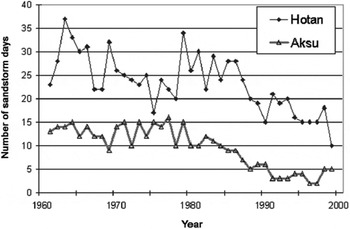
Fig. 4. Sandstorm days per year in Hotan and Aksu, 1960–2000. This figure first appeared in Reference Wang, Ma, Chen and ZhangWang and others (2003).
Over the same period the vegetation cover in the surrounding region appeared to increase. The normalized differential vegetation index (NDVI) shows that, since the 1980s, vegetation has spread over several representative sites including Hotan (Reference Ma, Dong and WangMa and others, 2003). This growing ground cover efficiently hinders desertification, thus mitigating severe soil erosion. The driving force behind the vegetation growth in these inland arid regions is the increasingly humid climate during recent decades. Reference Yu, Wang and LiYu and others (2003) noted an increase in the vapor content of the atmosphere in northwestern China since the 1980s. One of the two centers of increasing precipitation is located in the Tarim basin, where the Taklimakan desert is located. Over the last 40 years, annual precipitation has increased >30% (Reference ShiShi, 2003) and discharge from high mountain rivers has also increased significantly (Reference Zhang, Wu and WangZhang and others, 2003).
It seems that conditions are unfavorable for dust sources to increasingly supply suspended material in the air over this time. It is also apparent that atmospheric dust tends to be removed by scavenging by the increasing water-vapor condensation, resulting in decreasing dust burden in the middle atmosphere. The major factors acting on airborne dust and their inherent effects on each other in the middle troposphere are illustrated in Figure 5.
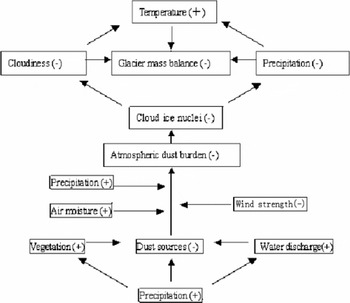
Fig. 5. Diagram of variables related to the dust processes and their inherent connections to the mass-balance changes of high mountain glaciers under increasingly wet climate conditions over the inland arid region.
Air-circulation patterns over the Tarim basin during the main dust season have been investigated extensively. In the spring, the air from surrounding high mountains descends into the basin. The late-winter northerlies and northwester-lies above 500 mbar persist across the north of the desert, then travel around to the east site of the Tien Shan (Fig. 1). Locally named the Kara Bran (or ‘black wind’), this wind is much stronger than airflow from other routes and carries a tremendous amount of dust from the desert. The dust moves upward due to convergence and then moves southwards. In this way, the entrained fine size fraction can be carried to the middle or even upper troposphere (Reference Geng and ZhaoGeng, 1985; Reference Zhao and ZhaoZhao, 1985). Such source–sink relationships strongly confirm the suggestion that the dust trend found in the Chongce ice-core record is indicative of decadal dust trends occurring around the Taklimakan desert.
Dust Effects on Precipitation-Forming Processes at High Elevation
When aerosol particulates act as cloud condensation nuclei (CCN), both their chemical properties and their size ranges are critical (Reference JungeJunge, 1977). Hygroscopic particles may become centers of growth for water droplets as the supersaturation reaches a critical threshold. However, when temperatures become sufficiently cold during transport, the cloud ice nuclei (CIN) may become activated. Unlike condensation nuclei, these consist of non-hygroscopic particles with crystal lattice structures and shapes conducive to ice formation. Therefore, aerosols derived from crust erosion generally make good ice nuclei (Reference KumaiKumai, 1968; Reference Pruppacher and KlettPruppacher and Klett, 1978). Clouds can contain liquid droplets at temperature down to –30˚C, known as supercooled water (Reference Davidson, Oeschger and LangwayDavidson, 1989). This combination of microscopic particles and cloud formation in cold regions is most efficiently achieved with particulates in the submicron to micron size range, typically 0.1–2 μm in radius.
High altitudes where glaciers form provide temperatures below 0˚C for the annual average at the equilibrium line, but also provide a good environment for CIN from dust aerosols to form. In the case of the west Kunlun Shan, the dust that originates from the Taklimakan desert undergoes size sorting during entrainment before traveling over several thousand meters, and only particles <10 μm in diameter remain in suspension over such distances. In the Chongce ice-core record, >75% of the dust population is composed of particles with radii <2 mm. This combination of low temperatures and fine-dust availability allows the available airborne particles to act as CIN in preference to other aerosols such as SO4 2–, and to play a dominant role in the precipitation-making process. It also leads to the effective wet deposition of the dust itself (Han and others, 2005). This could serve as an explanation for the similar variability of the accumulation and dust concentration profiles that are illustrated in Figure 3.
In addition, the CIN of dust aerosols plays an indirect role in glacier dynamics. A 30% decrease in cloudiness is equivalent to a 25% decrease in precipitation in a glacial area, and has the same effect on glacier retreat as a temperature increase of 1˚C (Reference HoughtonHoughton and others, 2001). Decreases in CIN might therefore contribute to negative influences on glacier mass balance, resulting in glacial ablation in the long run (Fig. 5, top half).
Conclusions
The above argument regarding the importance of CIN to precipitation might apply differently for individual glaciers. In the case of Ürümqi glacier No. 1, with a snowline altitude of 4000 m, the dust concentration is high because of the low relief between the glacier and the Taklimakan desert. However, the airborne dust burden decreases with increasing elevation. Here, as long as temperatures become low enough for CIN processes to be activated, the vapor supply must be the primary determinant of precipitation. As it is located in an area where precipitation is increasing, the primary cause for the retreat of Ürümqi glacier No. 1 is most likely the temperature increase over recent decades (Reference Jiao, Jing and HanJiao and others, 2004). The Chongce ice cap provides an example of how dust aerosols play a dominant role in the precipitation processes independently of the moisture supply. It demonstrates that mountain glaciers above a certain elevation seem to be more sensitive than lower-elevation glaciers to the air-burden dust particulates and their effects on snow accumulation. As the dust population available for CIN at these altitudes is not as great as at the lower elevations, change in the population must directly influence the precipitation regime. The present trends of both accumulation and dust concentration observed in the core are closely associated with the climatic trends in the inland arid region; the coherent decreases might continue provided the current climate trend surrounding the desert persists.
The environmental record from the Chongce ice cap provides a time series of the dust burden for the Taklimakan desert region, but it can only be taken as an individual case, because any particular ice-core record could be tied closely to the deposition process of its glacier, or even that of its own drilling site. For example, opposite trends between snow accumulation and dust concentration have been reported from Guliya glacier (Reference Yao, Jiao and YangYao and others, 1995), which is also located in the west Kunlun Shan. In another case, snow accumulation has decreased while dust has increased over the past 100 years in Dasuopu glacier (7200m a.s.l.) in the Himalaya (Reference Thompson, Yao, Mosley-Thompson, Davis, Henderson and LinThompson and others, 2000). Additional research on the relationship of both moisture and dust to the precipitation in association with the regional climatic patterns should help to explain the complicated atmospheric processes affecting the glacial mass balance at high altitudes.
Acknowledgements
We are indebted to all of the members of the field expedition. We also thank H. Kanda for generous assistance with the laboratory analysis. We gratefully acknowledge the contribution of the ‘Aeolian Dust Experiment on Climate Impact’, the Special Coordination Funds for the Promotion of Science and Technology, Japan (No. 62041043 and No. 63043030). We thank the reviewers for valuable comments and suggestions, and M. Davis for correcting the English.


